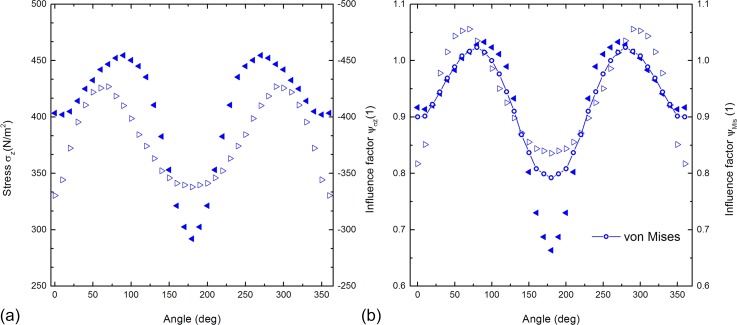
FIG. 4.
Both the figures are based on simulations of a cell rotating around a stationary cell at a constant distance (Figure 1). (a) The stress component in the z-direction is plotted versus the rotating angle . We determined the stress of the AP and the BP of the stationary cell represented by solid and non-filled triangles, respectively. (b) The values represented by the triangles show the influence factor of the AP and the BP of the stationary cells plotted against the rotating angle (left vertical axis). The calculated influence factor of the cell surface is represented by the line and circles (right vertical axis).

