

Abstract
Alcohol use during adolescence represents a major health concern given that this is a period in which the brain continues to undergo critical developmental changes. Much behavioral research has been conducted in animal models of alcohol exposure and a vulnerable period in adolescence has been identified that suggests lasting effects of ethanol exposure during adolescence. However, identification of molecular changes underlying the behavioral outcomes observed as a result from exposure to ethanol during adolescence remains a major technical challenge. In this chapter, we describe a method that allows for assessment of the effects of chronic ethanol exposure during adolescence relative to adulthood through global-scale analysis of protein expression as well as evaluation of behavioral responsivity in adolescent and adult rats. Results from this type of analysis can facilitate identification of age-specific molecular markers associated with behavioral changes following treatment with ethanol or in other animal models of drug abuse.
Keywords: ethanol, proteomics, mass spectrometry, behavior, differential protein expression profiling, biomarker
1. Introduction
Adolescence is a unique time period during which individuals typically experiment with alcohol and consequently are at a greater predisposition to develop alcohol dependency. This developmental period is important since studies show that adults with substance abuse disorders initiate alcohol and drug use in adolescence, a period of considerable brain growth (1). Furthermore, the use of alcohol early in life is a critical predictor of abuse liability later in life for humans (2,3). To date, little research has focused on understanding the molecular mechanisms of alcohol’s effects in the developing animal, and even less on the effects of adolescent ethanol exposure and subsequent adult responses. The need for an adolescent animal model of alcohol abuse that examines both behavioral changes and molecular changes associated with alcohol has been raised (4,5). Thus, it is critical to examine the lasting behavioral and molecular impact of ethanol exposure during development of brain reward mechanisms and on subsequent function.
Adolescents differ from adults in ethanol-induced behavioral responsivity, underscoring the importance of studying adolescence. For example, adolescent animals consume more ethanol than adults (6) and ethanol intake levels are high throughout adolescence and decrease to levels slightly higher than adult comparisons (7). Additionally, ethanol exposure during adolescence potentiates subsequent preference for ethanol in adult mice (8) and developing animals differ from adults in pharmacological sensitivity to ethanol (5) with preweanling rats differing from other ages in ethanol tolerance (9). Adolescent rats develop an ethanol-induced place preference more readily than adult animals (10) and showed a heightened preference for novelty (11). In this chapter, an approach to determine potential age-specific ethanol-induced changes in behavior is described.
In order to determine the molecular mechanisms underlying age-specific behavioral changes observed in an animal model after chronic ethanol exposure, proteomics-based analysis can be employed to provide an unbiased global scale assessment of ethanol-induced neuroprotein differential expression. For example, changes in various high abundance proteins in adolescent rat hippocampus have been observed after chronic alcohol exposure using proteomic analysis by 2D gel electrophoresis (12). A mass spectrometry-based relative protein quantitation approach for the proteomic analysis of brain tissue in an in vivo model of chronic ethanol exposure is described here and is an effective methodology that can complement other proteomics-based techniques such as 2D gel electrophoresis, ultimately to provide a molecular link at the protein level to various age-specific alcohol-induced behavioral outcomes. This approach incorporates either a “label-free” or a chemical tagging method using isobaric tags for relative and absolute quantitation (iTRAQ) (13) depending on the instrumentation that is available for mass spectrometry analysis.
2. Materials
2.1. In Vivo Chronic Ethanol Exposure
2.1.1. Subjects
Male Sprague-Dawley rats (Harlan Laboratories, Indianapolis, IN) derived from established breeding pairs are used as subjects.
Litters are sexed and culled to 10 pups per litter on postnatal day (PND) 1, with the day of birth designated as PND 0. Pups remain with their respective dams until PND 21, when pups are pair-housed with same-sex littermates.
Animals are maintained on a 12:12 hour light: dark cycle (lights on at 0700 hr), in a temperature and humidity-controlled vivarium. Animals are allowed free access to food and water throughout the experiment. No more than one male pup per litter is used in any given condition. Animals are randomly assigned to conditions. Maintenance and treatment of the animals are within the guidelines for animal care by the National Institutes of Health.
2.1.2. In Vivo Ethanol Exposure
Dilute ethanol from a 95% stock solution (Pharmaco-Aaper, Shelbyville, KY) to 17% v/v in saline (0.9 % NaCl). The vehicle is an isovolumetric administration of saline. Both ethanol and saline are intraperitoneally administered as a 1.5 g/kg dose. This is achieved by multiplying the weight of the animal by 0.01117.
2.2. Behavioral Assessment
Locomotor activity can be assessed using a behavioral video tracking system (we use Ethovision from Noldus Information Technology, Utrecht, The Netherlands) where the signal is tracked (the movement of the animal is digitally recorded) with a camera suspended above the dimly lit circular open field.
The open field is 60 cm above the floor composed of a black Plexiglas floor (diameter = 96.5 cm) and an opaque circular barrier measuring 45.7 cm high (see Note 1). The animal is allowed free access to move about the entire area, in which the center of gravity of the animal is recorded (see Note 2).
2.3. Tissue Processing and Protein Sample Preparation
Prepare fresh lysis buffer for tissue homogenization: 8M urea (Thermo Fisher Scientific, Rockford, IL), 0.1% sodium dodecyl sulfate (SDS) in 50 mM triethylammonium bicarbonate (Sigma Aldrich, St. Lois, MO) with protease and phosphatase inhibitors (Halt Protease and Phosphatase Inhibitor Cocktail from Pierce Biotechnology). Store for up to 2 weeks at 4°C.
50 mM tris-(2-carboxyethyl)phosphine (TCEP) and 200 mM methyl methanethiosulfonate (MMTS) in isopropanol for protein reduction and alkylation, respectively. These reagents can be obtained from the iTRAQ reagent kit (AB Sciex, Foster City, CA).
Sequencing grade modified trypsin (Promega, Madison, WI) for protein digestion. Prior to use, resuspend 20 μg vial of lyophilized trypsin in 20 μl of Milli-Q®.
iTRAQ labels and other reagents needed for labeling (ex., ethanol) are commercially available as a kit (either 4-plex or 8-plex comparison) through AB Sciex. A similar technology named Tandem Mass Tags (TMT) is available as a kit (up to 6-plex comparison) through Thermo Fisher Scientific.
2.4. Liquid Chromatography Tandem Mass Spectrometry Analysis
Major instrumentation for the proteomic analysis of rat brain tissue includes a HPLC system capable of nanoflow rates (250 nl/min) for online reversed-phase HPLC separation of the rat brain protein tryptic digests and a mass spectrometer. For relative protein quantitation by spectral counting, a low resolution mass spectrometer such as a quadrupole ion trap can be used. However, higher resolution is ideal for analysis of iTRAQ-labeled peptides. Specific items used in the proteomic analysis reported in this chapter are listed below.
One ml C18 solid phase extraction (SPE) cartridges (Grace, Deerfield, IL) for peptide desalting prior to mass spectrometry analysis.
A 75 μm i.d. × 2 cm C18 capillary trap (Proteopep II, New Objective, Woburn, MA) and 75 μm i.d. × 15 cm C18 analytical column (Proteopep II, New Objective, Woburn, MA) using a nanoHPLC system (Eksigent, Dublin, CA).
LC-MS/MS analysis for relative quantitation by spectral counting is carried out with a linear ion trap instrument (LTQ XL, Thermo Fisher Scientific). Mass spectrometric analysis for iTRAQ-based quantitation is carried out on a hybrid linear ion trap-Orbitrap mass spectrometer (LTQ Orbitrap XL, Thermo Fisher Scientific) (see Note 3).
2.5. Mass Spectrometric Data Analysis
Several data analysis software packages can be used for processing of mass spectrometric data for relative protein quantitation by either spectral counting or iTRAQ. Standard database search engines for protein identification include Sequest (Thermo Fisher Scientific) and Mascot (Matrix Science). Relative quantitation based on spectral counting as well as iTRAQ is routinely performed in our lab by the program Scaffold (Proteome Software, Portland, OR); however, other commercial packages such as the quantitation toolbox in Mascot Distiller (Matrix Science) and Proteome Discoverer (Thermo Fisher Scientific) can be used for iTRAQ data analysis.
3. Methods
3.1. In Vivo Chronic Ethanol Exposure
Beginning on PND 28–29 for adolescents and PND 58–59 for adults, handle all animals for 5 min each day. This handling involves transporting animals from the colony room to the laboratory, where they are weighed and marked for identification purposes.
Position animals for an intraperitoneal injection and gently restrain in that position for 30 seconds twice during the five minutes to allow animals to acclimate to the experimental manipulations. Allow animals to move freely about the hands and arms of the experimenter during the rest of the 5 min. Following these 5 min, return rats to their homecage.
Administer ethanol once a day for 21 consecutive days at the dose of 1.5 g/kg or an isovolumetric administration of saline for control animals. On PND 30, PND 36, PND 43 and PND 50, for adolescent rats, and PND 60, PND 66, PND 73 and PND 80, for adult rats, assess behavior (described below) for changes in ethanol-induced or saline-induced locomotor activity.
On all intervening days, transport animals from the colony to the laboratory, weigh, and intraperitoneally administer their respective saline or ethanol treatment between PND 30–50 for adolescent animals and PND 60–80 for adult animals.
3.2. Behavioral Assessment
On days in which animals undergo behavioral assessment for ethanol-induced or saline-induced changes in locomotor activity, transport animals from the colony room, weigh and immediately introduce to the open field.
When animals are introduced to the open field, randomly introduce them into different quadrants, with their head facing the outside barrier. This enables the animal enough time to turn around and approach the center zone. Given that adolescent and adult animals are different sizes, this allows for standardization of the animal approaching the center zone.
During the initial 40 min of habituation to the open field, animals do not receive any treatment. After 40 min in the open field, enter the room and remove the animal from the open field.
Administer the saline or ethanol dose and quickly return the animals to the open field (see Note 4). Animals remain in the open field for an additional 50 min, in which the behavior is digitally recorded by the video tracking system.
Following the 50 minutes after treatment administration, remove animals from the open field and return to the homecage.
Before introduction of the animal to the open field and between trials, clean arena with Quatricide (Pharmacal Research Laboratories, Naugatuck, CT), a deodorizer and disinfectant, and subsequently with 70% ethanol (Pharmaco-Aaper, Shelbyville, KY) to remove any lingering odors. Allow to completely dry before introducing the animal to the open field.
Several parameters can be assessed using the tracking system. The entire arena can be digitally zoned to assess changes in behaviors (ex., the inner center zone and the entire arena). The behavioral parameters assessed included total distance moved in both the entire arena and the inner zone, time in the inner zone and latency to approach the inner zone. Given the center of gravity is used as the point for the tracking signal, animals had to enter from the forepaws forward to have been recorded as entering the center zone. Representative animal movement for one adolescent rat after ethanol injection obtained from the video tracking system is shown in Fig. 1.
The behavioral trial can be quantified using several parameters, including total distance moved (cm), time in zone (sec), approaches to zone (frequency) and latency to approach the center zone (sec,) for the entire trial or across time (ex. ten min intervals). The Ethovision software digitally records the trial based on the initial parameters used when setting up the arena, including the proper background for visualizing the animal, even lighting, and the use of nonreflective surfaces. All these factors enable the software to distinguish the animal from the background in order to quantify the movement of the animal based on the user-entered dimensions utilized when setting up the arena.
Fig. 1.
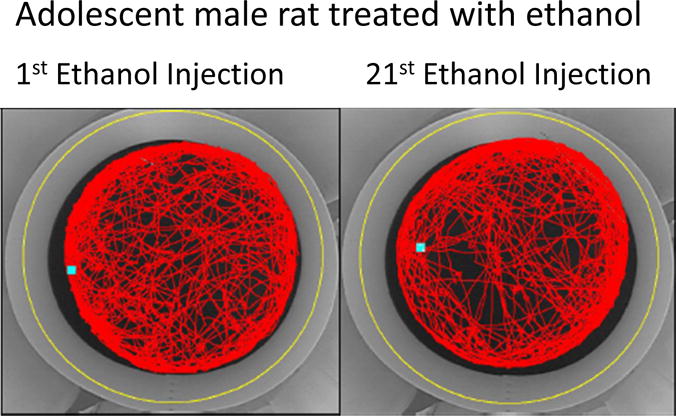
Data depicted are visualizations of the entire track for an individual animal for the entire arena. Adolescent animal treated with ethanol for the first time (left panel) and the twenty-first time (right panel).
3.3. Tissue Processing and Protein Sample Preparation
3.3.1. Protein Extraction from Brain Tissue
On PND 65 for adolescent-exposed rats and PND 95 for adult exposed rats (see Note 5), harvest brain tissue and prepare tissue for micro-dissection of relevant regions (see Note 6).
Add 2 ml of cold (4°C) extraction buffer (see section 2.2) and homogenize samples using a tissue homogenizer until all tissue is completely disrupted (see Note 7).
Disrupt tissue lysate with 6 bursts (2 sec each) of sonication while on ice. Centrifuge at 20,000 × g for 15 minutes at 4°C.
Once homogenized and sonicated, incubate samples on ice for 30 minutes to allow for additional protein solubilization.
Remove the supernatant taking care not to disturb the pelletted cell debris. Protein samples (supernatant) can be stored at −80°C if stopping at this point.
Determine protein concentration of samples with a Bradford or Bradford-like protein assay using BSA as a standard.
3.3.2. Protein Digestion with Trypsin
Reduce up to 100 μg of total protein (be sure to have equivalent amounts in control and ethanol-treated groups for adult and adolescent animals – 4 groups total) by adding 2 μl of the TCEP reducing agent (to every 20 μl of protein solution) followed by incubation at 60 min at room temperature. Alkylate the reduced cysteine residues by adding 1 μl of MMTS solution (to every 20 μl of protein solution + 2 μl reducing agent) and incubate for 10 min at room temperature.
Add 5 μl of sequencing grade trypsin solution to the protein samples and then digest samples overnight at 37°C.
3.3.3. Preparation for Label-Free Relative Quantitation
Load tryptic digests directly onto a 1 ml pre-conditioned C18 solid phase extraction column, desalt with three column volume washes of 0.1% TFA, and elute with one column volume of 80% acetonitrile, 0.1% TFA (see Note 8).
Dry samples in a vacuum centrifuge and resuspend in 50 μl of 0.1% formic acid in water. Analyze the control (adult and adolescent) and ethanol-treated (adult and adolescent) samples separately by LC-MS/MS (section 3.4) with at least 2 technical replicates.
3.3.4. iTRAQ Labeling of Protein Digests
Following trypsin digestion, reconstitute each iTRAQ reagent in 70 μl ethanol and then add to a maximum of 100 μg of the digested samples (see Note 9). Biological averaging can be accomplished by pooling protein samples from multiple animals in each group.
Four iTRAQ reagents (114, 115, 116, and 117) are utilized to label two groups of control (adult and adolescent) and two groups of ethanol-treated (adult and adolescent) samples. In the described experiment, 114, 115, 116, and 117 were used to label the control adolescent, ethanol-treated adolescent, control adult, and ethanol-treated adult groups, respectively.
Allow labeling to proceed for 1 hour at room temperature. Pool the four samples prior to vacuum centrifugation.
Centrifuge pooled samples under vacuum until dryness to rid the sample of organic solvent prior to rpHPLC analysis-tandem mass spectrometric analysis (see Note 8).
3.4. Liquid Chromatography Tandem Mass Spectrometry Analysis
Perform online rpHPLC-tandem mass spectrometric analysis of the tryptic digests for label-free analysis using a mass spectrometer equipped with a nanoelectrospray ionization source. The mass spectrometer should be recently tuned (which includes ionization source as well as ion transfer optic parameters) and calibrated with appropriate calibration mixture.
Load rat brain protein digest onto a 75 μm i.d. × 2 cm capillary trap and desalt with 3% acetonitrile, 0.1% formic acid for 5 min prior to injection onto a 75 μm i.d. × 15 cm analytical column. Following peptide desalting and injection onto the analytical column, a linear gradient provided by a nanoHPLC system is carried out to 40% acetonitrile, 0.1% formic acid in 120 min at 250 nl/min.
The methods presented are for rapid mass spectrometric analysis of rat brain tissue and will result in the identification of typically <1,000 proteins. In order to increase proteome coverage, protein and/or peptide fractionation by various gel and/or chromatographic separation techniques is generally required.
3.4.1. Mass Spectrometer Acquisition Conditions for Spectral Counting
For quantitation based on spectral counting, use a data-dependent mode of acquisition in which a full m/z scan is performed followed by MS/MS analysis of the top five most intense precursor ions. The number of precursor ions in each data-dependent cycle can be adjusted based on the scan speed of the mass spectrometer and chromatography conditions.
Collision-induced dissociation (CID) in the linear ion trap (LTQ XL) for this experiment is performed using a 3.0-u isolation width and 35% normalized collision energy with helium as the target gas. Set the precursor ion dynamic exclusion time for at least 30 s – this is the time period in which the precursor ion is excluded for MS/MS analysis once CID is performed on the ion.
Inspect the LC-MS/MS chromatograms for each group to ensure adequate reproducibility in extraction and mass spectrometric analysis has been achieved for relative quantitation based on spectral counting.
3.4.2. Mass Spectrometer Acquisition Conditions for iTRAQ-Labeled Peptides
For analysis of iTRAQ-labeled peptides using the LTQ Orbitrap XL, use the data-dependent mode of acquisition in which an accurate m/z survey scan is performed in the Orbitrap mass analyzer. This scan is followed by CID MS/MS of the 3 most intense peptide ions in the linear ion trap in addition to higher energy collisional dissociation (HCD) fragmentation of the same peptides where resulting HCD fragment ions are detected in the Orbitrap mass analyzer.
Set mass resolving power to 7500 at m/z 400 in the Orbitrap for HCD fragment ion detection to minimize the data-dependent acquisition cycle times (this resolving power is sufficient for analysis of the iTRAQ low mass reporter ions).
3.5. Mass Spectrometric Data Analysis
3.5.1. Database Searching
Extract the tandem mass spectrometric data generated by data dependent acquisition using appropriate software (for example, BioWorks version 3.3 for Thermo raw data files) and search against a species appropriate current protein sequence database (rat for this analysis) containing both forward and reversed or randomized sequences using a database search algorithm such as Mascot and/or Sequest (see Note 10).
Search mass spectrometric data with a fragment ion mass tolerance and a parent ion mass tolerance relevant to the specifications of the mass spectrometer used. For an ion trap instrument such as the LTQ XL, the parent and fragment ion mass tolerances should be below 2.5 Da and 1 Da, respectively. For the Orbitrap, the parent ion mass tolerance should be below 10 ppm and with most high resolution mass spectrometers, this value should be below 25 ppm.
Select the digestion enzyme trypsin with the possibility of one missed cleavage and the protein modifications carbamidomethylation of cysteine (as a fixed modification from the alkylation step) in addition to oxidation of methionine and N-terminal protein acetylation (as variable modifications).
For the database search of iTRAQ-labeled peptides, the iTRAQ (4-plex) modification of lysine residues and peptide N-terminal amino group should be specified as a fixed modification and iTRAQ modification of tyrosine as a variable modification.
Establish a database search score cutoff by assessing the peptide false discovery rate (an appropriate value is typically less than 1%) based on the number of reversed or randomized sequences that are identified from the database search. Manually validate some MS/MS spectra to ensure all peaks are appropriately annotated by the search algorithm (i.e., no intense peaks are present that are unlabeled and fragmentation is in agreement with what is expected for CID-based fragmentation).
The software program Scaffold is employed to validate MS/MS-based peptide and protein identifications. Peptide identifications are accepted if they could be established at greater than 95.0% probability as specified by the Peptide Prophet algorithm (14). Protein identifications are accepted at a probability level assigned by the Protein Prophet algorithm (15) that establishes an appropriate (<1%) false discovery rate.
Fig. 2 shows MS/MS spectra of representative tryptic peptides and corresponding sequence coverage of hippocalcin and alpha-synuclein, two proteins that are highly expressed in the hippocampus, that were identified upon LC-MS/MS analysis of a tryptic digest of rat hippocampus protein extract on a LTQ XL instrument.
Fig. 2.
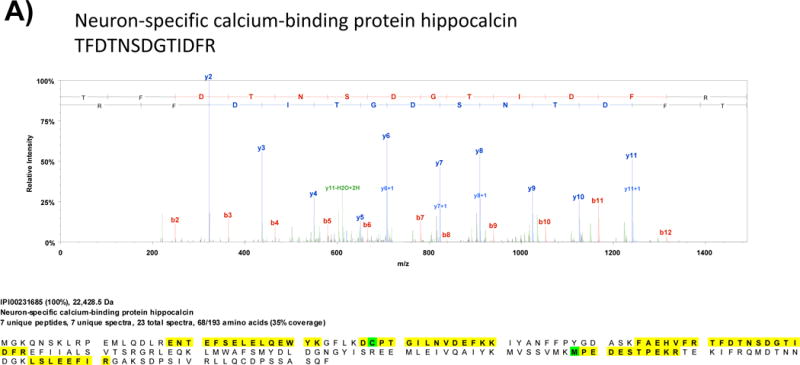
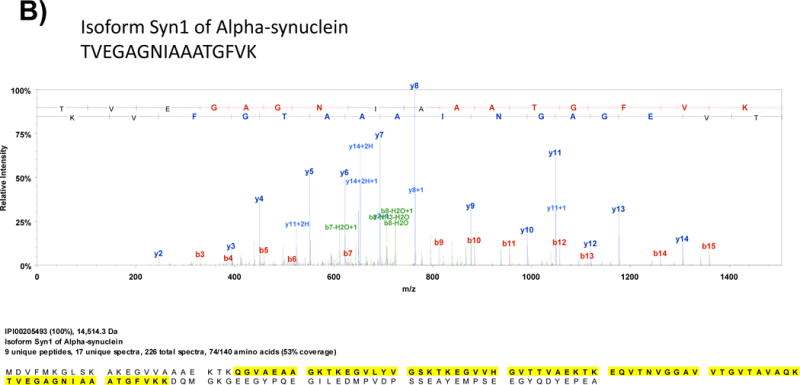
Representative MS/MS spectra obtained from LC-MS/MS analysis of a tryptic digest of rat hippocampus protein extract on a linear ion trap instrument (LTQ XL). After a protein database search, the proteins A) hippocalcin and B) alpha-synuclein, which are high abundance proteins in the hippocampus, were identified.
3.5.2. Relative Protein Quantitation by Spectral Counting
Scaffold allows the user to compare multiple proteomic datasets and sort the list of identified proteins by various parameters including spectral counts. In the spectral counting method, the total number of MS/MS spectra identified for a particular protein is used as a measure of its abundance and consequently this parameter can be used for relative protein quantitation as shown below.
- The change in abundance is determined by the ratio:
where ntreated and ncontrol are the total number of identified MS/MS spectra for a particular protein in the ethanol treatment and control group, respectively. A normalization factor (tcontrol/ttreated) can be applied that uses a ratio of total number of identified spectra for all proteins in the control and treated groups (see Note 11). - A G statistic test (likelihood ratio test for independence) (16) is then utilized to determine statistical significance for each protein ratio:
where G is the G test statistic; ccontrol is (ncontrol + 1); ctreated is [(ntreated + 1)(tcontrol/ttreated)]; and tct is (ccontrol + ctreated)/2. The G statistic value is approximately characterized by a χ2 distribution with 1 degree of freedom, allowing p-value calculations for each ratio value (see Note 12).
3.5.3. Quantitation of iTRAQ-Labeled Peptides
The iTRAQ reagent is an isobaric tag which produces no m/z distinction of the control and treatment groups within a precursor ion survey scan (first stage MS). However, upon ion selection and CID/HCD, low mass “reporter” ions are generated which have distinct m/z values ranging from 114 to 117 (allowing for simultaneous comparison of up to four samples).
Example MS/MS spectra of an iTRAQ-labeled tryptic peptide, AIAELGIYPAVDPLDSTSR, derived from the beta subunit of ATP synthase are shown in Fig. 3. The top spectrum represents MS/MS data for the iTRAQ-labeled tryptic peptide obtained by CID in the linear ion trap of the LTQ Orbitrap XL. The middle spectrum is the same tryptic peptide fragmented by HCD and detected in the Orbitrap. The sensitivity in the linear ion trap allows for sequence identification; however, a majority of spectra are missing the low-mass reporter ion region. The HCD fragmentation allows for detection of these low-mass reporter ions for the purpose of iTRAQ quantitation.
The intensity of the reporter ion corresponds to the abundance level of that particular peptide within a given control or treatment group. The expanded m/z region showing the iTRAQ reporter ions is displayed in the bottom spectrum of Fig. 3. In this example, the tryptic peptide abundance of AIAELGIYPAVDPLDSTSR from ATP synthase beta subunit (in addition to other peptides not shown) is the same in all groups. Therefore, it can be concluded that this particular protein is not differentially expressed after a fourteen day washout period following chronic ethanol exposure.
Quantitation is performed automatically within the Scaffold (Q+ version) program. Ratios are calculated based on a user-defined reference reporter ion (in this experiment, the control adolescent group with the iTRAQ 114 label was used as the reference). Report statistically significant (p<0.05) changes in expression after manual interrogation of the quantitation data (see Note 13).
Fig. 3.
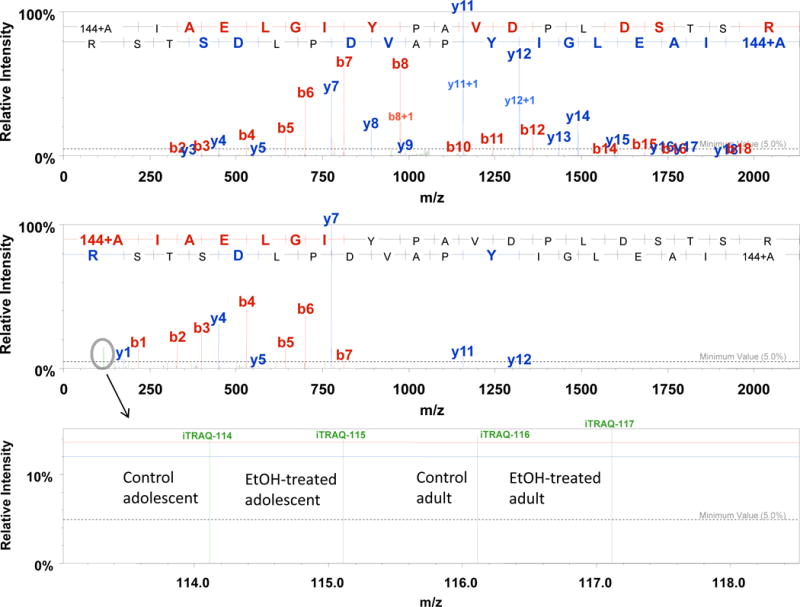
MS/MS spectra obtained from LC-MS/MS analysis of an iTRAQ-labeled tryptic digest of rat hippocampus protein extract on a hybrid linear ion trap-Orbitrap instrument (LTQ Orbitrap XL). The peptide selected for MS/MS was a population of pooled peptides from the control adolescent (114 tag), ethanol-treated adolescent (115 tag), control adult (116 tag), and ethanol-treated adult (117 tag). The top spectrum was obtained in the linear ion trap for high sensitivity MS/MS analysis while HCD was performed on the same peptide to obtain the low mass reporter ions needed for quantitation (middle spectrum). The bottom spectrum is an expanded m/z region of the HCD spectrum showing the signal intensity of each reporter ion. The intensity of the reporter ion is used for peptide quantitation to ultimately determine what proteins are differentially expressed. In this example for ATP synthase beta subunit, the abundance level of this protein was determined to be the same in both adolescent and adult groups after a 14 day washout period following chronic ethanol exposure.
Acknowledgments
We thank Jean Horak and Jancy Mathew for technical assistance and the Florida Center of Excellence for Biomolecular Identification and Targeted Therapeutics Proteomics Facility for providing access to analytical instrumentation for proteomics analysis.
Footnotes
The open field employs a black floor to discriminate from the white rat that will be tracked. Depending on the strain of animal to be used, a different color floor may be utilized to enable to Ethovision software to distinguish the animal from the background.
The open field is enclosed with white curtains through which the ambient lighting can pass through to diffuse the light on either side of the open field and to eliminate spatial cues.
Several high resolution mass spectrometers (ex., hybrid quadrupole time-of-flight instruments) are commercially available that can provide the appropriate mass resolution and accuracy to carry out iTRAQ-based quantitative proteomics experiments. Data dependent (or information dependent) acquisition parameters shown in this section are for an Orbitrap mass spectrometer and these standard parameters can be optimized accordingly depending on instrument type.
Ensure that you do not move the barrier when placing the animal back into the arena, as the camera will track the white barrier instead of the white rat for the duration of the trial.
The time period following the chronic ethanol exposure for tissue harvesting can be altered to determine temporary ethanol-induced protein level changes in addition to long lasting proteomic changes that can occur.
For this analysis, hippocampus was analyzed given the supporting evidence of age-specific protein level changes that can occur in this particular brain region after ethanol exposure. The dissection of other relevant brain regions (for example, prefrontal cortex, ventral striatum containing the nucleus accumbens, and substantia nigra/ventral tegmental area) requires specific expertise where description of this technique is beyond the scope of this chapter.
A minimal amount of extraction buffer is required in order to yield a fairly high protein concentration (> 1 mg/ml). This amount will have to be optimized for the weight of brain tissue being analyzed. For the analysis of hippocampus samples, 2 ml of extraction buffer was determined to be sufficient.
The SDS present in the sample is typically diluted to a level which has low impact on the rpHPLC separation. The SDS concentration can be adjusted to lower levels depending on the subsequent effect on protein solubilization. Alternatively, detergent removal can be performed with commercially available spin columns (ex., detergent removal columns from Pierce Biotechnology).
If it is necessary to modify buffer components in this protocol, be sure to avoid primary amine-containing reagents since this will affect peptide labeling by the amine-reactive iTRAQ tags.
There are multiple databases that can be used for the database search. We have used organism-specific International Protein Index databases from the European Bionformatics Institute. Taxonomy specific searches can also be performed with general databases (ex., SwissProt or the NCBI nonredundant database). Sequest and Mascot represent commonly used commercially available search algorithms; however, other open source and public search algorithms are available such as X! Tandem (The Global Proteome Machine Organization) and the Open Mass Spectrometry Search Algorithm (NCBI).
Certain programs such as Scaffold can determine the normalized spectral count value automatically; therefore, this normalization factor calculation may not be necessary depending on the software package utilized.
Other statistical tests such as a Fisher’s exact test can be employed to identify statistically significant changes in spectral counts.
Results should be validated by performing western blots for selected proteins whose expression is modified and at least one whose expression was unaltered. Western blots should be performed on a subsample of the initial cell lysate that was used for proteomic analysis before trypsin digestion.
References
- 1.Anthony JC, Helzer J. Syndrome of drug abuse and dependence. In: Robins LN, Regier DA, editors. Psychiatric Disorders in America. Free Press; New York, NY: 1991. pp. 116–154. [Google Scholar]
- 2.Taioli E, Wynder EL. Effect of the age at which smoking begins on frequency of smoking in adulthood. N Engl J Med. 1991;325:968–969. doi: 10.1056/NEJM199109263251318. [DOI] [PubMed] [Google Scholar]
- 3.Kandel DB. Epidemiological trends and implications for understanding the nature of addiction. Res Publ Assoc Res Nerv Ment Dis. 1992;70:23–40. [PubMed] [Google Scholar]
- 4.Witt ED. Mechanisms of alcohol abuse and alcoholism in adolescents: A case for developing animal models. Behav and Neural Bio. 1994;62:167–177. doi: 10.1016/s0163-1047(05)80015-9. [DOI] [PubMed] [Google Scholar]
- 5.Spear LP. Adolescent Period: Biological basis of vulnerability to develop alcoholism and other ethanol mediated behaviors. Neurosci Behav Res Portfolio Review, NIAAA 1998 [Google Scholar]
- 6.Brunell SC, Spear LP. Effects of stress on voluntary intake of a sweetened ethanol solution in pair housed adolescent and adult rats. Alcohol Clin Exp Res. 2005;29:1641–1653. doi: 10.1097/01.alc.0000179382.64752.13. [DOI] [PubMed] [Google Scholar]
- 7.Vetter CS, Doremus-Fitzwater TL, Spear LP. Time course of elevated ethanol intake in adolescent elative to adult rats under continuous, voluntary-access conditions. Alcohol Clin Exp Res. 2007;31:1159–1168. doi: 10.1111/j.1530-0277.2007.00417.x. [DOI] [PMC free article] [PubMed] [Google Scholar]
- 8.Blizard DA, Vandenbergh DJ, Jefferson AL, Chatlos CD, Vogler GP, McClearn GE. Effects of periadolescent ethanol exposure on alcohol preference in two BALB substrains. Alcohol. 2004;34:177–185. doi: 10.1016/j.alcohol.2004.08.007. [DOI] [PubMed] [Google Scholar]
- 9.Hunt PS, Molina JC, Rajachandran L, Spear LP, Spear NE. Chronic administration of alcohol in the developing rat: Expression of functional tolerance and alcohol olfactory aversions. Behav Neur Biol. 1993;59:87–99. doi: 10.1016/0163-1047(93)90795-j. [DOI] [PubMed] [Google Scholar]
- 10.Philpot RM, Badanich KA, Kirstein CL. Place conditioning: age-related changes in the rewarding and aversive effects of alcohol. Alcohol Clin Exp Res. 2003;27:593–599. doi: 10.1097/01.ALC.0000060530.71596.D1. [DOI] [PubMed] [Google Scholar]
- 11.Stansfield KH, Kirstein CL. The effects of novelty on behavior in adolescent versus adult rats. Dev Psychobiol. 2006;48:10–15. doi: 10.1002/dev.20127. [DOI] [PubMed] [Google Scholar]
- 12.Hargreaves GA, Quinn H, Kashem MA, Matsumoto I, McGregor IS. Proteomic analysis demonstrates adolescent vulnerability to lasting hippocampal changes following chronic alcohol consumption. Alcohol Clin Exp Res. 2009;33:86–94. doi: 10.1111/j.1530-0277.2008.00814.x. [DOI] [PubMed] [Google Scholar]
- 13.Ross PL, Huang YN, Marchese JN, Williamson B, Parker K, Hattan S, Khainovski N, Pillai S, Dey S, Daniels S, Purkayastha S, Juhasz P, Martin S, Bartlet-Jones M, He F, Jacobson A, Pappin DJ. Multiplexed protein quantitation in Saccharomyces cerevisiae using amine-reactive isobaric tagging reagents. Mol Cell Proteomics. 2004;3:1154–1169. doi: 10.1074/mcp.M400129-MCP200. [DOI] [PubMed] [Google Scholar]
- 14.Keller A, Nesvizhskii AI, Kolker E, Aebersold R. Empirical statistical model to estimate the accuracy of peptide identifications made by MS/MS and database search. Anal Chem. 2002;74:5383–5392. doi: 10.1021/ac025747h. [DOI] [PubMed] [Google Scholar]
- 15.Nesvizhskii AI, Keller A, Kolker E, Aebersold R. A statistical model for identifying proteins by tandem mass spectrometry. Anal Chem. 2003;75:4646–4658. doi: 10.1021/ac0341261. [DOI] [PubMed] [Google Scholar]
- 16.Prokai L, Stevens SM, Jr, Rauniyar N, Nguyen V. Rapid label-free identification of estrogen-induced differential protein expression in vivo from mouse brain and uterine tissue. J Proteome Res. 2009;8:3862–3871. doi: 10.1021/pr900083v. [DOI] [PMC free article] [PubMed] [Google Scholar]