

Abstract
Aging is the biggest risk factor for idiopathic Alzheimer’s disease (AD). Recently, the National Institutes of Health released AD research recommendations that include: appreciating normal brain aging, expanding data-driven research, using open-access resources, and evaluating experimental reproducibility. Transcriptome data sets for aging and AD in humans and animal models are available in NIH-curated, publically accessible databases. However, little work has been done to test for concordance among those molecular signatures. Here, we test the hypothesis that brain transcriptional profiles from animal models recapitulate those observed in the human condition. Raw transcriptional profile data from twenty-nine studies were analyzed to produce p-values and fold changes for young vs. aged or control vs. AD conditions. Concordance across profiles was assessed at three levels: 1) # of significant genes observed vs. # expected by chance; 2) proportion of significant genes showing directional agreement; 3) correlation among studies for magnitude of effect among significant genes. The highest concordance was found within subjects across brain regions. Normal brain aging was concordant across studies, brain regions, and species, despite profound differences in chronological aging among humans, rats and mice. Human studies of idiopathic AD were concordant across brain structures and studies, but were not concordant with the transcriptional profiles of transgenic AD mouse models. Further, the five transgenic AD mouse models that were assessed were not concordant with one another. These results suggest that normal brain aging is similar in humans and research animals, and that different transgenic AD model mice may reflect selected aspects of AD pathology.
Keywords: Alzheimer’s disease, aging, transcriptome
1. Introduction
Idiopathic Alzheimer’s disease (AD), already the most prevalent form of age-related dementia, is becoming a proportionally greater risk as other dementia rates decrease due to improved cardio-and neuro-vascular health [1]. Aging is the single most influential risk factor for the development of idiopathic AD and the US Census Bureau projects that 20% of the US population will be ≥ 65 years of age by 2030, up from just 10% in the year 2000 [2, 3]. This disproportionate expansion of the aging population is projected to result in increased AD prevalence. It is estimated that the number of Americans with AD will increase from ∼4 million in 2000 to 7.7 million in 2030 and to almost 15 million by 2050 [4]. Despite clear evidence of the profound influence aging has on susceptibility to AD, little basic research using animal models has focused on this interplay.
Although basic research animals, like humans, show age-related changes in cognition [5–8], most non-human species do not develop AD-like pathology unless induced to do so experimentally. By far the most common animal models of AD are transgenic mice. These animals develop symptoms consistent with human AD. Unfortunately, interventions that reduce or prevent pathology in transgenic mouse models have met with limited success when translated back to human AD [9]. As the search for a successful AD treatment intensifies, U.S. funding agencies such as the NIH are urging basic researchers to consider research designs that appreciate AD in the context of an aging brain phenotype. More broadly, the NIH has recently published new guidelines for experimental rigor, reproducibility, and transparency across all studies. This, at least in part, is due to high-impact publications projecting that fifteen to fifty percent of published research is not replicable [10–12]. This lack of replication is laid at the feet of reporting bias, poor experimental design, and/or inadequate description of procedures. These issues cast doubt not only on the translatability of basic research in aging and AD, but indeed, on the reliability of the initial findings themselves.
As a step toward evaluating replicability and translational relevance across the brain aging and Alzheimer’s disease studies, transcriptional profiling data was incorporated into a meta-analysis. Transcriptional profiles were selected because they have less bias, more detailed experimental design descriptions, and raw data archived in publically available databases [13, 14]. Profiles of normal aging in rats [15–18], mice [19, 20], and humans [21–24] were selected. For AD comparison, idiopathic human AD [25–29], human Down’s syndrome [30] (as a human genetically induced model of AD-like pathology), as well five transgenic mouse AD models (Alzforum naming conventions): J20 (PDGF-APPSw,Ind) [31], Tg2576 [32], 3xTg [29], 5xFAD [33], and CK-p25 [34], were selected.
Raw data were downloaded, re-annotated, and re-analyzed. Similarity across transcriptional profiles was assessed at three levels: 1) the number of genes observed to be commonly significant vs. those expected to be significant by chance; 2) the proportion of significant genes that showed directional agreement among studies; and 3) the correlation in magnitude of change among commonly significant genes. Agreement was strongest when comparing different brain regions from the same subjects, regardless of species or treatment. Human and rodent models of aging showed consistent results, with a strongly concordant cross-species upregulation of hippocampal immune/inflammatory signaling. Similarly, human hippocampal AD signatures were highly concordant, but in contrast to normal aging, revealed predominately downregulated gene expression associated with neuronal and mitochondrial processes. Among mouse models: J20, Tg2576 and 3xTg profiles showed poor concordance with any other profile, while 5xFAD and CK-p25 did show moderate agreement with one another, and with human AD among upregulated genes.
These results indicate a common human brain aging signature composed primarily of upregulated immune and vascular signaling that is well-modeled in rodent aging. Similarly, human idiopathic AD brain signatures are highly concordant with one another, but dramatically different from the aging signature, being primarily comprised of downregulated mitochondrial and neuronal signatures. However, transgenic mouse models of AD, while recapitulating some anatomic and behavioral aspects of human AD, do not appear to consistently model the strong transcriptional influence observed in human AD.
2. Materials and methods
2.1 Criteria for selection
Published transcriptional profile data were selected for analysis based on availability in the Gene Expression Omnibus, having young adult/control and aging/AD observations, being performed on an Affymetrix detection platform, having complete transcriptional profiles for each relevant subject available, and at least two published studies within a species. Twenty-six transcriptional profiles fulfilled these criteria. Two additional profiles using the Affymetrix platform, but providing signal intensity data as supplemental files rather than in GEO were also selected. One data set using RNA-seq instead of microarray technology, was also selected. In total, 29 transcriptional profiles were used.
2.2 Reannotation and re-analysis of original data
Within each data set, control and AD, or young and aged, subjects’ transcriptional data were selected for analysis. Where original. cel files were available (23/29 profiles), data were re-analyzed using the RMA probe level algorithm [35] (RMAexpress with median polish, and quantile normalization). Profiles where original signal intensity values were used are noted (Table 1). Within each profile, heteroschedastic unpaired t-tests and log2 fold changes were calculated for young vs aging or control vs AD. T-tests here replaced correlation tests reported in prior work [21, 26] and analysis was restricted to the subset of transcriptional profiles that are relevant to young vs aged, or to control vs AD [15–17, 28] conditions.
Table 1.
Individual study characteristics
| Aging | GSE# | Reg | Platform | Ages | Yng | Age | FDR |
|---|---|---|---|---|---|---|---|
| Human | |||||||
| [21] | 11882 | HIP | HG-U133 plus2 | 20–59 vs 60–99yr | 8/10 | 12/13 | 0.10 |
| EC | HG-U133 plus2 | 20–59 vs 60–99yr | 9/12 | 9/9 | 0.35 | ||
| 1[22] | 1572 | FC | HG-U95Av2 | 26–56 vs. 61–106yr | 9/6 | 9/6 | 0.23 |
| 2[23] | 46193 | EC | HG-U133A | 33–55 vs 57–84yr | 2/2 | 2/2 | 0.21 |
| DG | HG-U133A | 33–55 vs 57–84yr | 2/2 | 2/2 | 0.14 | ||
| *[24] | 71620 | PFC (BA11) | Gene 1.1ST | 20–59 vs 60–91yr | 116/25 | 36/13 | 0.04 |
| PFC (BA47) | Gene 1.1ST | 20–59 vs 60–91yr | 0.04 | ||||
| Rat | |||||||
| [15] | 9990 | HP | RAE230A | 3 vs 23mo | 9/0 | 13/0 | 0.12 |
| [16] | 5666 | HP | RAE230A | NT: 5 vs 25mo | 10/0 | 10/0 | 0.29 |
| [17] | 854 | HP | RG U34A | 4 vs 24mo | 9/0 | 10/0 | 0.24 |
| 1[18] | 4821 | DG | RAE 230A | 3 vs 24mo | 27/0 | 53/0 | 0.33 |
| Mouse | |||||||
| [19] | 13120 | CTX | Mouse 430_2 | 5 vs 30mo | 5/0 | 5/0 | 0.04 |
| 2[20] | 5078 | HIP | MG U74Av2 | 2 vs 15mo | 9/0 | 14/0 | 0.27 |
| AD | Ctrl | AD | |||||
| Human | |||||||
| [25] | 28146 | HIP | HG-U133_Plus_2 | 65–101yr | 6/2 | 5/10 | 0.27 |
| [26] | 1297 | HIP | HG-U133A | 65–101yr | 7/2 | 5/10 | 0.18 |
| 2[27] | Sup. | EC | HG-U133A | 33–98yr | 6 | 6 | 0.60 |
| Data | DG | HG-U133A | 33–98yr | 6 | 6 | 1.04 | |
| [28] | 48350 | HIP | HG-U133_Plus_2 | 69–99 yr | 10/9 | 9/8 | 0.06 |
| EC | HG-U133_Plus_2 | 69–99 yr | 7/7 | 7/7 | 0.31 | ||
| [29] | 36980 | HIP | HuGene-1_0-st | 55–105yr | 5/5 | 3/4 | 0.10 |
| FC | HuGene-1_0-st | 55–105yr | 9/9 | 7/8 | 0.23 | ||
| [30] | 5390 | PFC | HG-U133A | 32–76yr | 7/1 | 3/4 | 0.05 |
| Mouse | |||||||
| [31] J20 | 14499 | HIP | Mouse430_2 | 7 mo: GFP/Sham | 5 | 4 | 3.29 |
| EC | Mouse430_2 | WT vs GFP Tg | 5 | 4 | 0.68 | ||
| [32] Tg2576 | 36237 | HIP | Mouse430_2 | 4 mo: Wt vs Tg | 8 | 8 | 0.85 |
| FC | Mouse430_2 | 4 mo: Wt vs Tg | 8 | 8 | 0.39 | ||
| [29] 3xTg | 36981 | HIP | MoGene-1_0-st | 14 mo: WT vs Tg | 3/0 | 3/0 | 0.54 |
| [33] 5xFAD | 50521 | HIP | MoEx-1_0-st | 14 mo: WT vs Tg | 0/3 | 0/3 | 0.43 |
| 3[34] CK-p25 | 65159 | HIP | Illumina HiSeq 2000 | 3 mo: CK v p25 (6 wk) | 3/0 | 3/0 | 0.13 |
Columns: GSE#- Gene Expression Omnibus accession identification number for raw data in referenced study; Reg- brain region (CTX- neocortex, DG- dentate gyrus, EC- entorhinal cortex, FC- frontal cortex, HIP- hippocampus, PFC- prefrontal cortex). Ages- age ranges and treatments, if applicable, are included (NT- non-trained, GFP- green fluorescent protein controls, WT- wild type, Tg- transgenic). Numbers of individual transcriptional profiles from male/female subjects within each category (Young vs Aged, or Control vs AD) are listed. FDR- False Discovery Rate for number of significant results (ttest, p ≤ 0.01)/total number of genes available for statistical testing. All signal intensity values re-calculated using Robust Multichip Analysis (RMA) except superscripted: 1- dChip, 2- MAS5, 3- RNA-seq.
Subjects from the original publication age < 20 yrs and/or RNA integrity number < 7.0 were excluded from analysis. Studies: 15- Kadish et al., 2009; 16: Rowe et al,, 2007; 17: Blalock et al., 2003; 18: Burger et al., 2008; 19: Loerch et al., 2008; 20: Verbitsky et al., 2004; 21: Berchtold et al., 2008; 22: Lu et al., 2004; 23: Pavlopoulos et al., 2013; 24: Chen et al., 2016; 25: Blalock et al., 2011; 26- Blalock et al., 2004; 27: Small et al., 2005; 28: Berchtold et al., 2013; 29: Hokama et al., 2014; 30: Lockstone et al., 2013; 31: Nagahara et al., 2009; 32: Kleiman et al., 2010; 33- Paesler et al., 2015; 34: Gjoneska et al., 2016.
Annotated gene symbols were used to align results across studies/species. Analysis was restricted to gene symbols homologous between mouse and human genomes as defined by the human and mouse homology data set from the Mouse Genome Database (MGD- Feb. 2016), and official gene symbols according to the HUGO Gene Nomenclature committee were used. P-value and fold change results for all studies were combined in a single workbook (Supplemental File 1) with two worksheets- one for aging, and one for AD. For transcriptional profiles where a gene was annotated on more than one row, the row with the largest average signal intensity across all subjects was reported.
2.3 Comparison across studies
Genes found to be significant across studies were assessed at by % directional agreement, correlation across studies for significant genes’ magnitudes of change (Pearson’s test), and numerically by comparing the number of genes observed in the overlap vs. number of genes expected.
Method 1
The number of genes expected in the overlap (∩) is conventionally estimated by multiplying the product of the p-value cutoffs (α) in the compared studies by the number of total genes (T) tested. For example, if two studies had 10,000 total genes in common, and both used a 0.01 p-value cutoff, then 0.01 × 0.01 × 10000 = 1 gene expected in the overlap; ∩ = T * α2. For all comparisons, Method 1 was set to produce ≤ 1 gene in the overlap. However, this approach predicts the number of genes expected in the overlap if both studies consist entirely of false positives, an unlikely event for published work that has, a priori to this analysis, been reported to have a greater-than-expected-by-chance number of significant genes.
Method 2- post hoc False Concordance Rate (phFCR)
A second numerical assessment method was devised to provide a baseline estimate of the degree of overlapping and directionally agreeing genes between two profiles if those profiles are not related to one another, but do contain larger than expected-by-chance numbers of significant genes. The method establishes the probability (P) for randomly drawing a significant up- or down-regulated gene from a transcriptional profile as the proportion of the study’s total genes (T) that are significant (S) at a given p-value cutoff in a given direction (P = S/T). Then, the likelihood of finding a gene in the overlap between two profiles (1 and 2) is estimated by P1 *P2, and the number of genes expected in the intersection is P1 * P2 * T. The number of genes expected to both overlap and agree in direction of change by Method 2 forms the estimate of the number of genes expected to show agreement by chance.
Method 2’s estimate, divided by the number of genes actually observed to agree in the overlap, forms a modified False Discovery Rate type of metric referred to here as the post hoc false concordance rate (phFCR- post hoc because it is performed after significance within each compared profile is already known, false because it is predicting results if there is no biological relationship, and concordance because it is evaluating agreement). The resulting number intersecting genes serves as an estimate of the number of genes one would expect to find to agree in the intersection by chance if two transcriptional profiles showed statistically powerful, but unrelated, effects on gene expression. phFCR values closer to 0 indicate strong concordance, values closer to 1 indicate lack of concordance. Interestingly, values greater than 1 may indicate discordant, or opposing, transcriptional profiles.
2.4 Transparency, rigor and reproducibility
All transcriptional profiles are available at the Gene Expression Omnibus or as Supplemental files in their parent publications (referenced in Table 1) and the descriptions of procedures are intended to allow others to reproduce this series of analyses from the raw data. Age and sex are noted where available in the original studies. Further, complete re-annotated and re-analyzed p-value and log2 fold change results for all profiles are provided (Supplemental File 1). Upon request, individual Excel workbooks with complete signal intensity and annotation data for each profile’s re-analysis can be provided.
3. Results
3.1. Individual study re-analysis
Table 1 lists characteristics for each of the studies/transcriptional profiles included in the analysis. Based on re-annotated, analyzed and filtered data, false discovery rates (FDRs) for each study are included.
3.2 Similarity across brain regions within subjects
Procedures for assessing concordance for the aging signature across two brain regions in one set of human subjects (Fig. 1A) are shown. Based on 20 genes expected to agree in direction within the overlap by chance (Method 2) vs 85 genes observed, a phFCR of 0.24 (20/85) is calculated. The intersection of significant genes is tested for percent agreement (100%) and strength of correlation for fold changes (R2 = 0.92) across the two studies (Fig. 1B). Within subject cross-regional correlations were performed as in Fig. 1 for all studies in which multiple regions were measured (Fig. 2).
Figure 1. Assessing similarity/concordance across transcriptional profiles.
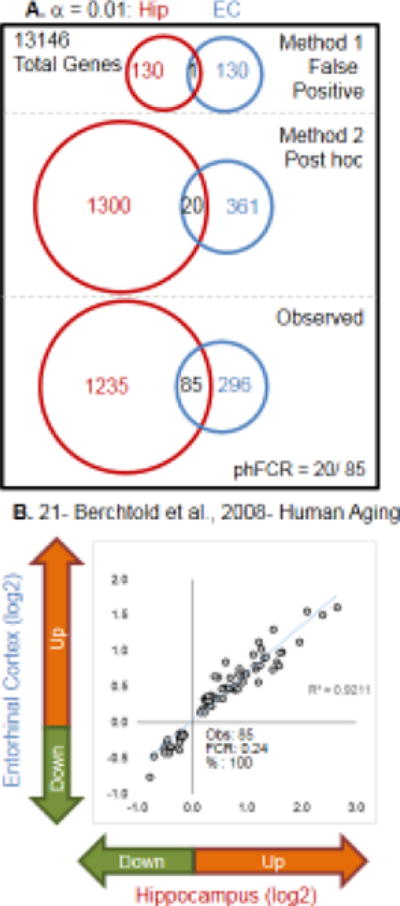
A. When contrasting studies, method 1 (False Positive) assesses the number of genes expected to be significant due to the error of multiple testing. Total number of genes common to both studies multiplied by the p-value cutoffs used in both studies to identify significant genes (e.g., 13146 total genes * 0.01 for hippocampal (hip) * 0.01 for entorhinal cortex (EC) yields 131 genes expected in each study with 1 gene common between them. Method 2 (post hoc) uses the number of genes observed to be significant in each study, divided by the total number of genes tested, to establish the probability that any gene randomly drawn from the data set would be significant. The number in the overlap is predicted by the product of the post hoc probabilities for each direction in each study. In the Berchtold et al, 2008 hippocampal profile, 358 genes were significantly downregulated and 962 were significantly upregulated. In the same study’s entorhinal cortex profile, 162 genes were significantly downregulated and 219 were significantly upregulated. Therefore, the number of genes predicted to be significant and to agree in direction for both studies is [downregulated: (358/13146) * (162/13146) * 13146 = ∼4] + [upregulated: (962/13146) * (219/13146) = ∼16] = 20. Observed gives the values found in the actual comparison. phFCR-post hoc False Concordance Rate- an extension of the False Discovery Rate assessment used in single transcriptional profile studies (Method 2 overlap/observed overlap). B. A representative example of relative agreement across brain regions within subjects. For the 85 aging-significant genes overlapping between hippocampus and EC, log 2 fold changes for entorhinal cortex are plotted against hippocampus. The observed number of genes, the post hoc false concordance rate (phFCR), and percent agreement (%: based on direction of change) are shown.
Figure 2. Similarity within subjects across brain regions.
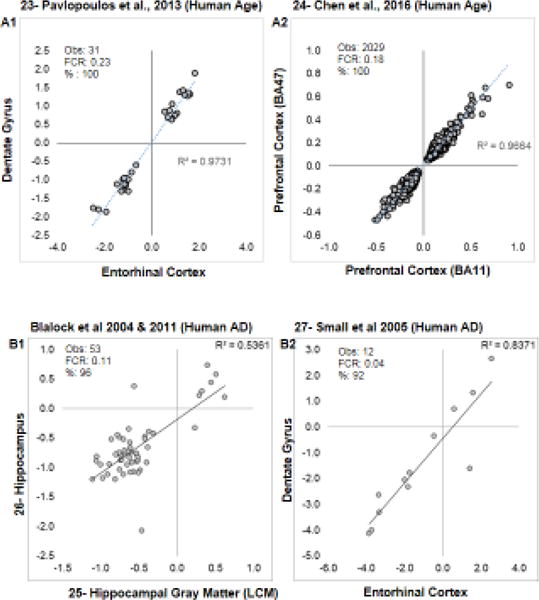
In addition to Berchtold et al., 2008 (see Fig. 1), the first four of eight additional studies examining transcriptional profiles in the same subjects across > 1 brain region are shown. For each comparison, the fold change (log2) for significant genes across regions are plotted, along with the R2 value for the correlation. Within each graph, the observed number of genes, the post hoc false concordance rate (phFCR), and percent agreement (%: based on direction of change) are shown. A1–A2: Human aging. B1–B2: Human Alzheimer’s disease. In B1, Laser Capture Microdissected (LCM) formalin fixed paraffin embedded CA region of the hippocampus (2011) is contrasted with hand-dissected fresh frozen samples (2004).
For aging results (Fig. 1B and Fig. 2A1–2), all studies showed strong cross-regional agreement among significant genes. For human AD (Fig. 2B1–2 and Fig. 3A1–2), there was again a strong cross-regional agreement within studies. Blalock et al., 2004 [26] and Blalock et al., 2011 [25] (Fig. 2B1) show good agreement (51/53) but moderate correlation. Although the same subjects were profiled in this comparison, it is unique among these contrasts as contralateral hippocampi were used, and one study Blalock et al., 2004 [26] used fresh-frozen, hand-dissected tissue, while the other Blalock et al., 2011 [25] used laser-capture microdissected hippocampal gray matter from formalin-fixed, paraffin embedded specimens. The strongest agreements were found across regions in human AD (Fig. 2B1–2, 3A1–2). Despite having fewer overlapping significant genes across regions, mouse models of AD (Fig. 3B1–2) still showed good agreement.
Figure 3. Similarity within subjects across brain regions.
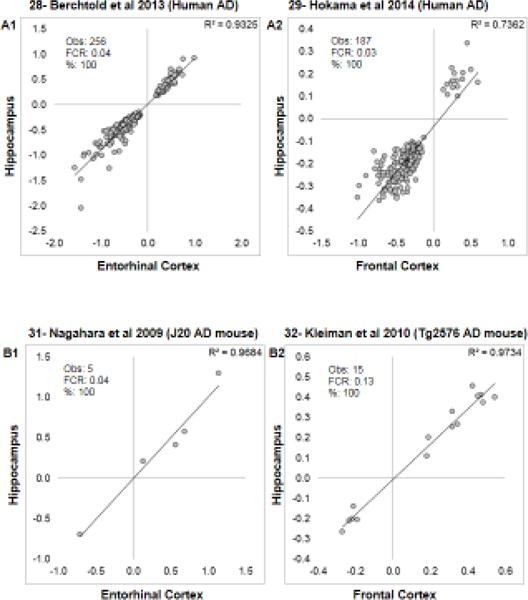
In addition to Berchtold et al, 2008 (see Fig. 1), the second four of eight studies examining transcriptional profiles in the same subjects across > 1 brain region are shown. For each comparison, the fold change (log2) for significant genes across regions are plotted, along with the R2 value for the correlation. Within each graph, the observed number of genes, the post hoc false concordance rate (phFCR), and percent agreement (%: based on direction of change) are shown. A1–A2: Human Alzheimer’s disease. B1–B2: Transgenic mouse models of Alzheimer’s disease.
3.3 Aging within species
For human studies, the hippocampal profile from Berchtold et al., 2008 [21] was selected because of the statistical strength of its findings (FDR = 0.1, Table 1) and balanced representation across the sexes. As reported in the authors’ original study Berchtold et al., 2008 [21], there is a sexually dimorphic effect on the brain aging transcriptome, but because other studies either did not annotate, or did not evaluate, this effect, transcriptional responses were assessed here without separating the sexes. A similar rationale holds for not contrasting time-of-death effects, which are significant as reported in Chen et al., 2016 [24], but are not annotated in other studies.
Pairwise contrasts results from each of the other human studies are shown (Fig. 4A1–4). One profile, BA47 from Chen et al., 2016 [24], is not graphed because of redundancy with the compared profile BA11 (Fig. 4A4). Overall, % agreement, phFCRs, and correlations all suggest agreement across studies/labs/and measurement platforms for human aging. Similar robust agreement was observed among rat studies (Fig. 5A1–3). Only two mouse brain aging profiles were available (Fig. 5B) and showed agreement driven exclusively by concordant upregulated genes. The different brain regions examined and age-points (see Table 1–2 vs 15 month contrasted with 5 vs 30 mo) may help to explain these differences. Overall, there appears to be a disproportionate number of genes that are concordant across studies with generally more prevalent upregulated genes.
Figure 4. Brain aging profile similarity within humans.
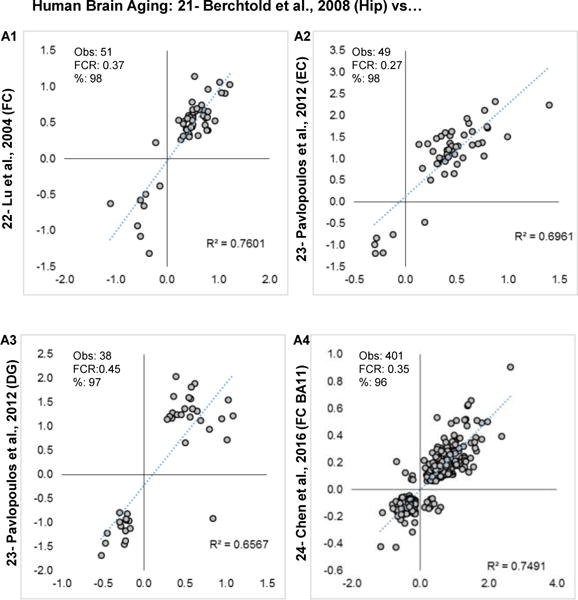
Log2 fold changes are plotted for overlapping significant genes in each pairwise study comparison A1–4. Within each graph, number of genes observed (Obs), post hoc false concordance rate (FCR), and percent agreement are shown.
Figure 5. Brain aging profile similarity within rodents.
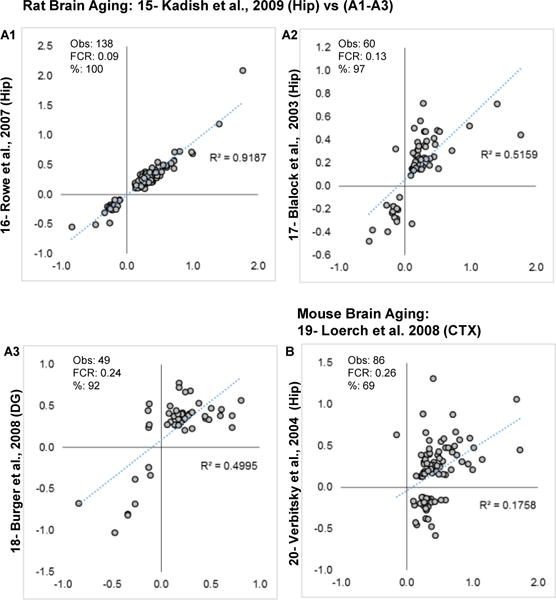
Log2 fold changes are plotted for overlapping significant genes in each study. A1–A3: Concordance evaluations for rat brain aging profiles. B: Concordance evaluation for mouse brain aging (note that aging in [20] was 2 v 15 months old, while in [19] they were 5 vs 30 months). Within each graph, number of genes observed (Obs), post hoc false concordance rate (FCR), and percent agreement are shown.
Table 2.
Pathway overrepresentation analysis for hippocampal aging in human and rat
| Commonly Upregulated | # | Pvalue |
|---|---|---|
| positive regulation of immune system process | 19 | 1.67E-13 |
| positive regulation of protein kinase cascade | 11 | 5.03E-07 |
| regulation of inflammatory response | 08 | 1.61E-06 |
| regulation of cell activation | 10 | 6.74E-06 |
| protein homodimerization activity | 12 | 1.51E-05 |
| regulation of adaptive immune response | 06 | 6.22E-05 |
| regulation of cell motion | 09 | 1.04E-04 |
| regulation of immune effector process | 07 | 1.13E-04 |
| regulation of leukocyte activation | 08 | 2.56E-04 |
| response to organic substance | 16 | 3.16E-04 |
| blood circulation | 08 | 5.10E-04 |
| tissue remodeling | 05 | 8.28E-04 |
| Commonly downregulated | ||
| Tricarboxylic acid cycle | 03 | 6.8E-04 |
3.4 Concordant aging signatures
To evaluate whether brain aging showed agreement across multiple studies simultaneously, a multiple-study aging signature was constructed. As a caveat, it is important to note that that different array detection systems detect different numbers of genes (e.g,, the HGU133A detects 4457 annotated genes, while the Gene 1.1ST detects 12475), so comparing across multiple studies reduces the total list of genes available for testing. Further, while comparison across studies increases the likelihood that common results are truly positive, it also increases the likelihood that truly significant results will be missed (increased false negative rate). Here, the concordant list is intended as a bellwether of changing gene expression, rather than a comprehensive list of all gene expression changes.
To build the consensus human brain aging list, four human aging transcriptional profiles were selected. If a study had profiles from more than one brain region, then the profile with the lowest FDR was selected to avoid disproportionate representation from single subjects. Therefore, the hippocampal profile from Berchtold et al., 2008 [21], the dentate gyrus from Pavlopoulos et al., 2013 [23], the frontal cortex from Lu et al., 2004 [22] and the prefrontal cortex BA11 from Chen et al., 2016 [24] were selected and filtered in parallel by p-value (relaxed to p ≤ 0.05 to partially compensate for presumed false negative results). 40/42 genes agree in direction of change across all four studies and (Fig. 6A1–2) with a small phFCR and all pairwise correlation r values > 0.7. This indicates these profiles identify a common thread of age-related signaling across brain regions, laboratories, and platforms of gene expression.
Figure 6. Brain aging consensus within species.
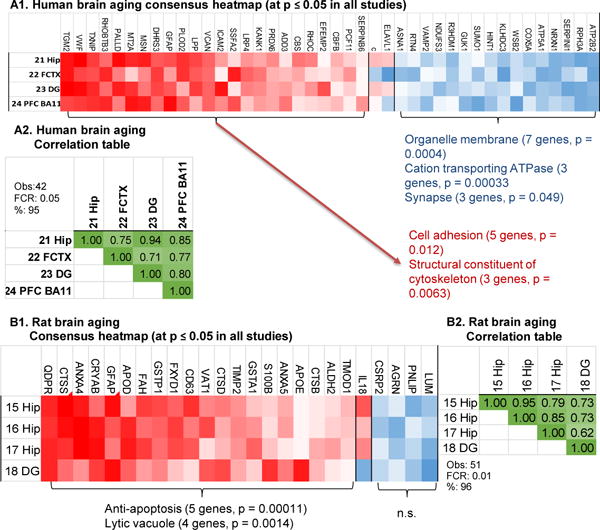
A1: Heatmap of ranked fold changes from most negative (blue) to most positive (red) are shown for genes significantly changed (p ≤ 0.05) in four human brain aging studies. Two genes (c, ELAVL1) did not show consistent direction of change. Selected significant pathway overrepresentation analysis categories, numbers of genes, and overrepresentation p-values are noted. A2: Correlation matrix r values from Pearson’s test for all pairwise comparisons among the commonly significant human aging genes. B1: Heatmap of ranked fold changes for rat aging genes significant across four studies at p ≤ 0.05. One gene, IL18 was consistent in hippocampal specimens, but not in DG. B2: Correlation matrix r values (Pearson’s test) for all pairwise comparisons among the commonly significant rat aging genes. Within each correlation matrix (A2, B2), estimated numbers of genes predicted to be found by method 1 (M1), method 2 (M2), number of genes observed (Obs) and false concordance rate (FCR) are shown.
A similar analysis was undertaken to evaluate the rat brain aging across the four available rat transcriptional profiles Kadish et al., 2009; Rowe et al., 2007; Blalock et al., 2003; Burger et al., 2008 [15–18]. Good (24/25) directional agreement, a low phFCR and correlation r values > 0.6 (Fig. 6B1–2) all suggest a concordant profile. Only a single gene, GFAP, was commonly upregulated in both the human and rat aging consensus lists. However, finding consensus lists across brain regions is highly likely to filter out common aging changes localized to a particular brain region.
To test whether similar brain regions show similar aging profiles across species, a representative human hippocampal Berchtold et al., 2008 [21] profile was contrasted with rat profiles (Fig. 7A–D). Across species, aging phFCRs were generally weaker than those within species (Figs. 4–6) and agreement was predominately among upregulated genes. A pathway overrepresentation analysis (Table 2) of results from the comparison with the largest number of genes (Fig. 7D), indicated prominent common immune/inflammatory effects among upregulated genes in human and rat hippocampus. Similar selection procedures applied to human and rat entorhinal cortex profiles Pavlopoulos et al., 2013 [23] and Burger et al., 2008 [18] produced results no better than expected by chance (not shown).
Figure 7. Comparison of human vs. rodent hippocampal aging.
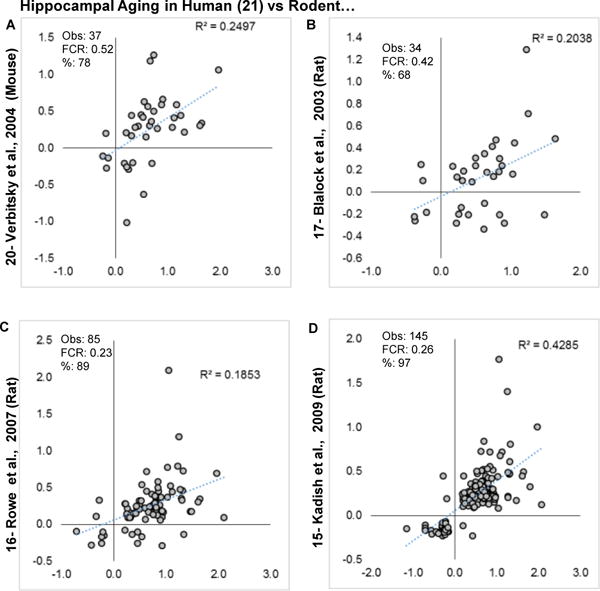
Log2 Fold changes are plotted for overlapping significant genes in human hippocampal aging vs. four aging transcriptional profiles in rodents. A: Mouse hippocampal aging profile. B–D. Rat hippocampal aging profiles. Within each graph, estimated numbers of genes predicted to be found by method 1 (M1), method 2 (M2), number of genes observed (Obs) and false concordance rate (FCR) are shown.
3.5 AD signatures within Human and animal models
For comparisons across human AD transcriptional profiles, Berchtold et al., 2013 [28] was selected as the study with the highest proportion of significant genes for comparison against other profiles. For comparison across studies, if a single study had more than one profiled brain region, then the region with the highest proportion of significant genes was selected (Fig. 8A1–3). For human AD, the actual numbers of genes found in the overlap generally exceeded those observed in aging studies, suggesting a more expansive, and downregulated, transcriptional effect. Further, phFCRs were generally low, indicating good agreement. Surprisingly, no familial AD cases with known genetic lesions have publically available transcriptional profile data. However, Down’s syndrome is considered to have an amyloid precursor protein gene-dose effect that promotes the likelihood of developing AD-like pathology. The idiopathic human AD profile was contrasted with this profile (Fig. 8A4). The phFCR was relatively greater than in idiopathic comparisons with a larger number of disagreeing genes but still showed relatively good directional agreement and a large number of overlapping genes.
Figure 8. Human AD similarity.
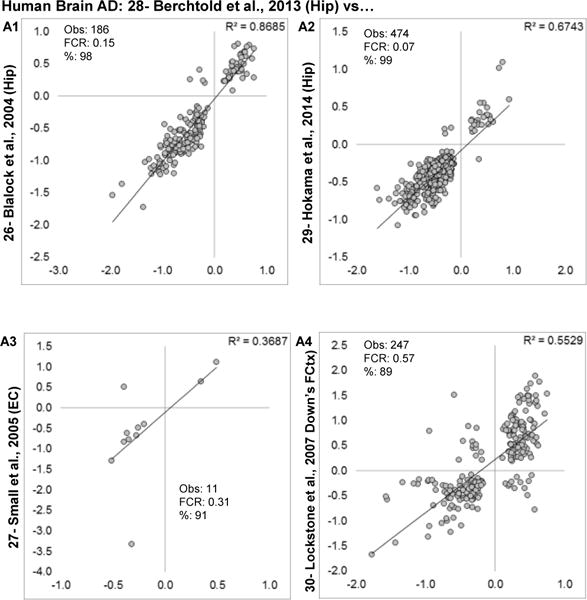
Log2 fold changes are plotted for overlapping significant genes in each study, along with numerical comparison results. A1–3: Concordance evaluations are made for human brain AD profiles. A4- comparison with human Down’s syndrome subjects (control Down’s vs. Down’s with AD-like pathology). Within each graph, estimated numbers of genes predicted to be found by method 1 (M1), method 2 (M2), number of genes observed (Obs) and false concordance rate (FCR) are shown.
For animal models, the CK-p25 hippocampal results Gjoneska et al., 2013 [34] have the greatest proportion of significant findings and are used as a baseline for comparison against other mouse AD models (Fig. 9A1–4). For the J20 mouse model, evaluation should be tempered- the parent study had a large FDR (Table 1) and may not have sufficient statistical strength for a reasonable interpretation. However, across all comparisons, mouse models showed relatively weak agreement with one another except 5xFAD vs CK-p25 (Fig. 9A4), where agreement was almost exclusively among up-regulated genes.
Figure 9. Similarity among AD mouse models.
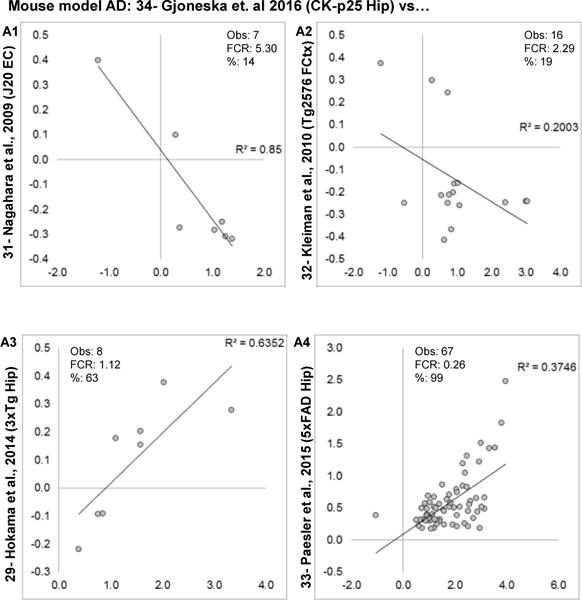
Log2 fold changes are plotted for overlapping significant genes in each study, along with numerical comparison results. A1–A4: Concordance evaluations for transgenic mouse models of AD. Within each graph, estimated numbers of genes predicted to be found by method 1 (M1), method 2 (M2), number of genes observed (Obs) and false concordance rate (FCR) are shown.
3.6 Concordant AD signatures
To build the consensus AD signatures, hippocampal profiles were used as they were the most prevalently measured brain region (9/11 studies) and the two studies Small et al., 2005, Nagahara et al., 2009 [27, 31] with the lowest # significant concordant genes within species (Fig. 8A3 and Fig. 9A1) were excluded. The human AD signature (Fig. 10A1) was dominated by downregulated genes and showed a low phFCR and strong all pairwise correlation among fold changes (Fig. 10A2). Functional pathway overrepresentation analyses for concordant genes (Fig. 10A3) revealed concordant upregulated processes associated with cell-cell contact and possibly blood-vessel related changes, while downregulated categories showed a much stronger suppression of genes associated with mitochondria and neuronal/synaptic processes. In stark contrast, mouse transgenic AD models found no genes at the specified common p-value cutoff of 0.05. For display purposes, the p-value was relaxed to 0.2, but the resulting genes show very poor agreement (Fig. 10B1), a phFCR > 1, and weak all-pairwise correlations among fold changes (Fig. 10B2).
Figure 10. Alzheimer’s disease human and animal model gene signatures.
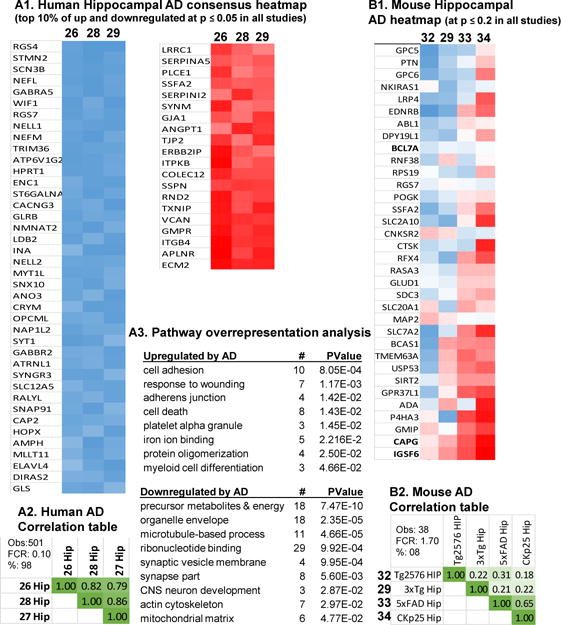
A1: Heatmap of ranked fold changes from most negative (blue) to most positive (red) are shown for genes significantly changeSS (p ≤ 0.05) in three human hippocampal brain AD studies. For display purposes, the top 10% commonly upregulated and downregulated genes are shown out of 503 total genes (491 of which agreed in direction across all studies). A2: Correlation matrix r-values from Pearson’s test for all pairwise comparisons among the commonly significant human hippocampal AD genes A3: Pathway overrepresentation analysis results with pathway, number of genes significant in pathway (#), and probability such a result would be found by chance (Pvalue). B1: Heatmap of ranked fold changes for mouse transgenic AD model genes significant across four studies at p ≤ 0.05. Two genes (CAPG and IGSF6) showed directional agreement. One gene, IL18 was consistent in hippocampal specimens, but not in DG. B2: Correlation matrix r values (Pearson’s test) for all pairwise comparisons among the commonly significant transgenic mouse model AD genes. Within each correlation matrix (A2), estimated numbers of genes predicted to be found by method 1 (M1), method 2 (M2), number of genes observed (Obs) and false concordance rate (FCR) are shown.
3.7 Individual mouse models of AD vs. human AD
Because the mouse profiles are not concordant with one another, it is possible that one mouse model does recapitulate human AD while others do not. To test this, each brain region in each mouse model was contrasted with human AD (Fig. 11 and Fig. 12). Although most mouse models showed very poor agreement (Fig. 11 and Fig. 12A) with phFCRs > 1 and negative (albeit weak) correlations, the 5xFAD and CK-p25 (Fig. 12B, C) models did show good directional agreement and moderate correlation strength, particularly among upregulated genes.
Figure 11. Comparison of human AD transcriptional profile with individual mouse models and brain regions.
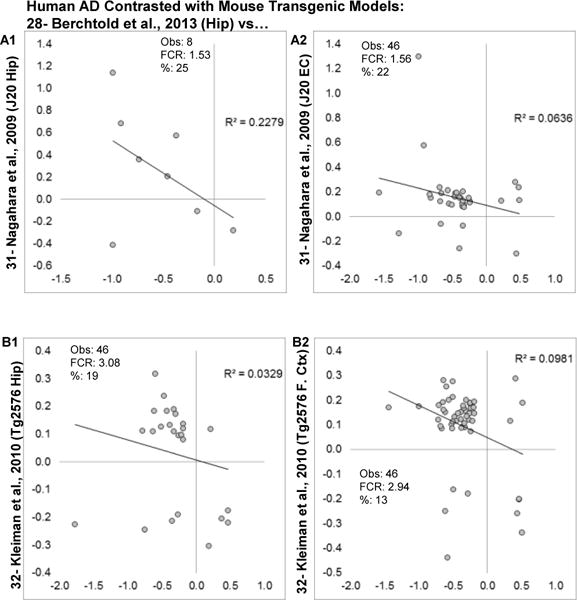
Log2 fold changes for genes found significant across human and individual mouse transgenic AD models and regions (first 4 of 7 comparisons) are shown. A1–2: Hippocampal (Hip) and entorhinal cortex (EC) from the J20 mouse. B1–B2: Hippocampal and frontal cortex (F. Ctx) from the Tg2576 mouse). Within each graph, estimated numbers of genes predicted to be found by method 1 (M1), method 2 (M2), number of genes observed (Obs) and false concordance rate (FCR) are shown.
Figure 12. Comparison of human AD transcriptional profile with individual mouse models and brain regions.
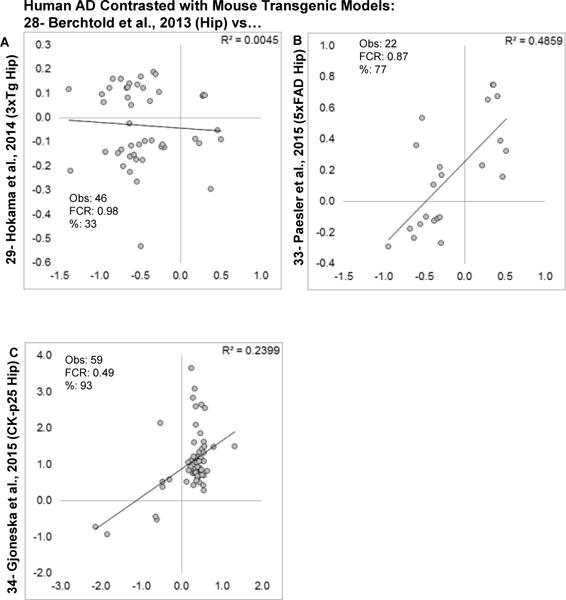
Log2 fold changes for genes found significant across human and individual mouse transgenic AD models (last 3 of 7) are shown. A: Hippocampus from the 3xTg mouse. B. Hippocampus from the 5xFAD mouse. C: Hippocampus from the CK-p25 inducible mouse model (RNA-seq based fold changes). Within each graph, estimated numbers of genes predicted to be found by method 1 (M1), method 2 (M2), number of genes observed (Obs) and false concordance rate (FCR) are shown.
3.8 Summarized assessment of concordance
For each of the comparisons (across region within subject, within human aging, within rodent aging, aging across humans and rodents, within human AD, within mouse model AD, and AD in human vs mouse) the three concordance measures (% agreement, fold change correlation, and phFCR) were averaged and plotted (Fig. 13A–C). Results were contrasted with the predicted values for random chance using one-sample t-tests and all comparisons, with the exception of transgenic mouse and AD in Human vs Mouse, were significantly better than chance for all concordance measures. By rank: across region > Rat Brain Aging > Human Brain Aging > Aging in Human vs Rodent > AD in Human vs Mouse > Transgenic Mouse.
Figure 13.
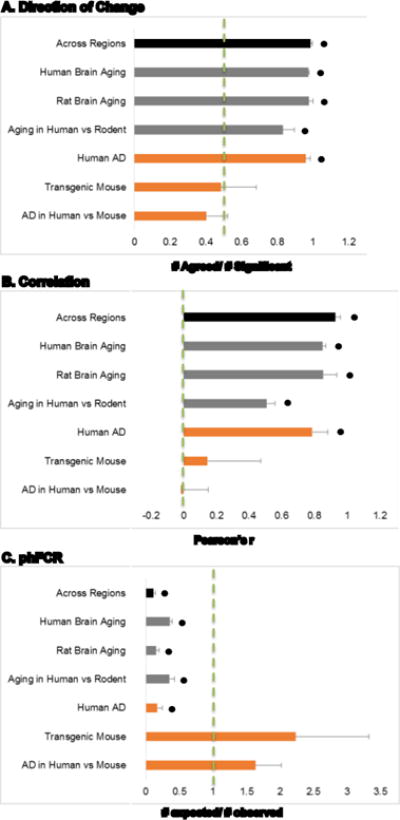
Consolidated comparisons. Averaged pairwise contrast comparison results for direction of change (A), correlation (B), and post hoc False Concordance Rate (C) are shown. Across Regions from Figs. 1B, 2 and 3; Human Brain Aging from Fig. 4; Rat Brain Aging from Fig. 5; Aging in Human vs. Rodent from Fig. 7; Human AD from Fig. 8; Transgenic Mouse from Fig. 10; and AD in Human vs. Mouse from Figs. 11 and 12. * p ≤ 0.05; one-sample t-test vs. chance (dashed green line).
4. Discussion
To our knowledge, this is the first study to provide a statistical assessment of replicability across multiple published brain aging and Alzheimer’s disease transcriptional studies in human and rodent models. Assessment of similarity/reproducibility across studies is often limited because measures of central tendency and variance are reported (sometimes only graphically), and often with limited description of the procedures used to produce those measures, as well as bias towards reporting significant findings [10, 11]. Although transcriptional profiling is sometimes maligned for multiple testing error propensity, and for measuring an intermediate molecular species that may be less relevant to biology than protein, transcriptional profiling data does offer certain advantages. First, measures are less biased because a large proportion of the biological output for an entire class of molecules (the transcriptome), rather than a narrow subset of researcher-selected components, is measured. Second, raw data for all observations in each subject are often available in publically accessible databases. Third, detailed descriptions of the methods used in the original (‘parent’) publications, and, in most cases, thorough annotations for each subject, are provided. Together, this availability engenders the ability to test for agreement across different preparations purporting to measure the same phenomenon.
Key findings here include brain aging’s consistent transcriptional profile across human [21–24] and rodent [15–18] studies. Within the hippocampus, this concordant profile has a strong upregulation of immune/inflammatory signaling. Further, the transcriptional profile for human idiopathic Alzheimer’s disease is also robust across studies [26–29], but unlike aging, largely focuses on downregulation of neuronal and mitochondrial genes. It is important to note that, in human AD studies, normal aged subjects are contrasted with similarly aged AD subjects. Because human aging does show a consistent immune-inflammatory signature [36–39], it is likely that the robust human AD signatures identified here are manifested on a background of increased age-related immune-inflammatory signaling, a feature that likely was not present in the (younger) AD mouse models. Mice that model the age-related changes in brain immune signaling may provide important data on selective, age-related mechanisms for the establishment and spread of AD-related pathology.
Three transgenic mouse models of AD (J20, Tg2576, 3xTg) [29, 31, 32] showed poor concordance with each other as well as with human AD. Further, genes commonly regulated in human AD and these three mouse models often showed opposing directions of change. This discordant effect suggests the interesting speculation that some model mice, introduced to a human genetic pathology, may generate an opposing and potentially compensatory response. If so, then some of these opposing changes may represent reasonable therapeutic targets for human studies [40, 41]. The 5xFAD, and CK-p25 mice generally showed better agreement with human AD. However, this agreement was centered on upregulated, rather than down-regulated genes, indicating a failure to model the most consistent and prominent transcriptional signature of human idiopathic AD. This is of considerable note, as these models have well-reported neurodegenerative effects [42, 43]. Although the CK-p25’s neurodegenerative effects may, at least in part, be mediated by neurotoxicity of the tetracycline transactivator required to induce the model [44]. If so, then this neurotoxic transcriptional signature does not manifest with the same downward deflection of synaptic and mitochondrial genes seen in human AD. Differences in numbers of subjects, background strains, age ranges and sex (Table 1) may also contribute to lack of agreement across transgenic AD mouse models.
Interestingly, the human studies used here represent the most common, idiopathic form of AD, while the animal models (with the exception of CK-p25) are based on genetic lesions associated with familial AD. If the mice are modeling familial AD, then this would also infer that familial AD is distinct from idiopathic AD at the transcriptional level. It would be preferable to test for this relationship by contrasting the transgenic mouse profiles with the profiles of subjects in whom the genetic lesion was originally identified. However, no such human familial AD brain transcriptional profiles have become available. Instead, we used a published Down’s syndrome transcriptional study (Down’s cases without AD pathology were used as control) [30] as an approximation. Down’s subjects are thought to develop AD-like pathology through a genetic effect similar to familial AD. The Down’s cases shared moderate concordance with idiopathic AD, including a large block of downregulated genes, suggesting that genetic AD in humans shares more similarity with idiopathic cases than with mouse models. Alternatively, analysis of more recently developed animal models of late onset Alzheimer’s disease [45–48] that appreciate chronic age-related changes [49] may importantly shed light on molecular processes associated with the development of idiopathic AD.
Within-subject, across brain region comparisons show highly concordant signatures regardless of species or condition. On the one hand, aging and/or AD could have generalized transcriptional effects spanning brain regions. On the other hand, subject selection from the population may strongly influence gene expression. If the latter is true, then comparisons in which multiple regions from single subjects are used to confirm findings may be less useful than comparisons across different sets of subjects. It should be noted that the samples used for these analyses are region-selective homogenate brain preparations. As transcriptional profiling from cell-type and sub-region [25, 50–54] specific preparations become more prevalent, analyses of these more defined areas may help to further elucidate the relationships between human conditions and animals intended to model them.
To assess concordance across studies, selection criteria were set so that ≤ 1 gene would be identified by chance in the overlap if all significant results in both comparisons were false positives. Then, three measures were used to determine concordance among overlapping genes: percent agreement in direction of change among significant genes; correlation in magnitude of change among significant genes; and a post hoc false concordance rate (phFCR). Although the first two measures are straight forward, the third was developed during the course of this analysis and is a modification of the popular False Discovery Rate (FDR) calculated for individual studies [55]. The FDR calculates the proportion of genes expected to be found significant at a given p-value cutoff for a given total list size of genes. Smaller FDRs indicate more reliable results, while FDRs closer to 1 represent results that are no better than chance. Similarly, the phFCR first calculates the proportions of genes found to be up or down regulated in each comparison study, and then calculates the number of genes expected to be both statistically significant and to agree in direction of change across the studies. This ‘false concordance’ estimate is then divided by the number of genes actually found to create the phFCR.
The phFCR, or some similar measure, could be used in evaluating similarity across massively parallel analyses, like transcriptome studies, to protect against over-interpreting chance levels of concordance. Additionally, the FDR (Table 1) provides an assessment of individual study statistical reliability. In comparisons where the FDR is high in at least one of the studies, interpretations from concordance analysis should be tempered as the genes being compared are not exceeding chance discovery at the individual study level. Finally, this comparison procedure is reductive- a single anomalous study folded in with other, more reliable studies, will disrupt their otherwise strong findings. Similarly, a statistically low-powered study will likely miss more subtle gene expression changes. Even among studies with consistent findings, filtering results across studies reduces the list size, and as confidence increases that individual results found in the overlap are indeed truly positive, so too does confidence that other, true positives, are being missed. Therefore, the overlapping genes are reasonable for establishing similarity across studies, but are unlikely to capture the full spectrum of truly positive results.
5. Conclusions
Transcriptional profiles of brain aging are concordant across rodents and humans in multiple brain regions. The hippocampal aging profiles in humans and rats show strong upregulation of immune/inflammatory signaling. There is a high degree of concordance within the transcriptional profiles of human AD that is primarily centered on downregulated neuronal and mitochondrial signals. This signature may reflect neurodegenerative processes in idiopathic AD. Among five transgenic mouse models, three (J20, Tg2576, 3xFAD) show poor concordance with each other as well as with human AD. Two (5xFAD and CK-p25) show moderate agreement with one another and with human AD, although this agreement is primarily centered on upregulated genes. Because aging shows a clear shift in gene expression, one method for more fully aligning AD models with the human condition would be establishing pathology in animals at an age that is model-consistent with the age of onset for AD in humans.
Supplementary Material
Highlights.
Published brain aging and Alzheimer’s disease (AD) transcriptomes are studied
Human and rodent brain aging profiles are similar
Human AD is highly consistent across studies
Transgenic AD mouse models are not similar to one another or to human AD
Acknowledgments
This work was supported by grants from the NIH/NIA (AG037868, AG034605). We thank Nada Porter, Arnold Stromberg and Olivier Thibault for helpful discussion and critical evaluation on this manuscript.
Abbreviations
- AD
Alzheimer’s disease
- CA
cornu ammonus of hippocampus
- DG
dentate gyrus
- EC
entorhinal cortex
- FC
frontal cortex
- FDR
False Discovery Rate
- GEO
Gene Expression Omnibus
- PFC
prefrontal cortex
- TG
transgenic
Footnotes
Publisher's Disclaimer: This is a PDF file of an unedited manuscript that has been accepted for publication. As a service to our customers we are providing this early version of the manuscript. The manuscript will undergo copyediting, typesetting, and review of the resulting proof before it is published in its final citable form. Please note that during the production process errors may be discovered which could affect the content, and all legal disclaimers that apply to the journal pertain.
Work Cited
- 1.Satizabal CL, Beiser AS, Chouraki V, Chene G, Dufouil C, Seshadri S. Incidence of Dementia over Three Decades in the Framingham Heart Study. N Engl J Med. 2016;374:523–32. doi: 10.1056/NEJMoa1504327. [DOI] [PMC free article] [PubMed] [Google Scholar]
- 2.Lister JP, Barnes CA. Neurobiological changes in the hippocampus during normative aging. Arch Neurol. 2009;66:829–33. doi: 10.1001/archneurol.2009.125. [DOI] [PubMed] [Google Scholar]
- 3.Mielke MM, Vemuri P, Rocca WA. Clinical epidemiology of Alzheimer’s disease: assessing sex and gender differences. Clin Epidemiol. 2014;6:37–48. doi: 10.2147/CLEP.S37929. [DOI] [PMC free article] [PubMed] [Google Scholar]
- 4.Hebert LE, Scherr PA, Bienias JL, Bennett DA, Evans DA. Alzheimer disease in the US population: prevalence estimates using the 2000 census. Arch Neurol. 2003;60:1119–22. doi: 10.1001/archneur.60.8.1119. [DOI] [PubMed] [Google Scholar]
- 5.Foster TC. Dissecting the age-related decline on spatial learning and memory tasks in rodent models: N-methyl-D-aspartate receptors and voltage-dependent Ca2+ channels in senescent synaptic plasticity. Prog Neurobiol. 2012;96:283–303. doi: 10.1016/j.pneurobio.2012.01.007. [DOI] [PMC free article] [PubMed] [Google Scholar]
- 6.Gallagher M, Rapp PR. The use of animal models to study the effects of aging on cognition. Annu Rev Psychol. 1997;48:339–70. doi: 10.1146/annurev.psych.48.1.339. [DOI] [PubMed] [Google Scholar]
- 7.Morrison JH, Baxter MG. The ageing cortical synapse: hallmarks and implications for cognitive decline. Nat Rev Neurosci. 2012;13:240–50. doi: 10.1038/nrn3200. [DOI] [PMC free article] [PubMed] [Google Scholar]
- 8.Hedden T, Gabrieli JD. Insights into the ageing mind: a view from cognitive neuroscience. Nat Rev Neurosci. 2004;5:87–96. doi: 10.1038/nrn1323. [DOI] [PubMed] [Google Scholar]
- 9.Banik A, Brown RE, Bamburg J, Lahiri DK, Khurana D, Friedland RP, et al. Translation of Pre-Clinical Studies into Successful Clinical Trials for Alzheimer’s Disease: What are the Roadblocks and How Can They Be Overcome? J Alzheimers Dis. 2015;47:815–43. doi: 10.3233/JAD-150136. [DOI] [PubMed] [Google Scholar]
- 10.Ioannidis JP. Why most published research findings are false. PLoS Med. 2005;2:e124. doi: 10.1371/journal.pmed.0020124. [DOI] [PMC free article] [PubMed] [Google Scholar]
- 11.Goodman S, Greenland S. Why most published research findings are false: problems in the analysis. PLoS Med. 2007;4:e168. doi: 10.1371/journal.pmed.0040168. [DOI] [PMC free article] [PubMed] [Google Scholar]
- 12.Jager LR, Leek JT. An estimate of the science-wise false discovery rate and application to the top medical literature. Biostatistics. 2014;15:1–12. doi: 10.1093/biostatistics/kxt007. [DOI] [PubMed] [Google Scholar]
- 13.Barrett T, Edgar R. Gene expression omnibus: microarray data storage, submission, retrieval, and analysis. Methods Enzymol. 2006;411:352–69. doi: 10.1016/S0076-6879(06)11019-8. [DOI] [PMC free article] [PubMed] [Google Scholar]
- 14.Edgar R, Domrachev M, Lash AE. Gene Expression Omnibus: NCBI gene expression and hybridization array data repository. Nucleic Acids Res. 2002;30:207–10. doi: 10.1093/nar/30.1.207. [DOI] [PMC free article] [PubMed] [Google Scholar]
- 15.Kadish I, Thibault O, Blalock EM, Chen KC, Gant JC, Porter NM, et al. Hippocampal and cognitive aging across the lifespan: a bioenergetic shift precedes and increased cholesterol trafficking parallels memory impairment. J Neurosci. 2009;29:1805–16. doi: 10.1523/JNEUROSCI.4599-08.2009. [DOI] [PMC free article] [PubMed] [Google Scholar]
- 16.Rowe WB, Blalock EM, Chen KC, Kadish I, Wang D, Barrett JE, et al. Hippocampal expression analyses reveal selective association of immediate-early, neuroenergetic, and myelinogenic pathways with cognitive impairment in aged rats. J Neurosci. 2007;27:3098–110. doi: 10.1523/JNEUROSCI.4163-06.2007. [DOI] [PMC free article] [PubMed] [Google Scholar]
- 17.Blalock EM, Chen KC, Sharrow K, Herman JP, Porter NM, Foster TC, et al. Gene microarrays in hippocampal aging: statistical profiling identifies novel processes correlated with cognitive impairment. J Neurosci. 2003;23:3807–19. doi: 10.1523/JNEUROSCI.23-09-03807.2003. [DOI] [PMC free article] [PubMed] [Google Scholar]
- 18.Burger C, Lopez MC, Baker HV, Mandel RJ, Muzyczka N. Genome-wide analysis of aging and learning-related genes in the hippocampal dentate gyrus. Neurobiol Learn Mem. 2008;89:379–96. doi: 10.1016/j.nlm.2007.11.006. [DOI] [PMC free article] [PubMed] [Google Scholar]
- 19.Loerch PM, Lu T, Dakin KA, Vann JM, Isaacs A, Geula C, et al. Evolution of the aging brain transcriptome and synaptic regulation. PLoS One. 2008;3:e3329. doi: 10.1371/journal.pone.0003329. [DOI] [PMC free article] [PubMed] [Google Scholar]
- 20.Verbitsky M, Yonan AL, Malleret G, Kandel ER, Gilliam TC, Pavlidis P. Altered hippocampal transcript profile accompanies an age-related spatial memory deficit in mice. Learn Mem. 2004;11:253–60. doi: 10.1101/lm.68204. [DOI] [PMC free article] [PubMed] [Google Scholar]
- 21.Berchtold NC, Cribbs DH, Coleman PD, Rogers J, Head E, Kim R, et al. Gene expression changes in the course of normal brain aging are sexually dimorphic. Proc Natl Acad Sci U S A. 2008;105:15605–10. doi: 10.1073/pnas.0806883105. [DOI] [PMC free article] [PubMed] [Google Scholar]
- 22.Lu T, Pan Y, Kao SY, Li C, Kohane I, Chan J, et al. Gene regulation and DNA damage in the ageing human brain. Nature. 2004;429:883–91. doi: 10.1038/nature02661. [DOI] [PubMed] [Google Scholar]
- 23.Pavlopoulos E, Jones S, Kosmidis S, Close M, Kim C, Kovalerchik O, et al. Molecular mechanism for age-related memory loss: the histone-binding protein RbAp48. Sci Transl Med. 2013;5:200ra115. doi: 10.1126/scitranslmed.3006373. [DOI] [PMC free article] [PubMed] [Google Scholar]
- 24.Chen CY, Logan RW, Ma T, Lewis DA, Tseng GC, Sibille E, et al. Effects of aging on circadian patterns of gene expression in the human prefrontal cortex. Proc Natl Acad Sci U S A. 2016;113:206–11. doi: 10.1073/pnas.1508249112. [DOI] [PMC free article] [PubMed] [Google Scholar]
- 25.Blalock EM, Buechel HM, Popovic J, Geddes JW, Landfield PW. Microarray analyses of laser-captured hippocampus reveal distinct gray and white matter signatures associated with incipient Alzheimer’s disease. J Chem Neuroanat. 2011;42:118–26. doi: 10.1016/j.jchemneu.2011.06.007. [DOI] [PMC free article] [PubMed] [Google Scholar]
- 26.Blalock EM, Geddes JW, Chen KC, Porter NM, Markesbery WR, Landfield PW. Incipient Alzheimer’s disease: microarray correlation analyses reveal major transcriptional and tumor suppressor responses. Proc Natl Acad Sci U S A. 2004;101:2173–8. doi: 10.1073/pnas.0308512100. [DOI] [PMC free article] [PubMed] [Google Scholar]
- 27.Small SA, Kent K, Pierce A, Leung C, Kang MS, Okada H, et al. Model-guided microarray implicates the retromer complex in Alzheimer’s disease. Ann Neurol. 2005;58:909–19. doi: 10.1002/ana.20667. [DOI] [PubMed] [Google Scholar]
- 28.Berchtold NC, Coleman PD, Cribbs DH, Rogers J, Gillen DL, Cotman CW. Synaptic genes are extensively downregulated across multiple brain regions in normal human aging and Alzheimer’s disease. Neurobiol Aging. 2013;34:1653–61. doi: 10.1016/j.neurobiolaging.2012.11.024. [DOI] [PMC free article] [PubMed] [Google Scholar]
- 29.Hokama M, Oka S, Leon J, Ninomiya T, Honda H, Sasaki K, et al. Altered expression of diabetes-related genes in Alzheimer’s disease brains: the Hisayama study. Cereb Cortex. 2014;24:2476–88. doi: 10.1093/cercor/bht101. [DOI] [PMC free article] [PubMed] [Google Scholar]
- 30.Lockstone HE, Harris LW, Swatton JE, Wayland MT, Holland AJ, Bahn S. Gene expression profiling in the adult Down syndrome brain. Genomics. 2007;90:647–60. doi: 10.1016/j.ygeno.2007.08.005. [DOI] [PubMed] [Google Scholar]
- 31.Nagahara AH, Merrill DA, Coppola G, Tsukada S, Schroeder BE, Shaked GM, et al. Neuroprotective effects of brain-derived neurotrophic factor in rodent and primate models of Alzheimer’s disease. Nat Med. 2009;15:331–7. doi: 10.1038/nm.1912. [DOI] [PMC free article] [PubMed] [Google Scholar]
- 32.Kleiman R, Lanz TA, Finley JE, Bove SE, Majcchrak MJ, Becker SL, et al. Dendritic spine density deficits in the hippocampal CA1 region of young Tg2576 mice are ameliorated with the PDE9A inhibitor PF-04447943. Alzheimer’s & Dementia. 2010:6. [Google Scholar]
- 33.Paesler K, Xie K, Hettich MM, Siwek ME, Ryan DP, Schroder S, et al. Limited effects of an eIF2alphaS51A allele on neurological impairments in the 5xFAD mouse model of Alzheimer’s disease. Neural Plast. 2015;2015:825157. doi: 10.1155/2015/825157. [DOI] [PMC free article] [PubMed] [Google Scholar]
- 34.Gjoneska E, Pfenning AR, Mathys H, Quon G, Kundaje A, Tsai LH, et al. Conserved epigenomic signals in mice and humans reveal immune basis of Alzheimer’s disease. Nature. 2015;518:365–9. doi: 10.1038/nature14252. [DOI] [PMC free article] [PubMed] [Google Scholar]
- 35.Bolstad BM, Irizarry RA, Astrand M, Speed TP. A comparison of normalization methods for high density oligonucleotide array data based on variance and bias. Bioinformatics. 2003;19:185–93. doi: 10.1093/bioinformatics/19.2.185. [DOI] [PubMed] [Google Scholar]
- 36.Minciullo PL, Catalano A, Mandraffino G, Casciaro M, Crucitti A, Maltese G, et al. Inflammaging and Anti-Inflammaging: The Role of Cytokines in Extreme Longevity. Arch Immunol Ther Exp (Warsz) 2016;64:111–26. doi: 10.1007/s00005-015-0377-3. [DOI] [PubMed] [Google Scholar]
- 37.Goto M. Inflammaging (inflammation + aging): A driving force for human aging based on an evolutionarily antagonistic pleiotropy theory? Biosci Trends. 2008;2:218–30. [PubMed] [Google Scholar]
- 38.Giunta B, Fernandez F, Nikolic WV, Obregon D, Rrapo E, Town T, et al. Inflammaging as a prodrome to Alzheimer’s disease. J Neuroinflammation. 2008;5:51. doi: 10.1186/1742-2094-5-51. [DOI] [PMC free article] [PubMed] [Google Scholar]
- 39.Franceschi C. Inflammaging as a major characteristic of old people: can it be prevented or cured? Nutr Rev. 2007;65:S173–6. doi: 10.1111/j.1753-4887.2007.tb00358.x. [DOI] [PubMed] [Google Scholar]
- 40.Kreiner G. Compensatory mechanisms in genetic models of neurodegeneration: are the mice better than humans? Front Cell Neurosci. 2015;9:56. doi: 10.3389/fncel.2015.00056. [DOI] [PMC free article] [PubMed] [Google Scholar]
- 41.Stein TD, Johnson JA. Lack of neurodegeneration in transgenic mice overexpressing mutant amyloid precursor protein is associated with increased levels of transthyretin and the activation of cell survival pathways. J Neurosci. 2002;22:7380–8. doi: 10.1523/JNEUROSCI.22-17-07380.2002. [DOI] [PMC free article] [PubMed] [Google Scholar]
- 42.Giusti-Rodriguez P, Gao J, Graff J, Rei D, Soda T, Tsai LH. Synaptic deficits are rescued in the p25/Cdk5 model of neurodegeneration by the reduction of beta-secretase (BACE1) J Neurosci. 2011;31:15751–6. doi: 10.1523/JNEUROSCI.3588-11.2011. [DOI] [PMC free article] [PubMed] [Google Scholar]
- 43.Oakley H, Cole SL, Logan S, Maus E, Shao P, Craft J, et al. Intraneuronal beta-amyloid aggregates, neurodegeneration, and neuron loss in transgenic mice with five familial Alzheimer’s disease mutations: potential factors in amyloid plaque formation. J Neurosci. 2006;26:10129–40. doi: 10.1523/JNEUROSCI.1202-06.2006. [DOI] [PMC free article] [PubMed] [Google Scholar]
- 44.Han HJ, Allen CC, Buchovecky CM, Yetman MJ, Born HA, Marin MA, et al. Strain background influences neurotoxicity and behavioral abnormalities in mice expressing the tetracycline transactivator. J Neurosci. 2012;32:10574–86. doi: 10.1523/JNEUROSCI.0893-12.2012. [DOI] [PMC free article] [PubMed] [Google Scholar]
- 45.Hohsfield LA, Daschil N, Oradd G, Stromberg I, Humpel C. Vascular pathology of 20-month-old hypercholesterolemia mice in comparison to triple-transgenic and APPSwDI Alzheimer’s disease mouse models. Mol Cell Neurosci. 2014;63:83–95. doi: 10.1016/j.mcn.2014.10.006. [DOI] [PMC free article] [PubMed] [Google Scholar]
- 46.Flinn JM, Bozzelli PL, Adlard PA, Railey AM. Spatial memory deficits in a mouse model of late-onset Alzheimer’s disease are caused by zinc supplementation and correlate with amyloid-beta levels. Front Aging Neurosci. 2014;6:174. doi: 10.3389/fnagi.2014.00174. [DOI] [PMC free article] [PubMed] [Google Scholar]
- 47.Graybeal JJ, Bozzelli PL, Graybeal LL, Groeber CM, McKnight PE, Cox DN, et al. Human ApoE epsilon4 alters circadian rhythm activity, IL-1beta, and GFAP in CRND8 mice. J Alzheimers Dis. 2015;43:823–34. doi: 10.3233/JAD-132009. [DOI] [PubMed] [Google Scholar]
- 48.DiBattista AM, Heinsinger NM, William Rebeck G. Alzheimer’s Disease Genetic Risk Factor APOE-epsilon4 Also Affects Normal Brain Function. Curr Alzheimer Res. 2016 doi: 10.2174/1567205013666160401115127. [DOI] [PMC free article] [PubMed] [Google Scholar]
- 49.Krstic D, Knuesel I. Deciphering the mechanism underlying late-onset Alzheimer disease. Nat Rev Neurol. 2013;9:25–34. doi: 10.1038/nrneurol.2012.236. [DOI] [PubMed] [Google Scholar]
- 50.Ginsberg SD, Hemby SE, Lee VM, Eberwine JH, Trojanowski JQ. Expression profile of transcripts in Alzheimer’s disease tangle-bearing CA1 neurons. Ann Neurol. 2000;48:77–87. [PubMed] [Google Scholar]
- 51.Dueck H, Khaladkar M, Kim TK, Spaethling JM, Francis C, Suresh S, et al. Deep sequencing reveals cell-type-specific patterns of single-cell transcriptome variation. Genome Biol. 2015;16:122. doi: 10.1186/s13059-015-0683-4. [DOI] [PMC free article] [PubMed] [Google Scholar]
- 52.LoVerso PR, Cui F. Cell type-specific transcriptome profiling in mammalian brains. Front Biosci (Landmark Ed) 2016;21:973–85. doi: 10.2741/4434. [DOI] [PMC free article] [PubMed] [Google Scholar]
- 53.Mufson EJ, Mahady L, Waters D, Counts SE, Perez SE, DeKosky ST, et al. Hippocampal plasticity during the progression of Alzheimer’s disease. Neuroscience. 2015;309:51–67. doi: 10.1016/j.neuroscience.2015.03.006. [DOI] [PMC free article] [PubMed] [Google Scholar]
- 54.Cahoy JD, Emery B, Kaushal A, Foo LC, Zamanian JL, Christopherson KS, et al. A transcriptome database for astrocytes, neurons, and oligodendrocytes: a new resource for understanding brain development and function. J Neurosci. 2008;28:264–78. doi: 10.1523/JNEUROSCI.4178-07.2008. [DOI] [PMC free article] [PubMed] [Google Scholar]
- 55.Hochberg Y, Benjamini Y. More powerful procedures for multiple significance testing. Stat Med. 1990;9:811–8. doi: 10.1002/sim.4780090710. [DOI] [PubMed] [Google Scholar]
Associated Data
This section collects any data citations, data availability statements, or supplementary materials included in this article.