

Abstract
Pathology is essential for research in disease and development, as well as for clinical decision making. For more than 100 years, pathology practice has involved analyzing images of stained, thin tissue sections by a trained human using an optical microscope. Technological advances are now driving major changes in this paradigm toward digital pathology (DP). The digital transformation of pathology goes beyond recording, archiving, and retrieving images, providing new computational tools to inform better decision making for precision medicine. First, we discuss some emerging innovations in both computational image analytics and imaging instrumentation in DP. Second, we discuss molecular contrast in pathology. Molecular DP has traditionally been an extension of pathology with molecularly specific dyes. Label-free, spectroscopic images are rapidly emerging as another important information source, and we describe the benefits and potential of this evolution. Third, we describe multimodal DP, which is enabled by computational algorithms and combines the best characteristics of structural and molecular pathology. Finally, we provide examples of application areas in telepathology, education, and precision medicine. We conclude by discussing challenges and emerging opportunities in this area.
Keywords: digital pathology, algorithms, computational, precision medicine, chemical imaging, infrared spectroscopic imaging, FT-IR spectroscopy, microenvironment, stainless staining, diagnosis, prognosis, outcome
1. Introduction
Digital pathology (DP) can be broadly defined to include all aspects of acquisition, process management, and data interpretation to yield pathology information from a digitized pathology sample's image. First, the field is largely based on utilizing the advantages of modern computer and electronic (digital) systems (1–4) to improve and enhance pathology practice. Second, the development of whole-slide imaging (WSI) technology has enabled digitization of tissue slides, giving rise to new areas such as telepathology (5) and remote diagnosis (6, 7). Third, informatics and big data analytic methods (8) are providing unprecedented detail about data from the subcellular to the tissue level [in, e.g., nuclei (9–13), mitoses (14, 15), and lymphocytes (12, 16)]. Moreover, recently proposed machine learning–based approaches, in conjunction with “subvisual” image biomarkers of disease architecture, could provide information about the state of aggressiveness of the disease and enable prognostic prediction of therapeutic outcome (17).
A major shift is also taking place by including markers derived from molecular biology or chemical analysis of tissues. Whereas long-used stains such as hematoxylin and eosin (H&E) are fairly nonspecific, chemically or molecularly specific stains are increasingly being employed to understand disease progression (18). Immunohistochemical (IHC) or molecular imaging is becoming increasingly quantitative (19) and is evolving for multiplexed analysis (20). More recently, label-free methods for pathology have been developed using spectral imaging (19, 21) due to advances in instrumentation (22–25). Direct recording of chemical composition eliminates the need for dyes or stains and could be much more informative because it is not restricted to the imaging of known molecular species. The complex spectral data, however, need informatics approaches in order to be interpreted and used robustly in routine analysis (26).
The focus of this review is on the two major themes of structural and molecular trends in DP enabled by informatics. Complementing related reviews (27–31), we first discuss advances in computer algorithms. Next, we describe the state of the art in instrumentation and informatics that enable molecular DP (mDP). Because excellent reviews and monographs are available for IHC imaging and spectral analysis in molecular imaging, we focus on recent, fast-moving developments in label-free spectral imaging and the role of informatics therein. Finally, using illustrative examples, we discuss opportunities for both DP and mDP in the context of applications areas such as telepathology, education, and precision medicine. We also briefly discuss the regulatory and infrastructural challenges involved in incorporating these technologies into routine practice, both in the United States and globally.
2. Digital Pathology Methods
2.1. Instrumentation for Digital Pathology
Instrumentation for DP consists of a microscope and computing, storage, and visualization hardware. The microscope and computing hardware have been extensively described. Enhancements for fluorescence or multispectral optical imaging are commercially available. Instrumentation has been transformed from static snapshots of specific fields of view taken with camera-equipped microscopes to scanning of whole glass slides with integrated, often quantitative histologic evaluation. The primary challenge involves ensuring high quality and fidelity of digital images so that pathologists' diagnostic performance is not compromised when they rely on digital data. Whereas pathologists have traditionally had to pore over stained tissues on glass slides, technology will enable them to use the same basic equipment but will advance information content, visualization, and analytical tools to greatly improve decision making.
2.2. Computational and Big Data Analytic Methods in Digital Pathology
Computerized image analysis is at least 50 years old. Although face recognition algorithms (32) were proposed in the early 1970s, image processing and pattern recognition algorithms began to be applied to medical data with the digitization of radiology 30 years ago (33). Similarly, although analysis algorithms for microscopic cellular images (34) were put forward nearly 50 years ago, only recently, with the introduction of WSI, did tools to aid the pathologist (for, e.g., mitosis and nuclear counting) become available. These approaches aim to extend human cognition by predicting disease outcome and aggressiveness (35, 36), thereby providing true decision support. In this review, we focus first on the emerging theme of image informatics as histologic companion diagnostics. Although visually reading routine pathologic slides can allow pathologists to make diagnoses, sophisticated computer-aided image analysis can uncover more-revealing sub-visual attributes from morphology (e.g., texture, shape, architecture). Researchers have shown that these histologic biomarkers are correlated with disease progression independently of existing clinical and pathologic features. Careful processing steps are needed in order to capture subvisual cues from DP that may be associated with tumor heterogeneity and disease outcome, as described in the following subsections.
2.2.1. Color standardization
The visual appearance of digital histopathology slides has many sources of variance, two of which are the staining protocol and the choice of digital slide scanner. Although pathologists are unaffected by these factors when rendering a diagnosis from H&E images, these variances often limit their ability to generalize computer-based approaches. Consequently, development of color standardization and normalization algorithms to help improve the performance of subsequent image analysis algorithms (13, 37) has been a primary goal of recent research. Often, a single image with optimal tissue staining and visual appearance is designated the template. Intensity distributions of subsequent images are mapped to match the distribution of the template image. Several studies (38–40) have suggested that matching distributions of tissue subtypes (e.g., epithelium, nuclei, stroma) is more optimal than aligning global image distributions. In the context of histopathology, this process might involve identifying stromal tissue, nuclei, lymphocytes, fatty adipose tissue, and cancer epithelium, within both the target and template images, and then specifically establishing correspondences between the tissue partitions in the two images. This two-level matching process can be performed either by images with one contrast mechanism or by multimodal imaging and alignment (41).
2.2.2. Detection and segmentation of histologic primitives
Automated counting and enumeration of histologic primitives such as nuclei (42) in H&E images have attracted significant attention. Recently, there has been interest in grand challenge competitions in digital pathology image analysis, in which groups compete with their algorithms on specific problems by using a set of common data sets. These grand challenge competitions have involved detection algorithms to identify nuclei (29), lymphocytes (43), and mitoses (14). In addition to aiding pathologists in manual disease grading (9, 44–47), these identifications are also critical for subsequent automated feature analysis algorithms. Several of these detection algorithms have employed well-established computer vision and image processing approaches with heuristic rules such as active contours (48), level sets (49), and active shape models (50). Deep learning approaches, which involve the use of multiple layers of convolutional neural networks for unsupervised learning of features in order to identify the object of interest from a set of training images, led their creators to win recent grand challenges in DP image analysis (51). Figure 1 shows results of a deep learning model used to distinguish areas of invasive cancer from benign stromal areas in breast cancer H&E images (52).
Figure 1.
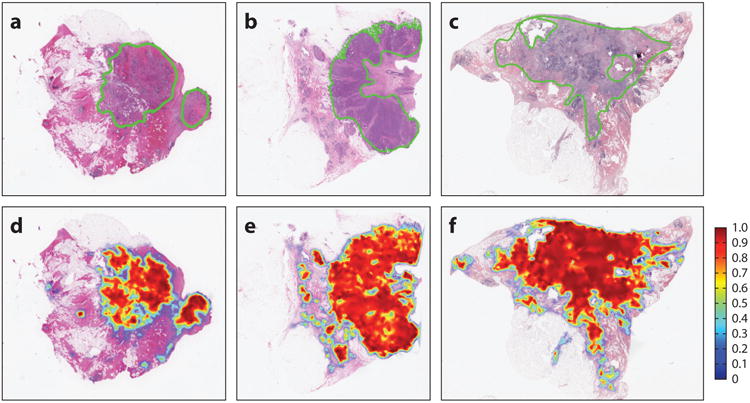
(Top) Probabilistic output of a deep learnin classifier for regions of invasion. (Bottom) Corresponding hematoxylin and eosin images with a pathologist's markup of the extent of cancer extent. Note the concordance between the two rows.
2.2.3. Quantitative histomorphometry and feature analysis
Quantitative histomorphometry (QH) involves computerized image analysis tools for quantitatively assessing cancer tissue and non–cancer tissue morphology and architecture. QH measurements can be divided broadly into three groups: architectural, shape, and texture based.
Architectural features capture the arrangement and spatial topology of histologic primitives such as individual nuclei, tubules, mitoses, and lymphocytes. The spatial location of a particular primitive is considered to be a node in a graph. The nodes are then connected using graph construction algorithms [e.g., Voronoi (53), Delaunay (16), minimum spanning tree (54)]. Quantitative measurements (e.g., internode distance, clustering coefficient of the nodes) can quantitatively characterize the graph and, hence, the image. The spatial architecture and orientation of all nuclei and glands on DP images have recently been expanded to encompass the local architecture of the primitives through the use of algorithms such as cell cluster graphs (55, 56), which successfully predicted progression in p16+ oropharyngeal tumors (57). Figure 2 shows an example of global and cell cluster graphs from a digitized image of a radical prostatectomy specimen.
Figure 2.
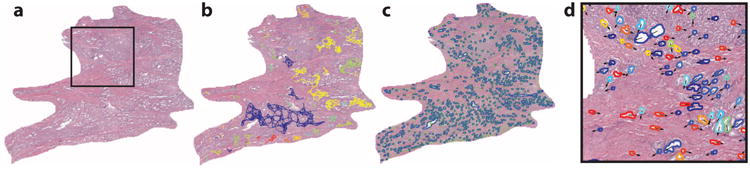
(a) Prostate cancer tumor region. The region of interest (ROI) is outlined in blue. (b) Cluster graphs establish localized gland networks. (c) Delaunay triangulation reveals a global graph which traverses stromal and epithelial boundaries, whereas co-occurring gland tensors compute localized features from the gland networks. (d) The ROI from panel a. The color map of the gland orientations (0°, 180°) demonstrates the variation in local gland orientation. Gland orientations are architecturally differently arranged in tissue from patients with and without disease recurrence (58).
The shape of individual histologic primitives can indicate the presence of disease. Shape features such as fractal dimension (59), angularity, size, and smoothness of the boundary (47) differ between nuclei and glands in high and low grades of prostate and breast cancers. Finally, disorder (or entropy) in the orientation of nuclei and glands in prostate tissue predicts biochemical recurrence (BCR) postsurgery in patients with prostate cancer (58, 60).
Texture refers to quantitative measures of spatial neighborhood interactions between pixel intensities within local neighborhoods in an image. These could include first-order spatial intensity interactions (e.g., mean, standard deviation, median, variance) within local neighborhoods and second-order interactions (e.g., co-occurrence features). More complex textural features can also be extracted; these include steerable and multiscale gradient features via mathematical operators such as Gabor filters (61), local binary patterns (62), and Laws filters (63). The shape and texture of nuclei within the stroma are significantly correlated with disease recurrence and patient outcome in breast (64), prostate (65), and oropharyngeal cancers (55). Figure 3 shows the digital stain representation of a routine H&E image, with overlays of nuclear architecture networks and capture of stromal and epithelial textural variations.
Figure 3.
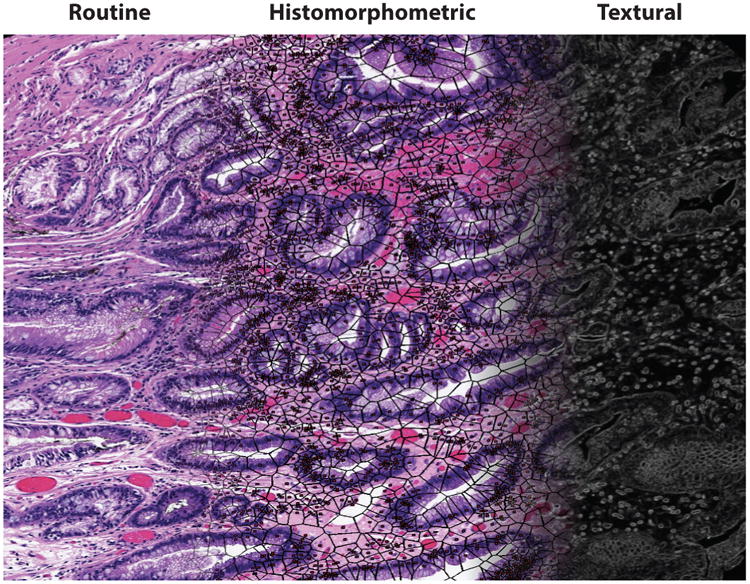
A digital stain. A routine hematoxylin and eosin tissue image (left) can be converted into a histomorphometric representation comprising nuclear architecture (middle) and textural measurements (right).
2.3. Machine Learning–Based Classification for Disease Presence, Grading, and Outcome Prediction
A typical analysis pipeline involves a machine learning classifier that takes as input a series of manually or computer-extracted features and employs those features to render a prediction. In the context of DP, predictions might involve a low-level recognition (e.g., Is the primitive a nucleus or not?), a diagnostic decision (e.g., Is the tissue region of interest cancerous or not?), or a prognostication (e.g., Will the patient have early or distant disease recurrence?). Machine learning classifiers can be broadly categorized into supervised and unsupervised approaches. Whereas unsupervised learning approaches try to identify natural groupings directly from the feature space, supervised approaches rely on labeled training exemplars in order to learn the best classifier that optimally distinguishes instances from the classes of interest. However, the challenges involved in training supervised classifiers in the context of WSI data are data density and, hence, the need to address issues pertaining to computational complexity. To address these issues in processing WSI data, one can use multiresolution classifiers that initially perform predictions at lower resolutions and map results to the next level of image resolution. A new, higher-resolution classifier is then employed at the next level in the image pyramid and is more efficient because the interrogation is limited to areas identified as suspicious at the lower resolution. This approach, modeled on the way pathologists tend to review slides under a microscope, is employed for both diagnosis (66) and grading (45).
Both supervised and unsupervised classification approaches tend to be susceptible to the curse of dimensionality (67), an issue when the size of the feature space is significantly larger than the number of data samples. To address this issue, especially for multispectral images, investigators are increasingly using data dimensionality reduction methods. These methods can be broadly categorized into linear and nonlinear methods (68) on the basis of the approach used to map the higher-dimensional feature space onto a set of eigenvectors. Supervised and unsupervised classifiers can then be constructed in the lower-dimensional eigenvector space instead of the original high-dimensional feature vector space. A problem posed by dimensionality reduction methods is that they tend to obfuscate the original feature space, leading to a lack of transparency in the resultant classifiers. A method called FINE (feature importance in nonlinear methods) (69) has recently been proposed to reverse map eigenvector representations to the original set of image features.
2.4. Applications in Digital Pathology
Applications of image analysis for DP include not only computer-assisted diagnosis of disease but also telepathology for remote consulting, education, and precision medicine. In this section, we describe some key problems in health care and use selected examples to show how DP solutions are emerging to address them.
2.4.1. Precision medicine
There is a broad need for predictive and prognostic assays to distinguish aggressive from less-aggressive phenotypes of cancer so as to identify optimal therapies in individual patients and guide clinical trials (70). Most prognostic tests in the United States and Europe are based on gene expression assays. Recent studies have shown extensive genetic heterogeneity among cancer cells between tumors and even within the same tumor. In fact, molecular signatures for both good and bad prognoses can be found in the same tumor. Interestingly, tumor morphology observed on standard H&E staining is still remarkably useful for tumor characterization. In reality, tumor morphology reflects the sum of all temporal genetic and epigenetic changes and alterations in tumor cells, thereby providing incredible utility for predicting tumor biology, clinical behavior, and treatment response. Consequently, there has been recent interest in identifying computer-assisted image features from routine H&E images that can help predict disease progression (71) and disease recurrence (58, 64). The successful validation of these H&E-based tests could have a significant impact in low- and middle-income countries that do not have access to the more expensive, molecular-based prognostic tests and assays. Figure 4 shows an example of the use of image informatics in the context of prediction outcome in oropharyngeal cancers. Specifically, Lewis and colleagues (71) showed how the combination of nuclear graphs within both the stromal and epithelial compartments can predict progression in p16+ oropharyngeal cancers.
Figure 4.
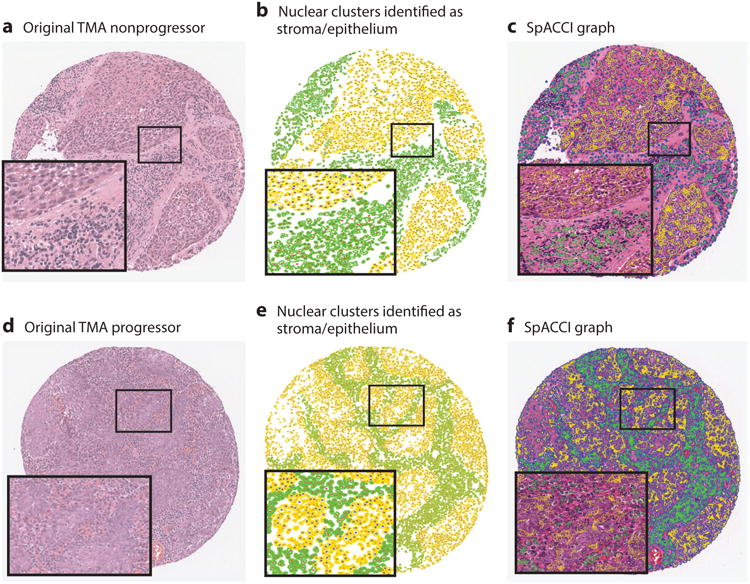
Nuclear architecture features can be extracted within the stromal and epithelial compartments within hematoxylin and eosin tissue sections. The combination of stromal and epithelial nuclear architecture features, referred to as a SpaCCl graph, enables improved prediction of which p16+ oropharyngeal cancers will and will not progress. Abbreviation: TMA, tissue microarray.
2.4.2. Telepathology
Telepathology (5, 72, 73)—the remote analysis of biopsy samples using digital imaging technology—has been steadily increasing in popularity, not only in the United States (74) and Europe but also in low- and middle-income countries, for two reasons. First, the technology sector and Internet infrastructure are rapidly growing. Second, WSI scanners are becoming increasingly available, enabling rapid digitization in routine pathology. Telepathology can be highly effective. For example, a recent two-center study showed that a clinically important diagnosis was achieved via telepathology in 93% of 100 patient cases (75). Most cases (79%) were analyzed within 3 days, demonstrating the strong potential of telepathology for servicing low-resource areas.
2.4.3. Education
Digitized slides can be shared and accessed from any location with an Internet connection (76, 77), which can prove beneficial for medical practice as well as education. For example, Ventana Medical Systems, Inc. has developed PathXchange (78), an educational image sharing system that has a global professional community and case library for networking, telepathology, sharing, and archival. A recent study (79) showed that second- and third-year medical students easily adapted to virtual microscopy, found it user friendly, and thought that the opportunity to view slides remotely was a huge advantage. The study also found that virtual microscopy increased collaboration and interactions among students. Recently, researchers introduced an Internet-based training tool called Score the Core, which employs tissue microarrays to train pathologists to visually score estrogen receptor, progesterone receptor (percent positive), and Ki-67 (percent positive) (80). A software infrastructure for tracking viewed regions in WSI and, using the regions tracked during a practical exam in oral pathology (81), analyzed the collected data to discover students' viewing behavior.
3. Molecular Digital Pathology
3.1. Instrumentation and Computing Resources for Label-Free Molecular Digital Pathology
Because the acquisition of IHC microscopic images is similar to the use of current instrumentation in pathology, we focus on the state of the art of spectroscopic imaging, or chemical imaging (CI). IR imaging (82) is one of the major modalities that promises excellent image contrast, fast data recording, and exceptional molecular sensitivity; therefore, we consider it an example of the progress and potential of using CI for DP.
Given that vibrational frequencies within molecules directly resonate with optical frequencies in the mid-IR spectral region, light absorption provides a quantitative molecular fingerprint of the material, providing ample molecular biomarkers. No dyes or stains are needed to visualize molecular content, so data can be recorded from a variety of samples without prior knowledge of the type or composition of the sample (Figure 5a–e). Thereafter, informatics techniques are used to extract the desired information or to discover new information (83).
Figure 5.
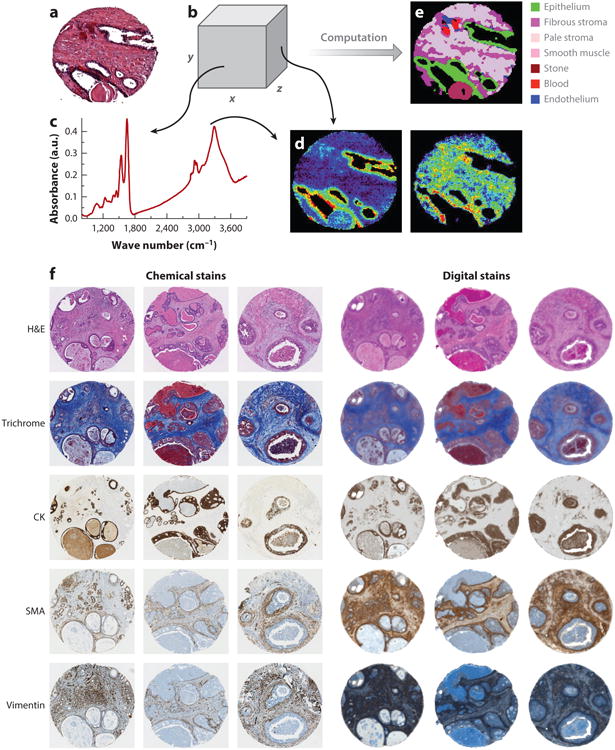
(a) Conventional imaging in pathology requires dyes and a human to recognize cells. (b) In chemical imaging data, both (c) a spectrum at any pixel and the spatial distribution of any spectral feature can be observed, as in (d, left) nucleic acids (at ∼1,080 cm−1) and (right) collagen (at ∼1,245 cm−1). (e) Computational tools can then translate the chemical imaging data into knowledge used in pathology. (f) In addition to the color-coded image in panel e, molecular imaging (left) can be reproduced by chemical imaging (right). Abbreviations: CK, cytokeratin; H&E, hematoxylin and eosin; SMA, smooth muscle α-actin.
3.2. Recent Trends in Infrared Chemical Imaging for Molecular Digital Pathology
In state-of-the-art instrumentation, an interferometer is combined with a microscope to yield both spectral multiplexing and spatial multichannel advantages. An image is produced with a full spectrum acquired for every pixel. In this Fourier transform (FT) approach, entire spectra (typically, 1,024–2,048 points for 4–8 cm−1 resolution and 2n points for fast FT) from many pixels (typically, 16–16,384) are rapidly and simultaneously acquired (84). The small format of these detectors remains a major impediment to data recording speed and will likely be improved in order to enable WSI.
Interestingly, classification methods have shown (85) that collection of entire spectra is unnecessary. This idea drove the development of discrete frequency IR (DFIR) spectroscopy and imaging (82). Although DFIR imaging was initially achieved with the use of inexpensive micro-fabricated filters (86, 87), the throughput was low, and advances in tunable lasers can considerably enhance the DFIR approach and make it practical for use in mDP. In addition to hardware, another exciting development involves increasing the quality and speed of data from CI.
3.2.1. High-resolution imaging
Akin to optical microscopes, the vast majority of experiments in IR imaging have generally relied on transmission sampling measurements. In attenuated total reflection imaging, the evanescent electric field generated from a solid immersion lens (SIL) probes a limited sample volume that is in contact with the lens. First, this technique can allow imaging of fresh-frozen samples, potentially enabling intraoperative mDP by reducing water absorption (88). Second, subwavelength SIL imaging provides ∼1.25-μm spatial resolution (of the surface layer) with no need for sectioning, fixation, or staining. Numerous biomedical applications have been reported (89, 90); however, the unique optical configuration, loss of throughput, and need for contact complicate the experiment. Investigators have also used a subwavelength tip probe (91) for nanoscale measurements. Use of nanoscale imaging systems (92) in research to identify molecular changes is likely imminent, but clinical applications may not be practical in the near future.
3.2.2. New, fast, and high-performance instrumentation
Guided by new instrumentation (93) and theoretical developments (94), the information content of IR images has been shown to be much higher than previously thought, resulting in high-definition (HD) IR imaging. Figure 6 depicts an example of the improvement in image quality using HD optics compared with the conventional design. This approach, either with or without computational extensions (95), implies that, despite the longer wavelengths in the IR region, image quality similar to low-power optical microscopy can be obtained. HD instrumentation, with rationally designed optics (96), also poses challenges (e.g., lower throughput, need for greater speed), which can be addressed with signal processing approaches (97) and/or higher throughput, new sources (98, 99) such as quantum cascade lasers (QCLs) (100–102), and DFIR imaging. Recent studies on HD tissue imaging (103, 104), which has subcellular sensitivity, present an additional challenge to informatics methods. Broadband QCL microscopy was only recently shown to be faster than FT-IR imaging (25). Although initial attempts to use the new laser technology (105) did not provide data of sufficiently high quality, new commercial instruments (106) and laboratory prototypes have demonstrated great potential (107). In particular, through the coupling of spectral variable selection and imaging, a three-orders-of-magnitude-shorter time was recently achieved in comparison to the fastest available HD FT-IR imaging system. We anticipate that the new technology will allow imaging of biopsy samples in only a few minutes.
Figure 6.
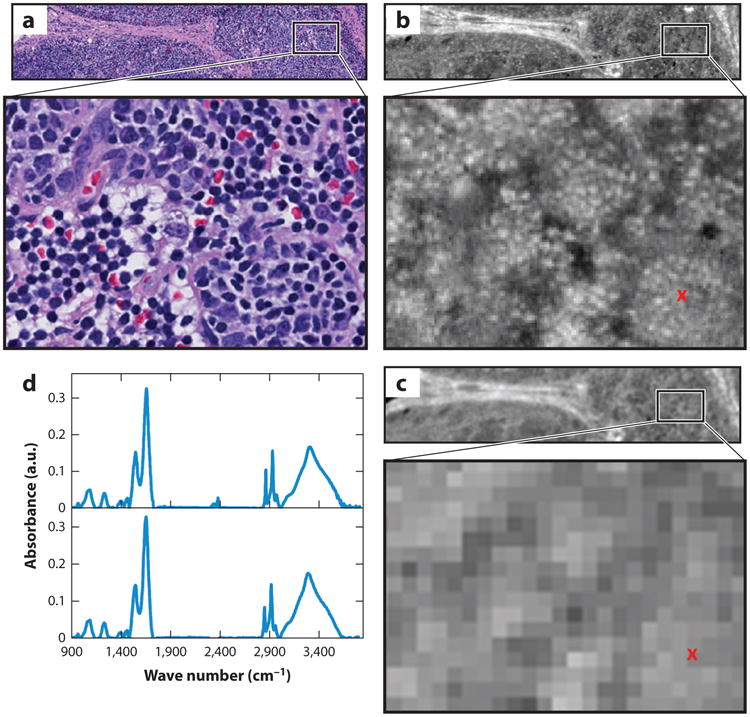
Comparison of hematoxylin and eosin (H&E)-stained optical microscopy and infrared (IR) images of lymph node tissue. (a) An H&E-stained image from a healthy submandibular lymph node biopsy. (b) A high-definition IR image of a serial section of the lymphoid tissue. (c) The same region imaged with a lower-resolution Fourier transform IR (FT-IR) imaging spectrometer. The IR images show the absorbance at 3,075 cm−1 after baseline correction. (d) Sample spectra plotted from the pixel marked with a red x in panel c. There is a slight discordance between the H&E and IR images because they are on different tissue sections.
3.2.3. Fundamentals of spectroscopic imaging: midinfrared theory and bottom-up biology experiments
The straightforward hardware coupling of an interferometer with a microscope and array detector in FT-IR imaging incorrectly signaled that the theoretical models used to understand recorded data were also straightforward. Investigators now realize that a sample's geometry, morphology, microenvironment, and imaging optics also affect the spectrum (96, 108). Although one way to find features that are relatively insensitive to these effects is to use ANOVA (analysis of variance) (109) or bar coding (110), another is to use models (111, 112) of scattering prior to employing informatics approaches. Accurate modeling of the image formation process (113) to recover structural, optical, and morphologic properties of the sample requires more research. Complementary to informatics experiments, many studies seek to understand the biological origins of the signal itself. The important transformations and factors relevant to pathology that have been studied (114–117) include the cell cycle, sample preparation, and the response of biological systems to various stimuli. Although it is impossible to review the large body of research here, fundamental studies remain necessary to provide input for theory-based reconstruction efforts as well as to correlate pathologic identities and optical readouts.
3.3. Informatics Methods for Chemical Imaging
Because CI requires no prior sample knowledge, whole slides can typically be imaged. Pixel-wise computer algorithms typically identify cell types or the presence of disease, as shown on the left side of Figure 3 and described in, for example, References 118 and 119. Whereas informatics methods mirror those for DP, the inputs are spectral and the domain of operation is spectral and not usually spatial. In two schools of thought, either specific spectral features or full spectra (raw or derived quantities such as principal components) serve as input. The advantages of both discrete data points and continuous spectra can be exploited through the use of sparse sampling methods (120). More commonly, dimensionality reduction and classification are combined to provide a classifier that is robust and fast. To this end, a recent trend has been to use optimized hardware–software approaches for real-time processing (121).
3.4. Computational and Big Data Analytic Methods for Molecular Digital Pathology
Because many frequencies are imaged, data sets are considerably larger for spectroscopic imaging. As a result, many more features become available for classification and data sizes are often more extensive than in optical microscopy. The information obtained is also multifaceted (molecular, morphologic, and diagnostic), presenting unique challenges that go beyond those for DP. Below is a brief review of informatics and computational approaches to the quantification of single and multiplexed biomarkers, as well as to spectroscopic imaging and stainless staining modalities.
3.4.1. Biomarker quantification methods
IHC methods are frequently used to assess biomarkers in order to aid diagnoses. Because IHC staining is variable and nonlinear and the manual interpretation is subjective, several approaches have been developed for automated biomarker quantification (see Table 1 for a list of examples). Most studies use supervised learning to identify pixels stained for the specific biomarker, typically through the use of a low-level color or texture feature.
Table 1. Open-source and commercial image analysis platforms for image analysis and biomarker quantification from digital pathology and multiplexed immunohistochemical (IHC) images.
| Digital pathology software | Capabilities and features |
|---|---|
| Precision (Aperio) | Stain separation, cell counting, separation of broad tissue classes |
| inForm (Caliper) | Separation of broad tissue classes |
| Virtuoso (Ventana) | Quantification of IHC staining |
| Halo (Indica) | Segmentation, analysis |
| Visiopharm | Segmentation, feature analysis of angiogenesis, bone growth, neural structure; cancer detection |
| TissueStudio | Image analysis of IHC staining |
| Developer XD (Definiens) | Separation of broad classes and features on the basis of shape, morphology, color of segmented objects |
| FARSIGHT | Optical microscopy applications, focusing on fluorescence |
| ImageJ | Java image analysis package designed with an open architecture to provide extensibility via plugins; recent push to integrate digital pathology images |
3.4.2. Feature-based approaches for quantifying multiplexed biomarkers
Apart from simply quantifying the expression of the individual biomarkers, understanding the spatial interaction between the differently expressing biomarkers (122) has attracted researchers' interest; an example is the three epitopes (123) involved in human tonsil pathology. Through quantitation of the fluorescence intensity for each marker, a colocalization pattern demonstrated that 12% of the total CD34 was colocalized with CK18, whereas only 1% of the CK18 was colocalized with CD34. Similarly, software in conjunction with a multispectral imaging system has been used to analyze CK18, α-methylacyl-CoA racemase, and androgen receptor expression in prostate cancer (124). A multiplexed biomarker imaging approach (8) used to study the tissue systems of Barrett's esophagus showed 14 epithelial and stromal biomarkers, providing significant differences between high-grade dysplasia and reactive atypia.
3.4.3. Molecular digital pathology from spectroscopic imaging data
Although mass spectrometry and Raman imaging show great promise, the discussion in this review is limited to IR imaging. An overwhelming majority of studies utilize standard statistical pattern recognition techniques, including linear discriminant analysis, Bayesian methods, neural networks, and random forests, to find cell types or signatures of disease (reviewed in Reference 125). Investigators are now focusing on patient issues and outcomes (126). Notably, recent studies show that it is possible to classify tissue into carcinoma and benign at human-competitive accuracy (127), relate the cancer detected to the most probable grade (128), and to prognosticate (129).
Initial studies typically involved hundreds of spectra, a few cell types, and tens of samples. A paradigm change has occurred with the common use of tissue microarrays (TMAs) in high-throughput sampling, fast imaging, and robust informatics to provide statistically validated (130) protocols (131, 132). Whereas early techniques focused on reproducing histopathology, newer approaches are exploring data in finer detail in terms of progression in time (133), involvement of the spatial microenvironment (134), secretions (135), variants of tumors (136), and engineered model systems (137). Both supervised and unsupervised methods can be used for these purposes.
3.4.4. Stainless staining
Although staining is used for routine pathology (138), molecular techniques often require multiple markers for disease stratification (139) to be imaged on the same platform. The label-free methods described above can be useful in this regard, but because of their color-coded images they do not easily translate to these established practices in pathology. In a new approach (140), CI data were used to generate computationally stained images resembling molecular stains that are common in mDP. Because the tissue is not actually stained and the histopathologic information is algorithmically obtained, this approach has been termed stainless staining. Figure 5f shows a metrics approach using a neural network model to relate the biochemical input to molecular or dye parameters in order to evaluate various stains. Eliminating the need to stain can enable faster mDP in time-limited (intraoperative) settings, precious or limited samples can be imaged without perturbation, and exploratory mDP for many epitopes can be performed.
4. Multimodal Digital Pathology
4.1. Informatics Methods for Combining Functional and Morphologic Parameters
Tumors with similar morphologic phenotypes may have significantly different behaviors and outcomes (141, 142). There is a general consensus that the intelligent combination of multiple, independent sources of clinical, molecular, and pathological data (both visual and subvisual) can provide more predictive power (143–150), but combining these diverse channels of information is challenging because the dimensionalities of the individual features differ. Multikernel learning (MKL) and canonical correlation analysis (CCA) (151, 152) enable combinations of these attributes to create a unified predictor. MKL strategies (153) allow one to mathematically project an individual set of measurements into new eigenvector representations (which have a lower dimensionality than the original features), which can then be combined into a fused representation (150). CCA strategies (151, 152) aim to find a common representation for multimodal data in which class separation is maximized while noise is minimized. Supervised classifiers can then be constructed in the MKL and CCA reduced spaces. For example, in glioblastoma multiforme (GBM) (154), a multidimensional representation of the computer-extracted nuclear shape and architecture features from whole-mount tissue sections enabled identification of subtypes on the basis of morphometric indices and the predictive capability of each subtype, and the molecular correlates of the subtypes were consistent with previous findings.
The use of CI data for mmDP is less well established but is becoming more common (Figure 7). For example, cell type information (IR histology) has been combined with morphologic variables from H&E-stained images (41). The morphological features thus extracted, optimized by a two-stage feature selection method using a minimum-redundancy maximal-relevance criterion and sequential floating forward selection, were used to classify tissue samples as either cancer or noncancer. This study achieved high accuracy [area under the receiver operating characteristic (ROC) curve (AUC) > 0.97] in cross-validation trials on each of two data sets that were stained under different conditions. In the absence of IR data, the performance of the same classification system decreased both within data sets and between data sets. Only through a combination of IR and optical data could high-accuracy classification be achieved. Other investigators have combined IR with mass spectrometric data and overlain IHC (155) and IR data (156).
Figure 7.
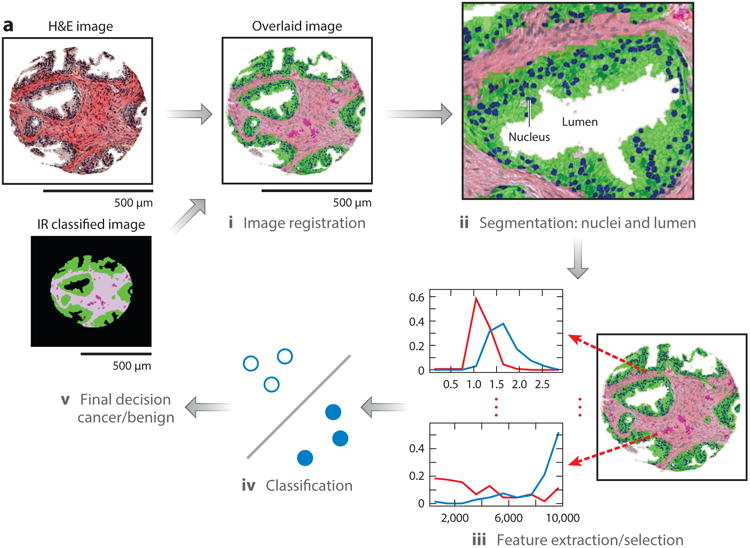
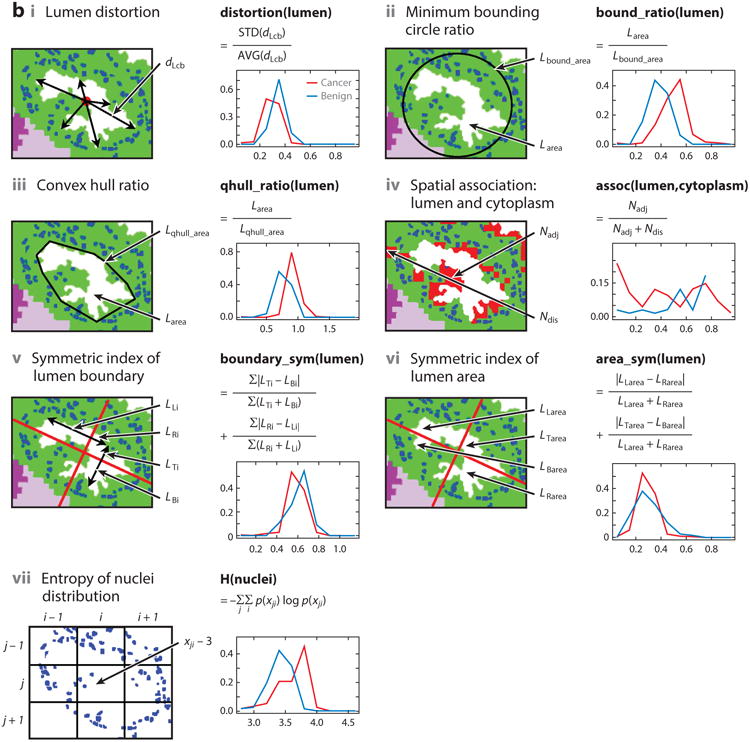
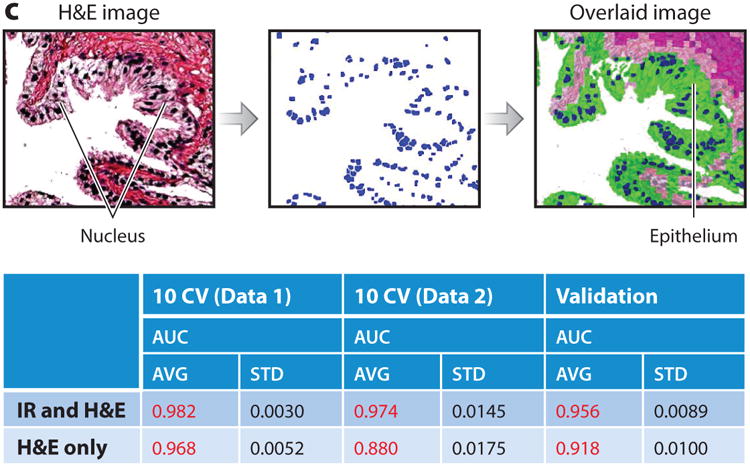
(a) Overview of a multimodal digital pathology system. (i) A Fourier transform infrared (FT-IR) spectroscopy data–based cell type classification (IR classified image) is overlain on a hematoxylin & eosin (H&E)-stained image, leading to (ii) segmentation of nuclei and lumens in a tissue sample. (iii) Features are extracted and selected, then (iv) used by the classifier to (v) predict whether the sample is cancerous or benign. (b) Example features. Each panel shows one feature, along with the distributions of the feature's values for cancer (red) and benign (blue) classes. (c) IR and H&E images can be overlaid with our an automated alignment algorithm, and the features allow better classification of cancer than does H&E staining alone. Abbreviations: AUC, area under the curve; AVG, average; STD, standard deviation.
4.2. Applications in Precision Medicine
Recently, there has been interest in using DP informatics to predict disease recurrence. Research (157) has shown that the combination of nuclear architecture features from H&E- and Feulgen-stained images enabled prediction of BCR in prostate cancer patients; the combination of Feulgen and H&E resulted in better prognosis prediction than did H&E- or Feulgen-derived measurements alone. The results of this study are shown in Figure 8. The 10 top-ranked computer-extracted features from among nuclear shape, nuclear architecture (described via the Voronoi and Delaunay tessellations and cell graphs), orientation, and texture for each stain type were identified via feature selection and used to train a random forest classifier to predict BCR. The features derived from Feulgen, H&E, and both Feulgen and H&E measurements resulted in statistically significant separation of the predicted BCR and nonrecurrence groups; the combination yielded the best discrimination between BCR and nonrecurrence populations (Figure 8).
Figure 8.
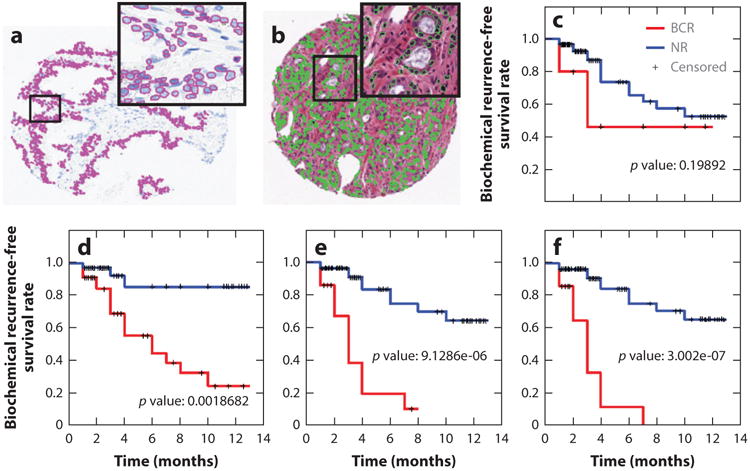
Combination of histomorphometric and histochemical features is more predictive of biochemical recurrence (BCR) in prostate cancer patients than either modality alone. Data are from 69 patients. Nuclei were first automatically detected in (a) Feulgen and (b) hematoxylin and eosin (H&E) images. (c–f) Kaplan–Meier curves for (c) Gleason staining, (d) the top 10 features from H&E staining, (e) a combination of H&E and Feulgen staining, and (f) a combination of Gleason-, Feulgen-, and H&E-derived image markers. Abbreviation: NR, no recurrence.
In a recent study (152), machine learning and data fusion methods (i.e., CCA) were used to computationally combine computer-extracted histomorphometric features and protein expression features (via mass spectrometry) from prostate tissue specimens. The fused predictor predicted the risk of BCR within 5 years of surgery with significantly greater accuracy (AUC=0.92) than morphometric or proteomic features alone.
The use of CI demonstrated both epithelial and stromal changes associated with cancer recurrence without the use of dyes or destructive analysis. Furthermore, because no stains were required, the stromal changes could be probed on a single sample, providing an effective means of adding microenvironment data. In a midgrade dominant prostate cancer patient cohort for whom existing prognostic tools were ineffective, the CI approach outperformed two widely used tools, the Kattan nomogram and the CAPRA-S (Cancer of the Prostate Risk Assessment, postsurgical) score, while providing a histologic explanation for the prediction (Figure 9). An interesting aspect of this study was the use of a frequent pattern mining approach, which enabled similar groups of cells in both the tumor and its microenvironment to be probed simultaneously. The IR spectral information was found to be independent of currently used variables in nomograms in a logistic regression model, providing a new avenue for investigation both of other aspects of the disease, such as therapy response, and of other tumors. Currently, it is not possible to make these numerous stromal observations in a laboratory setting practical for a clinical test. The challenges of measuring multiple cell types via multiple cumbersome steps and of manually combining the data from multiple sections and with clinical management have limited the potential of using the microenvironment. mmDP addresses this need directly.
Figure 9.
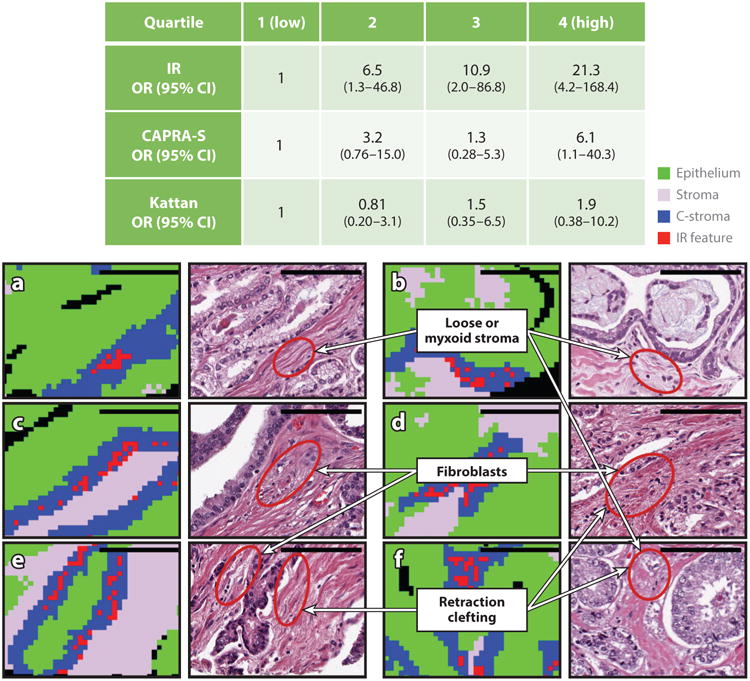
(Top, table) Odds ratios (ORs) of recurrence in prostate cancer shows that the infrared (IR) score is better than the clinical standards, the Kattan nomogram and the Cancer of the Prostate Risk Assessment, postsurgical (CAPRA-S) score. (a–f) The power of the IR score comes from chemical changes in the tumor microenvironment, as shown for six cases. The three most important changes are labeled.
5. Concluding Remarks
Technological advances and innovations, in both instrumentation and informatics tools, are driving several exciting new directions in DP. We have summarized the state of the art with selected examples that introduce the reader to this emerging area. In particular, we note that the field of pathology is moving toward more informative multimodal tissue imaging, wherein integration of computer-derived morphologic and functional tissue-based measurements is becoming a central theme. In addition to conventional decision making, these transitions in DP will lead to a greater impact in the areas of telepathology, education, and precision medicine. The present challenges extend beyond the need for progress in hardware or software to encompass engineering pipelines for robust decision making and improving patient outcomes. This progress will require the integration of engineering and pathology at an unprecedented scale.
DP has not yet been approved for primary diagnosis in the United States. The slow pace of regulatory approval is changing (158), but further impetus is needed to drive clinical adoption (159). Pathology has been practiced with a traditional microscope for more than 100 years; understandably, mass adoption is unlikely to happen spontaneously. Lessons from radiology are pertinent: Following the introduction of digital mammography, radiologists soon gave up looking at mammographic films and made the transition to digital techniques. DP involves additional barriers, including the fact that (unlike radiology) it is not implicitly digital—that is, the tissue slide still needs to be constructed prior to digitization—but the feature sets (both morphologic and molecular) are much richer. The use of advanced computational image analytic tools will offer substantial help to pathologists in efficiently navigating and interpreting the digitized imagery. This issue will become more important as multiplexed tissue biomarkers and multimodal tissue imaging becomes more routine, requiring analytic and informatics methods to scale up to the impending digital data deluge (160). To be accessible to a practicing pathologist, these tools must be able to run on a stand-alone desktop computer. Clearly, in order for DP to be broadly adopted in the clinic, it will be critical to optimize these methods.
The rapid pace of progress in mDP and multimodal DP has been driven by advances in instrumentation, but emerging measurement techniques now need to be standardized (161) and broadly validated. These two advances can offer a wealth of new, independent information that not only allows clinicians to make more effective clinical decisions but also helps them discover underlying biological changes. Such data can also inspire research and aid in the formulation of new hypotheses. In addition to conventional clinical diagnoses, the additional information obtained with mDP and mmDP may enable more molecular-specific diagnoses and rapid intraoperative assessment (162).
Recent progress has led to a transformation in the practice of pathology—one that may rival the introduction of the microscope by Antonie van Leeuwenhoek in the 1600s. The impact and spread of this revolution, however, will hinge on mass adoption following regulatory approvals and represent a rich area of investigation for biomedical engineers and data scientists.
Acknowledgments
Research reported by R.B. in this review is currently supported by the National Institutes of Health (NIH) (grants R01CA197516, R01GM117594, UOIMHl09062, R21CA190120, and R01EB009745). Research reported by A.M. in this review was supported by the National Cancer Institute of the NIH (awards 1U24CA199374-01, R21CA179327-01, and R21CA195152-01); the National Institute of Diabetes and Digestive and Kidney Diseases (award R01DK098503-02); a US Department of Defense (DOD) Prostate Cancer Synergistic Idea Development Award (PC120857); a DOD Lung Cancer Idea Development New Investigator Award (LC130463); a DOD Prostate Cancer Idea Development Award; a Case Comprehensive Cancer Center Pilot Grant; and a VeloSano Grant from the Cleveland Clinic and the Wallace H. Coulter Foundation Program in the Department of Biomedical Engineering at Case Western Reserve University. The content is solely the responsibility of the authors and does not necessarily represent the official views of the NIH.
Footnotes
Disclosure Statement: A.M. is a scientific advisory board member/consultant and has equity in Inspirata Inc. A.M. also has equity in Elucid Bioimaging and is working with PathCore Inc. on National Institutes of Health grant 1U24CA199374-01.
Literature Cited
- 1.Ghaznavi F, Evans A, Madabhushi A, Feldman M. Digital imaging in pathology: whole-slide imaging and beyond. Annu Rev Pathol Mech Dis. 2013;8:331–59. doi: 10.1146/annurev-pathol-011811-120902. [DOI] [PubMed] [Google Scholar]
- 2.Madabhushi A. Digital pathology image analysis: opportunities and challenges. Imaging Med. 2009;1:7–10. doi: 10.2217/IIM.09.9. [DOI] [PMC free article] [PubMed] [Google Scholar]
- 3.Pantanowitz L, Sinard JH, Henricks WH, Fatheree LA, Carter AB, et al. Validating whole slide imaging for diagnostic purposes in pathology: guideline from the College of American Pathologists Pathology and Laboratory Quality Center. Arch Pathol Lab Med. 2013;137:1710–22. doi: 10.5858/arpa.2013-0093-CP. [DOI] [PMC free article] [PubMed] [Google Scholar]
- 4.Snead DR, Tsang YW, Meskiri A, Kimani PK, Crossman R, et al. Validation of digital pathology imaging for primary histopathological diagnosis. Histopathology. 2015 doi: 10.1111/his.12879. In press. [DOI] [PubMed] [Google Scholar]
- 5.Farahani N, Pantanowitz L. Overview of telepathology. Surg Pathol Clin. 2015;8:223–31. doi: 10.1016/j.path.2015.02.018. [DOI] [PubMed] [Google Scholar]
- 6.Pantanowitz L, Dickinson K, Evans AJ, Hassell LA, Henricks WH, et al. American Telemedicine Association clinical guidelines for telepathology. J Pathol Inform. 2014;5:39. doi: 10.4103/2153-3539.143329. [DOI] [PMC free article] [PubMed] [Google Scholar]
- 7.Pantanowitz L, McHugh J, Cable W, Zhao C, Parwani AV. Imaging file management to support international telepathology. J Pathol Inform. 2015;6:17. doi: 10.4103/2153-3539.153917. [DOI] [PMC free article] [PubMed] [Google Scholar]
- 8.Prichard JW, Davison JM, Campbell BB, Repa KA, Reese LM, et al. TissueCypher™: a systems biology approach to anatomic pathology. J Pathol Inform. 2015;6:48. doi: 10.4103/2153-3539.163987. [DOI] [PMC free article] [PubMed] [Google Scholar]
- 9.Ali S, Veltri R, Epstein JI, Christudass C, Madabhushi A. Selective invocation of shape priors for deformable segmentation and morphologic classification of prostate cancer tissue microarrays. Comput Med Imaging Graph. 2015;41:3–13. doi: 10.1016/j.compmedimag.2014.11.001. [DOI] [PMC free article] [PubMed] [Google Scholar]
- 10.Ali S, Madabhushi A. An integrated region-, boundary-, shape-based active contour for multiple object overlap resolution in histological imagery. IEEE Trans Med Imaging. 2012;31:1448–60. doi: 10.1109/TMI.2012.2190089. [DOI] [PubMed] [Google Scholar]
- 11.Ali S, Madabhushi A. Graphical processing unit implementation of an integrated shape-based active contour: application to digital pathology. J Pathol Inform. 2011;2:S13. doi: 10.4103/2153-3539.92029. [DOI] [PMC free article] [PubMed] [Google Scholar]
- 12.Fatakdawala H, Xu J, Basavanhally A, Bhanot G, Ganesan S, et al. Expectation-maximization-driven geodesic active contour with overlap resolution (EMaGACOR): application to lymphocyte segmentation on breast cancer histopathology. IEEE Trans Biomed Eng. 2010;57:1676–89. doi: 10.1109/TBME.2010.2041232. [DOI] [PubMed] [Google Scholar]
- 13.Monaco J, Hipp J, Lucas D, Smith S, Balis U, Madabhushi A. Image segmentation with implicit color standardization using spatially constrained expectation maximization: detection of nuclei. Med Image Comput Comput Assist Interv. 2012;15:365–72. doi: 10.1007/978-3-642-33415-3_45. [DOI] [PubMed] [Google Scholar]
- 14.Veta M, van Diest PJ, Willems SM, Wang H, Madabhushi A, et al. Assessment of algorithms for mitosis detection in breast cancer histopathology images. Med Image Anal. 205;20:237–48. doi: 10.1016/j.media.2014.11.010. [DOI] [PubMed] [Google Scholar]
- 15.Wang AH, Cruz A, Basavanhally A, Gilmore H, Shih N, et al. Mitosis detection in breast cancer pathology images by combining handcrafted and convolutional neural network features. J Med Imaging. 2014;1:034003. doi: 10.1117/1.JMI.1.3.034003. [DOI] [PMC free article] [PubMed] [Google Scholar]
- 16.Basavanhally AN, Ganesan S, Agner S, Monaco JP, Feldman MD, et al. Computerized image-based detection and grading of lymphocytic infiltration in HER2+ breast cancer histopathology. IEEE Trans Biomed Eng. 2010;57:642–53. doi: 10.1109/TBME.2009.2035305. [DOI] [PubMed] [Google Scholar]
- 17.Chen JM, Qu AP, Wang LW, Yuan JP, Yang F, et al. New breast cancer prognostic factors identified by computer-aided image analysis of HE stained histopathology images. Sci Rep. 2015;5:10690. doi: 10.1038/srep10690. [DOI] [PMC free article] [PubMed] [Google Scholar]
- 18.Chu P, Weiss L. Modern Immunohistochemistry. 2 Cambridge, UK: Cambridge Univ. Press; 2014. [Google Scholar]
- 19.Camp RL, Chung GG, Rimm DL. Automated subcellular localization and quantification of protein expression in tissue microarrays. Nat Med. 2002;8:1323–27. doi: 10.1038/nm791. [DOI] [PubMed] [Google Scholar]
- 20.Angelo M, Bendall SC, Finck R, Hale MB, Hitzman C, et al. Multiplexed ion beam imaging of human breast tumors. Nat Med. 2014;20:436–42. doi: 10.1038/nm.3488. [DOI] [PMC free article] [PubMed] [Google Scholar]
- 21.Xing Y, Chaudry Q, Shen C, Kong KY, Zhau HE, et al. Bioconjugated quantum dots for multiplexed and quantitative immunohistochemistry. Nat Protoc. 2007;2:1152–65. doi: 10.1038/nprot.2007.107. [DOI] [PubMed] [Google Scholar]
- 22.Evans CL, Potma EO, Puoris'haag M, Côté D, Lin CP, Xie XS. Chemical imaging of tissue in vivo with video-rate coherent anti-Stokes Raman scattering microscopy. PNAS. 2005;102:16807–12. doi: 10.1073/pnas.0508282102. [DOI] [PMC free article] [PubMed] [Google Scholar]
- 23.Freudiger CW, Min W, Saar BG, Lu S, Holtom GR, et al. Label-free biomedical imaging with high sensitivity by stimulated Raman scattering microscopy. Science. 2008;322:1857–61. doi: 10.1126/science.1165758. [DOI] [PMC free article] [PubMed] [Google Scholar]
- 24.Nandakumar P, Kovalev A, Volkmer A. Vibrational imaging based on stimulated Raman scattering microscopy. New J Phys. 2009;11:033026. [Google Scholar]
- 25.Yeh K, Kenkel S, Liu JN, Bhargava R. Fast infrared chemical imaging with a quantum cascade laser. Anal Chem. 2015;87:485–93. doi: 10.1021/ac5027513. [DOI] [PMC free article] [PubMed] [Google Scholar]
- 26.Lasch P, Haensch W, Naumann D, Diem M. Imaging of colorectal adenocarcinoma using FT-IR microspectroscopy and cluster analysis. Biochim Biophys Acta. 2004;1688:176–86. doi: 10.1016/j.bbadis.2003.12.006. [DOI] [PubMed] [Google Scholar]
- 27.Al-Janabi S, Huisman A, Van Diest PJ. Digital pathology: current status and future perspectives. Histopathology. 2012;61:1–9. doi: 10.1111/j.1365-2559.2011.03814.x. [DOI] [PubMed] [Google Scholar]
- 28.Gurcan MN, Boucheron LE, Can A, Madabhushi A, Rajpoot NM, Yener B. Histopathological image analysis: a review. IEEE Rev Biomed Eng. 2009;2:147–71. doi: 10.1109/RBME.2009.2034865. [DOI] [PMC free article] [PubMed] [Google Scholar]
- 29.Irshad H, Veillard A, Roux L, Racoceanu D. Methods for nuclei detection, segmentation, and classification in digital histopathology: a review—current status and future potential. IEEE Rev Biomed Eng. 2014;7:97–114. doi: 10.1109/RBME.2013.2295804. [DOI] [PubMed] [Google Scholar]
- 30.Pantanowitz L, Valenstein PN, Evans AJ, Kaplan KJ, Pfeifer JD, et al. Review of the current state of whole slide imaging in pathology. J Pathol Inform. 2011;2:36. doi: 10.4103/2153-3539.83746. [DOI] [PMC free article] [PubMed] [Google Scholar]
- 31.Rocha R, Vassallo J, Soares F, Miller K, Gobbi H. Digital slides: present status of a tool for consultation, teaching, and quality control in pathology. Pathol Res Pract. 2009;205:735–41. doi: 10.1016/j.prp.2009.05.004. [DOI] [PubMed] [Google Scholar]
- 32.Kanade T. PhD thesis, Dep Inf Sci. Kyoto Univ.; Kyoto, Jpn: 1973. Picture processing system by computer complex and recognition of human faces. [Google Scholar]
- 33.Nishikawa RM, Giger ML, Doi K, Vyborny CJ, Schmidt RA. Computer-aided detection of clustered microcalcifications: an improved method for grouping detected signals. Med Phys. 1993;20:1661–66. doi: 10.1118/1.596952. [DOI] [PubMed] [Google Scholar]
- 34.Prewitt JM, Mendelsohn ML. The analysis of cell images. Ann NY Acad Sci. 1966;128:1035–53. doi: 10.1111/j.1749-6632.1965.tb11715.x. [DOI] [PubMed] [Google Scholar]
- 35.Jack CR, Jr, Bernstein MA, Fox NC, Thompson P, Alexander G, et al. The Alzheimer's Disease Neuroimaging Initiative (ADNI): MRI methods. J Magn Reson Imaging. 2008;27:685–91. doi: 10.1002/jmri.21049. [DOI] [PMC free article] [PubMed] [Google Scholar]
- 36.Mincione G, Di Nicola M, Di Marcantonio MC, Muraro R, Piattelli A, et al. Nuclear fractal dimension in oral squamous cell carcinoma: a novel method for the evaluation of grading, staging, and survival. J Oral Pathol Med. 2015;44:680–84. doi: 10.1111/jop.12280. [DOI] [PubMed] [Google Scholar]
- 37.Khan AM, El-Daly H, Rajpoot N. RanPEC: random projections with ensemble clustering for segmentation of tumor areas in breast histology images. In: Xie X, editor. Proceedings of the 16th Conference on Medical Image Understanding and Analysis. Swansea, UK: Dep. Comput. Sci., Univ. Swansea; 2012. pp. 17–23. [Google Scholar]
- 38.Hipp JD, Cheng JY, Toner M, Tompkins RG, Balis UJ. Spatially invariant vector quantization: a pattern matching algorithm for multiple classes of image subject matter including pathology. J Pathol Inform. 2011;2:13. doi: 10.4103/2153-3539.77175. [DOI] [PMC free article] [PubMed] [Google Scholar]
- 39.Kong J, Sertel O, Shimada H, Boyer K, Saltz J, Gurcan M. Proceedings of the IEEE International Conference on Image Processing. Vol. 5. Piscataway, NJ: IEEE; 2007. Computer-aided grading of neuroblastic differentiation: multi-resolution and multi-classifier approach; pp. 525–28. [Google Scholar]
- 40.Wang YY, Chang SC, Wu LW, Tsai ST, Sun YN. Proceedings of the 29th Annual International Conference of the IEEE Engineering in Medicine and Biology Society. Piscataway, NJ: IEEE; 2007. A color-based approach for automated segmentation in tumor tissue classification; pp. 6577–80. [DOI] [PubMed] [Google Scholar]
- 41.Kwak JT, Hewitt SM, Bhargava R. Multimodal microscopy for automated histologic analysis of prostate cancer. BMC Cancer. 2011;11:62. doi: 10.1186/1471-2407-11-62. [DOI] [PMC free article] [PubMed] [Google Scholar]
- 42.Guo Y, Xu X, Wang Y, Wang Y, Xia S, Yang Z. An image processing pipeline to detect and segment nuclei in muscle fiber microscopic images. Microsc Res Tech. 2014;77:547–59. doi: 10.1002/jemt.22373. [DOI] [PubMed] [Google Scholar]
- 43.Gurcan MN, Madabhushi A, Rajpoot N. Pattern recognition in histopathological images: an ICPR 2010 contest. In: Ünay D, Çataltepe Z, Aksoy S, editors. Recognizing Patterns in Signals, Speech, Images and Videos. Berlin: Springer; 2010. pp. 226–34. [Google Scholar]
- 44.Basavanhally A, Ganesan S, Feldman M, Shih N, Mies C, et al. Multi-field-of-view framework for distinguishing tumor grade in ER+ breast cancer from entire histopathology slides. IEEE Trans Biomed Eng. 2013;60:2089–99. doi: 10.1109/TBME.2013.2245129. [DOI] [PMC free article] [PubMed] [Google Scholar]
- 45.Doyle S, Feldman MD, Shih N, Tomaszewski J, Madabhushi A. Cascaded discrimination of normal, abnormal, and confounder classes in histopathology: Gleason grading of prostate cancer. BMC Bioinform. 2012;13:282. doi: 10.1186/1471-2105-13-282. [DOI] [PMC free article] [PubMed] [Google Scholar]
- 46.Sparks R, Madabhushi A. Statistical shape model for manifold regularization: Gleason grading of prostate histology. Comput Vis Image Underst. 2013;117:1138–46. doi: 10.1016/j.cviu.2012.11.011. [DOI] [PMC free article] [PubMed] [Google Scholar]
- 47.Sparks R, Madabhushi A. Explicit shape descriptors: novel morphologic features for histopathology classification. Med Image Anal. 2013;17:997–1009. doi: 10.1016/j.media.2013.06.002. [DOI] [PMC free article] [PubMed] [Google Scholar]
- 48.Kass M, Witkin A, Terzopoulos D. Snakes: active contour models. Int J Comput Vis. 1988;1:321–31. [Google Scholar]
- 49.Osher S, Sethian JA. Fronts propagating with curvature-dependent speed: algorithms based on Hamilton–Jacobi formulations. J Comput Phys. 1988;79:12–49. [Google Scholar]
- 50.van Ginneken B, Frangi AF, Staal JJ, ter Haar Romeny BM, Viergever MA. Active shape model segmentation with optimal features. IEEE Trans Med Imaging. 2002;21:924–33. doi: 10.1109/TMI.2002.803121. [DOI] [PubMed] [Google Scholar]
- 51.Cireşan DC, Giusti A, Gambardella LM, Schmidhuber J. Mitosis detection in breast cancer histology images with deep neural networks. Med Image Comput Comput Assist Interv. 2013;16:411–18. doi: 10.1007/978-3-642-40763-5_51. [DOI] [PubMed] [Google Scholar]
- 52.Cruz-Roa A, Basavanhally A, González F, Gilmore H, Feldman M, et al. Automatic detection of invasive ductal carcinoma in whole slide images with convolutional neural networks. Proc SPIE. 2014;9041:904103. [Google Scholar]
- 53.Bilgin C, Demir C, Nagi C, Yener B. Proceedings of the 29th Annual International Conference of the IEEE Engineering in Medicine and Biology Society. Piscataway, NJ: IEEE; 2007. Cell-graph mining for breast tissue modeling and classification; pp. 5311–14. [DOI] [PubMed] [Google Scholar]
- 54.Marcelpoil R. Normalization of the minimum spanning tree. Anal Cell Pathol. 1993;5:177–86. [PubMed] [Google Scholar]
- 55.Ali S, Lewis J, Madabhushi A. Spatially aware cell cluster (spACC1) graphs: predicting outcome in oropharyngeal pl6+ tumors. Med Image Comput Comput Assist Interv. 2013;16:412–19. doi: 10.1007/978-3-642-40811-3_52. [DOI] [PubMed] [Google Scholar]
- 56.Ali S, Veltri R, Epstein JA, Christudass C, Madabhushi A. Cell cluster graph for prediction of biochemical recurrence in prostate cancer patients from tissue microarrays. Proc SPIE. 2013;8676:H86760. [Google Scholar]
- 57.Lewis JS, Jr, Ali S, Luo J, Thorstad WL, Madabhushi A. A quantitative histomorphometric classifier (QuHbIC) identifies aggressive versus indolent p16-positive oropharyngeal squamous cell carcinoma. Am J Surg Pathol. 2014;38:128–37. doi: 10.1097/PAS.0000000000000086. [DOI] [PMC free article] [PubMed] [Google Scholar]
- 58.Lee G, Sparks R, Ali S, Shih NNC, Feldman MD, et al. Co-occurring gland angularity in localized subgraphs: predicting biochemical recurrence in intermediate-risk prostate cancer patients. PLOS ONE. 2014;9:e97954. doi: 10.1371/journal.pone.0097954. [DOI] [PMC free article] [PubMed] [Google Scholar]
- 59.Yu E, Monaco JP, Tomaszewski J, Shih N, Feldman M, Madabhushi A. Proceedings of the 33rd Annual International Conference of the IEEE Engineering in Medicine and Biology Society. Piscataway, NJ: IEEE; 2011. Detection of prostate cancer on histopathology using color fractals and probabilistic pairwise Markov models; pp. 3427–30. [DOI] [PubMed] [Google Scholar]
- 60.Lee G, Ali S, Veltri R, Epstein JI, Christudass C, Madabhushi A. Cell orientation entropy (COrE): predicting biochemical recurrence from prostate cancer tissue microarrays. Med Image Comput Comput Assist Interv. 2013;16:396–403. doi: 10.1007/978-3-642-40760-4_50. [DOI] [PubMed] [Google Scholar]
- 61.Jain AK, Farrokhnia F. Unsupervised texture segmentation using Gabor filters. Pattern Recognit. 1991;24:1167–86. [Google Scholar]
- 62.Ojala T, Pietikainen M, Harwood D. Proceedings of the 12th IAPR International Conference on Pattern Recognition. Vol. 1. Los Alamitos, CA: IEEE Comput. Soc. Press; 1994. Performance evaluation of texture measures with classification based on Kullback discrimination of distributions; pp. 582–85. [Google Scholar]
- 63.Laws KI. Univ South Calif Image Proc Inst (USCIPI) rep 940, Dep Electr Eng. USCIPI; Los Angeles: 1980. Textured image segmentation. [Google Scholar]
- 64.Beck AH, Sangoi AR, Leung S, Marinelli RJ, Nielsen TO, et al. Systematic analysis of breast cancer morphology uncovers stromal features associated with survival. Sci Transl Med. 2011;3:108ra113. doi: 10.1126/scitranslmed.3002564. [DOI] [PubMed] [Google Scholar]
- 65.Gertych A, Ing N, Ma Z, Fuchs TJ, Salman S, et al. Machine learning approaches to analyze histological images of tissues from radical prostatectomies. Comput Med Imaging Graph. 2015;46:197–208. doi: 10.1016/j.compmedimag.2015.08.002. [DOI] [PMC free article] [PubMed] [Google Scholar]
- 66.Doyle S, Feldman M, Tomaszewski J, Madabhushi A. A boosted Bayesian multiresolution classifier for prostate cancer detection from digitized needle biopsies. IEEE Trans Biomed Eng. 2012;59:1205–18. doi: 10.1109/TBME.2010.2053540. [DOI] [PubMed] [Google Scholar]
- 67.Bellman R. Dynamic Programming. Princeton, NJ: Princeton Univ. Press; 1957. [Google Scholar]
- 68.Lee G, Rodriguez C, Madabhushi A. Investigating the efficacy of nonlinear dimensionality reduction schemes in classifying gene and protein expression studies. IEEE/ACM Trans Comput Biol Bioinform. 2008;5:368–84. doi: 10.1109/TCBB.2008.36. [DOI] [PMC free article] [PubMed] [Google Scholar]
- 69.Ginsburg S, Lee G, Ali S, Madabhushi A. Feature importance in nonlinear embeddings (FINE): applications in digital pathology. IEEE Trans Med Imaging. 2015;99:1. doi: 10.1109/TMI.2015.2456188. [DOI] [PubMed] [Google Scholar]
- 70.Paik S, Shak S, Tang G, Kim C, Baker J, et al. A multigene assay to predict recurrence of tamoxifen-treated, node-negative breast cancer. N Engl J Med. 2004;351:2817–26. doi: 10.1056/NEJMoa041588. [DOI] [PubMed] [Google Scholar]
- 71.Ali S, Lewis JS, Madabhushi A. Use of quantitative histomorphometrics to classify disease progression in HPV-positive squamous cell carcinoma. J Clin Oncol. 2012;30:73. abstr. [Google Scholar]
- 72.Boyce BF. Whole slide imaging: uses and limitations for surgical pathology and teaching. Biotech Histochem. 2015;90:321–30. doi: 10.3109/10520295.2015.1033463. [DOI] [PubMed] [Google Scholar]
- 73.Hartman DJ. Mobile technologies for the surgical pathologist. Surg Pathol Clin. 2015;8:233–38. doi: 10.1016/j.path.2015.02.007. [DOI] [PubMed] [Google Scholar]
- 74.Jones NC, Nazarian RM, Duncan LM, Kamionek M, Lauwers GY, et al. Interinstitutional whole slide imaging teleconsultation service development: assessment using internal training and clinical consultation cases. Arch Pathol Lab Med. 2015;139:627–35. doi: 10.5858/arpa.2014-0133-OA. [DOI] [PubMed] [Google Scholar]
- 75.Desai S, Patil R, Kothari A, Shet T, Kane S, et al. Static telepathology consultation service between Tata Memorial Centre, Mumbai and Nargis Dutt Memorial Charitable Hospital, Barshi, Solapur, Maharashtra: an analysis of the first 100 cases. Indian J Pathol Microbiol. 2004;47:480–85. [PubMed] [Google Scholar]
- 76.Leifer Z. The use of virtual microscopy and a wiki in pathology education: tracking student use, involvement, and response. J Pathol Inform. 2015;6:30. doi: 10.4103/2153-3539.158063. [DOI] [PMC free article] [PubMed] [Google Scholar]
- 77.Van Es SL, Kumar RK, Pryor WM, Salisbury EL, Velan GM. Cytopathology whole slide images and adaptive tutorials for postgraduate pathology trainees: a randomized crossover trial. Hum Pathol. 2015;46:1297–305. doi: 10.1016/j.humpath.2015.05.009. [DOI] [PubMed] [Google Scholar]
- 78.Kaplan KJ. PathXchange case of the week. Digital Pathology Blog. 2012 June 20 http://tissuepathology.com/2012/06/20/pathxchange-case-of-the-week-1#axzz3pyCcAMuX.
- 79.Sağol Ö, Yörükoğlu K, Lebe B, Durak MG, Ulukuş Ç, et al. Transition to virtual microscopy in medical undergraduate pathology education: first experience of Turkey in Dokuz Eylül University Hospital. Türk Patol Derg. 2015;31:175–80. doi: 10.5146/tjpath.2015.01329. [DOI] [PubMed] [Google Scholar]
- 80.Engelberg JA, Retallack H, Balassanian R, Dowsett M, Zabaglo L, et al. “Score the Core” web-based pathologist training tool improves the accuracy of breast cancer IHC4 scoring. Hum Pathol. 2015;46:1694–704. doi: 10.1016/j.humpath.2015.07.008. [DOI] [PubMed] [Google Scholar]
- 81.Walkowski S, Lundin M, Szymas J, Lundin J. Students' performance during practical examination on whole slide images using view path tracking. Diagn Pathol. 2014;9:208. doi: 10.1186/s13000-014-0208-6. [DOI] [PMC free article] [PubMed] [Google Scholar]
- 82.Bhargava R. Infrared spectroscopic imaging: the next generation. Appl Spectrosc. 2012;66:1091–120. doi: 10.1366/12-06801. [DOI] [PMC free article] [PubMed] [Google Scholar]
- 83.Diem M, Mazur A, Lenau K, Schubert J, Bird B, et al. Molecular pathology via IR and Raman spectral imaging. J Biophotonics. 2013;6:855–86. doi: 10.1002/jbio.201300131. [DOI] [PubMed] [Google Scholar]
- 84.Levin IW, Bhargava R. Fourier transform infrared vibrational spectroscopic imaging: integrating microscopy and molecular recognition. Annu Rev Phys Chem. 2005;56:429–74. doi: 10.1146/annurev.physchem.56.092503.141205. [DOI] [PubMed] [Google Scholar]
- 85.Bhargava R, Fernandez DC, Hewitt SM, Levin IW. High throughput assessment of cells and tissues: Bayesian classification of spectral metrics from infrared vibrational spectroscopic imaging data. Biochim Biophys Acta. 2006;1758:830–45. doi: 10.1016/j.bbamem.2006.05.007. [DOI] [PubMed] [Google Scholar]
- 86.Kodali AK, Schulmerich M, Ip J, Yen G, Cunningham BT, Bhargava R. Narrowband midinfrared reflectance filters using guided mode resonance. Anal Chem. 2010;82:5697–706. doi: 10.1021/ac1007128. [DOI] [PMC free article] [PubMed] [Google Scholar]
- 87.Liu JN, Schulmerich MV, Bhargava R, Cunningham BT. Optimally designed narrowband guided-mode resonance reflectance filters for mid-infrared spectroscopy. Opt Express. 2011;19:24182–97. doi: 10.1364/OE.19.024182. [DOI] [PMC free article] [PubMed] [Google Scholar]
- 88.Geiger FB, Koerdel M, Schick A, Heimann A, Matiasek K, Herkommer AM. Concept and setup for intraoperative imaging of tumorous tissue via attenuated total reflection spectrosocopy with quantum cascade lasers. Proc SPIE. 2015;9412:F94125. [Google Scholar]
- 89.Chan KLA, Kazarian SG. Chemical imaging of the stratum corneum under controlled humidity with the attenuated total reflection Fourier transform infrared spectroscopy method. J Biomed Opt. 2007;12:044010. doi: 10.1117/1.2754686. [DOI] [PubMed] [Google Scholar]
- 90.Kazarian SG, Chan KLA. Applications of ATR-FTIR spectroscopic imaging to biomedical samples. Biochim Biophys Acta. 2006;1758:858–67. doi: 10.1016/j.bbamem.2006.02.011. [DOI] [PubMed] [Google Scholar]
- 91.Marcott C, Lo M, Kjoller K, Domanov Y, Balooch G, Luengo GS. Nanoscale infrared (IR) spectroscopy and imaging of structural lipids in human stratum corneum using an atomic force microscope to directly detect absorbed light from a tunable IR laser source. Exp Dermatol. 2013;22:419–21. doi: 10.1111/exd.12144. [DOI] [PubMed] [Google Scholar]
- 92.Centrone A. Infrared imaging and spectroscopy beyond the diffraction limit. Annu Rev Anal Chem. 2015;8:101–26. doi: 10.1146/annurev-anchem-071114-040435. [DOI] [PubMed] [Google Scholar]
- 93.Nasse MJ, Walsh MJ, Mattson EC, Reininger R, Kajdacsy-Balla A, et al. High-resolution Fourier-transform infrared chemical imaging with multiple synchrotron beams. Nat Methods. 2011;8:413–16. doi: 10.1038/nmeth.1585. [DOI] [PMC free article] [PubMed] [Google Scholar]
- 94.Reddy RK, Walsh MJ, Schulmerich MV, Carney PS, Bhargava R. High-definition infrared spectroscopic imaging. Appl Spectrosc. 2013;67:93–105. doi: 10.1366/11-06568. [DOI] [PMC free article] [PubMed] [Google Scholar]
- 95.van Dijk T, Mayerich D, Bhargava R, Carney PS. Rapid spectral-domain localization. Opt Express. 2013;21:12822–30. doi: 10.1364/OE.21.012822. [DOI] [PMC free article] [PubMed] [Google Scholar]
- 96.van Dijk T, Mayerich D, Carney PS, Bhargava R. Understanding the optics-sample interaction in infrared spectroscopic imaging. Analyst. 2016 In press. [Google Scholar]
- 97.Reddy RK, Bhargava R. Accurate histopathology from low signal-to-noise ratio spectroscopic imaging data. Analyst. 2010;135:2818–25. doi: 10.1039/c0an00350f. [DOI] [PubMed] [Google Scholar]
- 98.Phillips MC, Hô N. Infrared hyperspectral imaging using a broadly tunable external cavity quantum cascade laser and microbolometer focal plane array. Opt Express. 2008;16:1836–45. doi: 10.1364/oe.16.001836. [DOI] [PubMed] [Google Scholar]
- 99.Serrano AL, Ghosh A, Ostrander JS, Zanni MT. Wide-field FTIR microscopy using mid-IR pulse shaping. Opt Express. 2015;23:17815–27. doi: 10.1364/OE.23.017815. [DOI] [PMC free article] [PubMed] [Google Scholar]
- 100.Capasso F. High-performance midinfrared quantum cascade lasers. Opt Eng. 2010;49:111102. [Google Scholar]
- 101.Faist J, Capasso F, Sivco DL, Sirtori C, Hutchinson AL, Cho AY. Quantum cascade laser. Science. 1994;264:553–56. doi: 10.1126/science.264.5158.553. [DOI] [PubMed] [Google Scholar]
- 102.Luo G, Peng C, Le H, Pei S, Hwang WY, et al. Grating-tuned external-cavity quantum-cascade semiconductor lasers. Appl Phys Lett. 2001;78:2834–36. [Google Scholar]
- 103.Leslie LS, Wrobel TP, Mayerich D, Bindra S, Emmadi R, Bhargava R. High definition infrared spectroscopic imaging for lymph node histopathology. PLOS ONE. 2015;10:e0127238. doi: 10.1371/journal.pone.0127238. [DOI] [PMC free article] [PubMed] [Google Scholar]
- 104.Sreedhar H, Varma VK, Nguyen PL, Davidson B, Akkina S, et al. High-definition Fourier transform infrared (FT-IR) spectroscopic imaging of human tissue sections towards improving pathology. J Vis Exp. 2015;95:52332. doi: 10.3791/52332. [DOI] [PMC free article] [PubMed] [Google Scholar]
- 105.Kole MR, Reddy RK, Schulmerich MV, Gelber MK, Bhargava R. Discrete frequency infrared microspectroscopy and imaging with a tunable quantum cascade laser. Anal Chem. 2012;84:10366–72. doi: 10.1021/ac302513f. [DOI] [PMC free article] [PubMed] [Google Scholar]
- 106.Bassan P, Weida MJ, Rowlette J, Gardner P. Large scale infrared imaging of tissue micro arrays (TMAs) using a tunable quantum cascade laser (QCL) based microscope. Analyst. 2014;139:3856–59. doi: 10.1039/c4an00638k. [DOI] [PubMed] [Google Scholar]
- 107.Kröger N, Egl A, Engel M, Gretz N, Haase K, et al. Quantum cascade laser–based hyperspectral imaging of biological tissue. J Biomed Opt. 2014;19:111607. doi: 10.1117/1.JBO.19.11.111607. [DOI] [PubMed] [Google Scholar]
- 108.Mohlenhoff B, Romeo M, Diem M, Wood BR. Mie-type scattering and non-Beer-Lambert absorption behavior of human cells in infrared microspectroscopy. Biophys J. 2005;88:3635–40. doi: 10.1529/biophysj.104.057950. [DOI] [PMC free article] [PubMed] [Google Scholar]
- 109.Kwak JT, Reddy R, Sinha S, Bhargava R. Analysis of variance in spectroscopic imaging data from human tissues. Anal Chem. 2012;84:1063–69. doi: 10.1021/ac2026496. [DOI] [PMC free article] [PubMed] [Google Scholar]
- 110.Nallala J, Piot O, Diebold MD, Gobinet C, Bouché O, et al. Infrared imaging as a cancer diagnostic tool: introducing a new concept of spectral barcodes for identifying molecular changes in colon tumors. Cytometry A. 2013;83:294–300. doi: 10.1002/cyto.a.22249. [DOI] [PubMed] [Google Scholar]
- 111.Bassan P, Kohler A, Martens H, Lee J, Byrne HJ, et al. Resonant Mie scattering (RMieS) correction of infrared spectra from highly scattering biological samples. Analyst. 2010;135:268–77. doi: 10.1039/b921056c. [DOI] [PubMed] [Google Scholar]
- 112.Bassan P, Kohler A, Martens H, Lee J, Jackson E, et al. RMieS-EMSC correction for infrared spectra of biological cells: extension using full Mie theory and GPU computing. J Biophotonics. 2010;3:609–20. doi: 10.1002/jbio.201000036. [DOI] [PubMed] [Google Scholar]
- 113.van Dijk T, Mayerich D, Carney PS, Bhargava R. Recovery of absorption spectra from Fourier transform infrared (FT-IR) microspectroscopic measurements of intact spheres. Appl Spectrosc. 2013;67:546–52. doi: 10.1366/12-06847. [DOI] [PubMed] [Google Scholar]
- 114.Holton SE, Bergamaschi A, Katzenellenbogen BS, Bhargava R. Integration of molecular profiling and chemical imaging to elucidate fibroblast–microenvironment impact on cancer cell phenotype and endocrine resistance in breast cancer. PLOS ONE. 2014;9:e96878. doi: 10.1371/journal.pone.0096878. [DOI] [PMC free article] [PubMed] [Google Scholar]
- 115.Holton SE, Walsh MJ, Kajdacsy-Balla A, Bhargava R. Label-free characterization of cancer-activated fibroblasts using infrared spectroscopic imaging. Biophys J. 2011;101:1513–21. doi: 10.1016/j.bpj.2011.07.055. [DOI] [PMC free article] [PubMed] [Google Scholar]
- 116.Kumar S, Shabi TS, Goormaghtigh E. A FTIR imaging characterization of fibroblasts stimulated by various breast cancer cell lines. PLOS ONE. 2014;9:e111137. doi: 10.1371/journal.pone.0111137. [DOI] [PMC free article] [PubMed] [Google Scholar]
- 117.Wald N, Goormaghtigh E. Infrared imaging of primary melanomas reveals hints of regional and distant metastases. Analyst. 2015;140:2144–55. doi: 10.1039/c4an01831a. [DOI] [PubMed] [Google Scholar]
- 118.Baker MJ, Trevisan J, Bassan P, Bhargava R, Butler HJ, et al. Using Fourier transform IR spectroscopy to analyze biological materials. Nat Protoc. 2014;9:1771–91. doi: 10.1038/nprot.2014.110. [DOI] [PMC free article] [PubMed] [Google Scholar]
- 119.Tiwari S, Bhargava R. Extracting knowledge from chemical imaging data using computational algorithms for digital cancer diagnosis. Yale J Biol Med. 2015;88:131–43. [PMC free article] [PubMed] [Google Scholar]
- 120.Brady SP, Do MN, Bhargava R. Proceedings of the 16th International IEEE Conference on Image Processing. Piscataway, NJ: IEEE; 2009. Reconstructing FT-IR spectroscopic imaging data with a sparse prior; pp. 829–32. [Google Scholar]
- 121.Mayerich D, RB Walsh MJ, Schulmerich MV. Real-time interactive data mining for chemical imaging information: application to automated histopathology. BMC Bioinform. 2013;14:156. doi: 10.1186/1471-2105-14-156. [DOI] [PMC free article] [PubMed] [Google Scholar]
- 122.Stack EC, Wang C, Roman KA, Hoyt CC. Multiplexed immunohistochemistry, imaging, and quantitation: a review, with an assessment of Tyramide signal amplification, multispectral imaging and multiplex analysis. Methods. 2014;70:46–58. doi: 10.1016/j.ymeth.2014.08.016. [DOI] [PubMed] [Google Scholar]
- 123.Sweeney E, Ward TH, Gray N, Womack C, Jayson G, et al. Quantitative multiplexed quantum dot immunohistochemistry. Biochem Biophys Res Commun. 2008;374:181–86. doi: 10.1016/j.bbrc.2008.06.127. [DOI] [PubMed] [Google Scholar]
- 124.Teverovskiy M, Vengrenyuk Y, Tabesh A, Sapir M, Fogarasi S, et al. Proceedings of the 5th IEEE International Symposium on Biomedical Imaging: From Nano to Macro. Piscataway, NJ: IEEE; 2008. Automated localization and quantification of protein multiplexes via multispectral fluorescence imaging; pp. 300–3. [Google Scholar]
- 125.Diem M. Modern Vibrational Spectroscopy and Micro-Spectroscopy: Theory, Instrumentation and Biomedical Applications. New York: Wiley; 2015. [Google Scholar]
- 126.Hughes C, Baker MJ. Can mid-infrared biomedical spectroscopy of cells, fluids and tissue aid improvements in cancer survival? A patient paradigm Analyst. 2016;141:467–75. doi: 10.1039/c5an01858g. [DOI] [PubMed] [Google Scholar]
- 127.Keith FN, Reddy RK, Bhargava R. Development of a practical spatial-spectral analysis protocol for breast histopathology using Fourier transform infrared spectroscopic imaging. Faraday Discuss. 2016:27. doi: 10.1039/C5FD00199D. [DOI] [PMC free article] [PubMed] [Google Scholar]
- 128.Akalin A, Mu X, Kon MA, Ergin A, Remiszewski SH, et al. Corrigendum: Classification of malignant and benign tumors of the lung by infrared spectral histopathology (SHP) Lab Investig. 2015;95:697. doi: 10.1038/labinvest.2015.55. [DOI] [PubMed] [Google Scholar]
- 129.Kwak JT, Kajdacsy-Balla A, Macias V, Walsh M, Sinha S, Bhargava R. Improving prediction of prostate cancer recurrence using chemical imaging. Sci Rep. 2015;5:8758. doi: 10.1038/srep08758. [DOI] [PMC free article] [PubMed] [Google Scholar]
- 130.Beleites C, Salzer R. Assessing and improving the stability of chemometric models in small sample size situations. Anal Bioanal Chem. 2008;390:1261–71. doi: 10.1007/s00216-007-1818-6. [DOI] [PubMed] [Google Scholar]
- 131.Bhargava R. Towards a practical Fourier transform infrared chemical imaging protocol for cancer histopathology. Anal Bioanal Chem. 2007;389:1155–69. doi: 10.1007/s00216-007-1511-9. [DOI] [PubMed] [Google Scholar]
- 132.Fernandez DC, Bhargava R, Hewitt SM, Levin IW. Infrared spectroscopic imaging for histopathologic recognition. Nat Biotechnol. 2005;23:469–74. doi: 10.1038/nbt1080. [DOI] [PubMed] [Google Scholar]
- 133.Petibois C, Déléris G. Chemical mapping of tumor progression by FT-IR imaging: towards molecular histopathology. Trends Biotechnol. 2006;24:455–62. doi: 10.1016/j.tibtech.2006.08.005. [DOI] [PubMed] [Google Scholar]
- 134.Kumar S, Desmedt C, Larsimont D, Sotiriou C, Goormaghtigh E. Change in the microenvironment of breast cancer studied by FTIR imaging. Analyst. 2013;138:4058–65. doi: 10.1039/c3an00241a. [DOI] [PubMed] [Google Scholar]
- 135.Travo A, Piot O, Wolthuis R, Gobinet C, Manfait M, et al. IR spectral imaging of secreted mucus: a promising new tool for the histopathological recognition of human colonic adenocarcinomas. Histopathology. 2010;56:921–31. doi: 10.1111/j.1365-2559.2010.03563.x. [DOI] [PubMed] [Google Scholar]
- 136.Hughes C, Iqbal-Wahid J, Brown M, Shanks JH, Eustace A, et al. FTIR microspectroscopy of selected rare diverse sub-variants of carcinoma of the urinary bladder. J Biophotonics. 2013;6:73–87. doi: 10.1002/jbio.201200126. [DOI] [PubMed] [Google Scholar]
- 137.Kong R, Reddy RK, Bhargava R. Characterization of tumor progression in engineered tissue using infrared spectroscopic imaging. Analyst. 2010;135:1569–78. doi: 10.1039/c0an00112k. [DOI] [PMC free article] [PubMed] [Google Scholar]
- 138.Kumar V, Abbas AK, Fausto N, Aster JC. Robbins and Cotran Pathologic Basis of Disease, Professional Edition. 8 Philadelphia: Saunders: Elsevier; 2014. [Google Scholar]
- 139.Bratthauer GL, Moinfar F, Stamatakos MD, Mezzetti TP, Shekitka KM, et al. Combined E-cadherin and high molecular weight cytokeratin immunoprofile differentiates lobular, ductal, and hybrid mammary intraepithelial neoplasias. Hum Pathol. 2002;33:620–27. doi: 10.1053/hupa.2002.124789. [DOI] [PubMed] [Google Scholar]
- 140.Mayerich D, Walsh MJ, Kadjacsy-Balla A, Ray PS, Hewitt SM, Bhargava R. Stain-less staining for computed histopathology. Technology. 2015;3:27–31. doi: 10.1142/S2339547815200010. [DOI] [PMC free article] [PubMed] [Google Scholar]
- 141.Boutros PC, Fraser M, Harding NJ, de Borja R, Trudel D, et al. Spatial genomic heterogeneity within localized, multifocal prostate cancer. Nat Genet. 2015;47:736–45. doi: 10.1038/ng.3315. [DOI] [PubMed] [Google Scholar]
- 142.Gallee MPW, Ten Kate FJW, Mulder PGH, Blom JHM, Van der Heul RO. Histological grading of prostatic carcinoma in prostatectomy specimens. Comparison of prognostic accuracy of five grading systems Br J Urol. 1990;65:368–75. doi: 10.1111/j.1464-410x.1990.tb14758.x. [DOI] [PubMed] [Google Scholar]
- 143.Albertsen PC. Predicting survival for men with clinically localized prostate cancer: What do we need in contemporary practice? Cancer. 2008;112:1–3. doi: 10.1002/cncr.23107. [DOI] [PubMed] [Google Scholar]
- 144.Albertsen PC. Treatment of localized prostate cancer: When is active surveillance appropriate? Nat Rev Clin Oncol. 2010;7:394–400. doi: 10.1038/nrclinonc.2010.63. [DOI] [PubMed] [Google Scholar]
- 145.Albertsen PC, Hanley JA, Fine J. 20-year outcomes following conservative management of clinically localized prostate cancer. JAMA. 2005;293:2095–101. doi: 10.1001/jama.293.17.2095. [DOI] [PubMed] [Google Scholar]
- 146.Albertsen PC, Hanley JA, Penson DF, Barrows G, Fine J. 13-year outcomes following treatment for clinically localized prostate cancer in a population based cohort. J Urol. 2007;177:932–36. doi: 10.1016/j.juro.2006.10.051. [DOI] [PubMed] [Google Scholar]
- 147.Epstein JI. An update of the Gleason grading system. J Urol. 2010;183:433–40. doi: 10.1016/j.juro.2009.10.046. [DOI] [PubMed] [Google Scholar]
- 148.Fine SW, Epstein JI. A contemporary study correlating prostate needle biopsy and radical prostatectomy Gleason score. J Urol. 2008;179:1335–38. doi: 10.1016/j.juro.2007.11.057. [DOI] [PubMed] [Google Scholar]
- 149.Singanamalli A, Wang H, Lee G, Shih N, Ziober A, et al. Supervised multi-view canonical correlation analysis: fused multimodal prediction of disease prognosis. Proc SPIE. 2014;9038:903805. [Google Scholar]
- 150.Viswanath S, Madabhushi A. Consensus embedding: theory, algorithms and application to segmentation and classification of biomedical data. BMC Bioinform. 2012;13:26. doi: 10.1186/1471-2105-13-26. [DOI] [PMC free article] [PubMed] [Google Scholar]
- 151.Golugula A, Lee G, Master SR, Feldman MD, Tomaszewski JE, et al. Supervised regularized canonical correlation analysis: integrating histologic and proteomic measurements for predicting biochemical recurrence following prostate surgery. BMC Bioinform. 2011;12:483. doi: 10.1186/1471-2105-12-483. [DOI] [PMC free article] [PubMed] [Google Scholar]
- 152.Lee G, Singanamalli A, Wang H, Feldman M, Master S, et al. Supervised multi-view canonical correlation analysis (SMVCCA): integrating histologic and proteomic features for predicting recurrent prostate cancer. IEEE Trans Med Imaging. 2014;34:284–97. doi: 10.1109/TMI.2014.2355175. [DOI] [PubMed] [Google Scholar]
- 153.Tiwari P, Kurhanewicz J, Madabhushi A. Multi-kernel graph embedding for detection, Gleason grading of prostate cancer via MRI/MRS. Med Image Anal. 2013;17:219–35. doi: 10.1016/j.media.2012.10.004. [DOI] [PMC free article] [PubMed] [Google Scholar]
- 154.Chang H, Han J, Borowsky A, Loss L, Gray JW, et al. Invariant delineation of nuclear architecture in glioblastoma multiforme for clinical and molecular association. IEEE Trans Med Imaging. 2013;32:670–82. doi: 10.1109/TMI.2012.2231420. [DOI] [PMC free article] [PubMed] [Google Scholar]
- 155.Großerueschkamp F, Kallenbach-Thieltges A, Behrens T, Brüning T, Altmayer M, et al. Marker-free automated histopathological annotation of lung tumour subtypes by FTIR imaging. Analyst. 2015;140:2114–20. doi: 10.1039/c4an01978d. [DOI] [PubMed] [Google Scholar]
- 156.Kallenbach-Thieltges A, Großerüschkamp F, Mosig A, Diem M, Tannapfel A, Gerwert K. Immunohistochemistry, histopathology and infrared spectral histopathology of colon cancer tissue sections. J Biophotonics. 2013;6:88–100. doi: 10.1002/jbio.201200132. [DOI] [PubMed] [Google Scholar]
- 157.Gawlik A, Lee G, Whitney J, Epstein J, Veltri R, Madabhushi A. Computer extracted nuclear features from Feulgen and H&E images predict prostate cancer outcomes. Presemted at Annu Meet Biomed Eng Soc, Tampa, Oct. 2015:7–10. [Google Scholar]
- 158.Food Drug US Admin. Draft rep. US Food Drug Admin.; Rockville, MD: 2015. Draft guidance for industry and Food and Drug Administration staff: technical performance assessment of digital pathology whole slide imaging devices. [Google Scholar]
- 159.Bellis M, Metias S, Naugler C, Pollett A, Jothy S, Yousef GM. Digital pathology: attitudes and practices in the Canadian pathology community. J Pathol Inform. 2013;4:3. doi: 10.4103/2153-3539.108540. [DOI] [PMC free article] [PubMed] [Google Scholar]
- 160.Webster JD, Dunstan RW. Whole-slide imaging and automated image analysis: considerations and opportunities in the practice of pathology. Vet Pathol. 2014;51:211–23. doi: 10.1177/0300985813503570. [DOI] [PubMed] [Google Scholar]
- 161.Ergin A, Großerüschkamp F, Theisen O, Gerwert K, Remiszewski S, et al. A method for the comparison of multi-platform spectral histopathology (SHP) data sets. Analyst. 2015;140:2465–72. doi: 10.1039/c4an01879f. [DOI] [PubMed] [Google Scholar]
- 162.Steiner G, Kirsch M. Optical spectroscopic methods for intraoperative diagnosis. Anal Bioanal Chem. 2014;406:21–25. doi: 10.1007/s00216-013-7401-4. [DOI] [PubMed] [Google Scholar]