

ABSTRACT
Metformin is one of the most widely used therapeutics for type 2 diabetes mellitus and also has anticancer and antiaging properties. However, it is known to induce metformin-associated lactic acidosis (MALA), a severe medical condition with poor prognosis, especially in individuals with renal dysfunction. Inhibition of prolyl hydroxylase (PHD) is known to activate the transcription factor hypoxia-inducible factor (HIF) that increases lactate efflux as a result of enhanced glycolysis, but it also enhances gluconeogenesis from lactate in the liver that contributes to reducing circulating lactate levels. Here, we investigated the outcome of pharmaceutical inhibition of PHD in mice with MALA induced through the administration of metformin per os and an intraperitoneal injection of lactic acid. We found that the PHD inhibitors significantly increased the expression levels of genes involved in gluconeogenesis in the liver and the kidney and significantly improved the survival of mice with MALA. Furthermore, the PHD inhibitor also improved the rate of survival of MALA induced in mice with chronic kidney disease (CKD). Thus, PHD represents a new therapeutic target for MALA, which is a critical complication of metformin therapy.
KEYWORDS: CKD, Cori cycle, HIF, MALA, PHD, gluconeogenesis, hypoxia, lactic acidosis, metformin, prolyl hydroxylase
INTRODUCTION
The hypoxic response is mainly regulated by the heterodimeric transcription factor hypoxia-inducible factor (HIF) composed of a stable β-subunit (HIFβ/ARNT) and labile α-subunit (HIFα). The protein expression level of HIFα is negatively regulated by prolyl hydroxylase PHD1 to PHD3 (prolyl hydroxylase domain-containing proteins 1 to 3). Under normoxic conditions where oxygen is available, PHDs hydroxylate proline residues on HIFα targeted for von Hippel-Lindau (VHL) E3 ubiquitin ligase-dependent proteasomal degradation. On the other hand, enzymatic activities of PHDs are inhibited under the hypoxic conditions where available oxygen becomes limited as PHDs are 2-oxoglutarate-dependent dioxygenases which require molecular oxygen for their enzymatic activities. Thus, HIFα escapes from prolyl hydroxylation-dependent protein degradation, accumulates, binds to HIFβ/ARNT, and activates transcription of hypoxic mRNA, including that of Epo (erythropoietin [EPO] gene) or Vegf (vascular endothelial growth factor gene) under hypoxia (1). We previously reported that liver-specific inactivation of Phd2, the gene for the dominant prolyl hydroxylase for HIFα, improved the survival rate of mice with lactic acidosis by activating hepatic gluconeogenesis from circulating lactate, which contributed to reducing the blood lactate level (2).
Metformin is a biguanide drug that reduces blood glucose levels by suppressing hepatic gluconeogenesis. However, it is also known to induce metformin-associated lactic acidosis (MALA) (3), which is particularly prevalent in patients with chronic kidney disease (CKD) due to a decrease in urinary excretion of lactate. MALA has a high mortality rate of up to 50%, but only early diagnosis and renal replacement therapy are currently the treatments of choice (4). Therefore, an established treatment is required for overcoming such circumstances, and we hypothesized that PHD inhibitors could be used to improve the survival rate of mice with MALA.
In the present study, we investigated the effects of PHD inhibitors on mice with MALA. We found that treatment with PHD inhibitors per os improved the survival rate of mice with MALA and also acted as an agent for rescue from MALA in mice with CKD (CKD mice), which represents a more clinical model. These findings indicate that PHD represents a new therapeutic target for MALA.
RESULTS
Development of a mouse model of MALA.
To test the effect of metformin, 8-week-old C57BL/6J wild-type male mice were administered metformin per os, followed by an intraperitoneal (i.p.) injection of lactic acid. Metformin administration alone did not increase blood lactate levels, but mice administered metformin followed by an i.p. injection of lactic acid exhibited life-threatening MALA, indicating that metformin exacerbates hyperlactatemia when blood lactate levels exceed the baseline clearance levels of lactate (Fig. 1).
FIG 1.
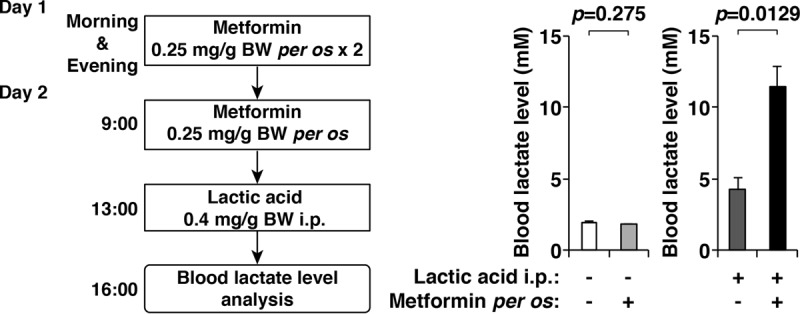
Development of a mouse model of metformin-associated lactic acidosis (MALA). Blood lactate levels in mice with or without the administration of metformin per os and an intraperitoneal (i.p.) injection of lactic acid (n = 3 per treatment group) were determined (right). A detailed timetable of the experiment is also shown (left). Note that metformin exacerbated the hyperlactatemia that was induced by an i.p. injection of lactic acid. Error bars indicate 1 standard error of the mean. BW, body weight.
Effects of PHD inhibitors on the survival of mice with MALA.
To investigate whether pharmacological inhibition of PHDs ameliorates MALA, first we tested the effects of the PHD inhibitors REC2923 and FG-4592, 2-oxoglutarate analogues, that are supposed to activate HIF. We detected the upregulation of HIF target genes in the livers of C57BL/6J wild-type male mice treated with REC2923 and FG-4592 per os, which indicated that a hypoxic response was induced by the treatment with these PHD inhibitors in the liver (Fig. 2A). We also detected the upregulation of HIF target genes in the kidneys following treatment with REC2923 but not in the muscles or the hearts (Fig. 2B), indicating that REC2923 preferentially inhibits PHDs in the liver and kidney. To see the effect of PHD inhibitor on hematopoiesis, we treated mice with either the vehicle or REC2923 and measured hematocrit levels before and after the treatment. There was no difference in hematocrit levels between the two groups (Fig. 2C), indicating that a single-dose treatment of PHD inhibitor upregulates erythropoietin in both the liver and the kidney (Fig. 2A and B) but does not affect hematocrit levels within 10 days after the treatment.
FIG 2.

Tissue-dependent effects of prolyl hydroxylase (PHD) inhibitors administered per os in wild-type mice. (A) Real-time RT-PCR analysis of the direct hypoxia-inducible factor (HIF) target genes, Pdk1, Pgk1, Slc7a5 (L-type amino acid transporter 1 [LAT1]), and Epo, in the livers of mice after 4 h of administration per os of the vehicle (n = 3; 0.5% methyl cellulose), REC2923 (n = 3; 30 mg/kg body weight), or FG-4592 (n = 3; 50 mg/kg body weight). Error bars indicate 1 standard error of the mean. (B) Real-time RT-PCR analysis of the direct HIF target genes (Pdk1, Pgk1, and Slc7a5) in the kidneys, muscles, and hearts of C57BL/6J male mice after 4 h of administration per os of the vehicle (n = 3; 0.5% methyl cellulose) or REC2923 (n = 3; 30 mg/kg body weight). Epo was also analyzed in the kidneys. Error bars indicate 1 standard error of the mean. (C) Hematocrit levels of mice treated with either the vehicle (n = 5; 0.5% methyl cellulose) or REC2923 (n = 5; 30 mg/kg body weight) on day 0 (control), day 1 (after 4 h of treatment), day 5, and day 10 (left). The values of the area under the concentration-time curve (AUC) for each group were compared using an unpaired Student t test. Error bars indicate 1 standard error of the mean.
We then pretreated mice that had been administered metformin with the vehicle alone, REC2923, or FG-4592 4 h prior to an i.p. injection of lactic acid (Fig. 3, left). We found that mice that had been pretreated with the PHD inhibitors exhibited significantly higher survival rates than the vehicle-treated mice (Fig. 3, right), indicating that PHD inhibition can rescue mice with MALA.
FIG 3.

Treatment model of MALA with PHD inhibitors. A schematic of the treatment model of MALA with PHD inhibitors and the survival analysis are shown. Mice were administered metformin (0.25 mg/g body weight) with the vehicle (n = 18; 0.5% methyl cellulose), REC2923 (n = 21; 30 mg/kg body weight), or FG-4592 (n = 21; 50 mg/kg body weight) per os 4 h prior to an i.p. injection of lactic acid (0.4 mg/g body weight).
Development of a mouse model of CKD.
Healthy individuals rarely develop MALA, but individuals with renal dysfunction, such as CKD patients, are at a high risk (3) as lactate in the bloodstream is excreted mainly in the urine. Therefore, to establish a mouse model that mimics conditions in CKD patients, 7-week-old C57BL/6J wild-type male mice were fed a 0.2% adenine-containing diet for 6 weeks (5). Mice that were fed this diet had significantly higher serum creatinine levels than mice that were fed a normal diet (Fig. 4A). Matrix-assisted laser desorption ionization–imaging mass spectrometry (MALDI-IMS) analysis revealed the crystals of 2,8-dihydroxyadenine deposited in the kidneys of mice fed an adenine-containing diet (Fig. 4B). Tubular dilation, dilated Bowman's space, and interstitial inflammation were also evident in kidney sections from mice with adenine-induced CKD (Fig. 4C), indicating that they had successfully developed CKD. The blood lactate levels in these CKD mice significantly increased to a lethal level following the daily administration of metformin but exhibited no change following the administration of the vehicle, indicating that metformin administration in CKD mice successfully phenocopies MALA (Fig. 4D).
FIG 4.
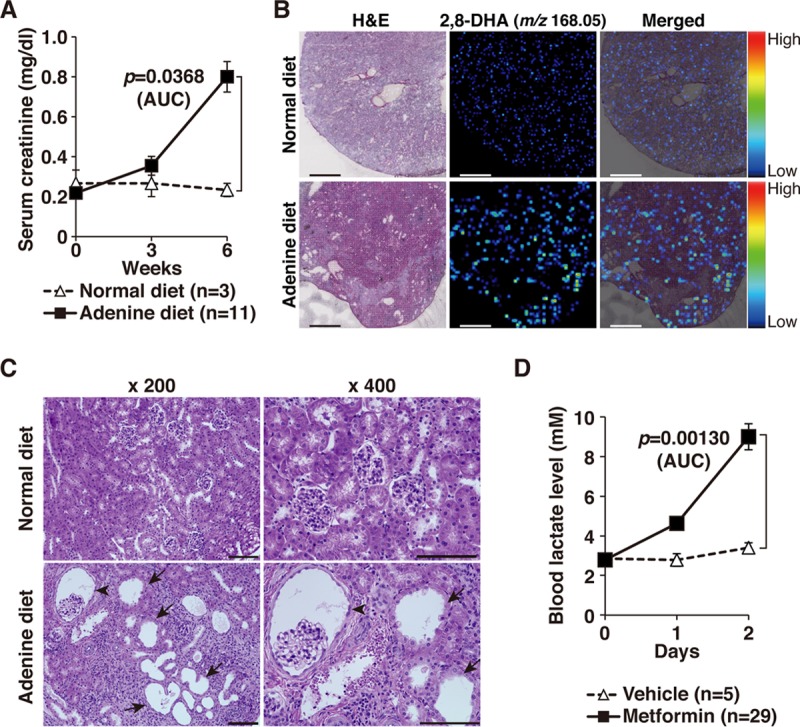
Generation of a mouse model of MALA in adenine-induced chronic kidney disease (CKD). (A) Serum creatinine levels in mice that were fed a normal diet (n = 3) or a 0.2% adenine-containing diet (n = 11) for the indicated time periods. The values for the area under the concentration-time curve (AUC) for each group were compared using an unpaired Student t test. Error bars indicate 1 standard error of the mean. (B) Imaging mass spectrometry (MALDI-IMS) analysis of 2,8-dihydroxy adenine (2,8-DHA; m/z 168.05) in the kidneys of the mice that were fed a normal or 0.2% adenine-containing diet for 6 weeks. Note that crystals of 2,8-dihydroxy adenine were detected in mice receiving the adenine-containing diet. Scale bar, 500 μm. (C) Histological analysis of the kidneys in the mice that were fed a normal diet or a 0.2% adenine-containing diet for 6 weeks. Representative data from three mice per treatment group are shown. Tubular dilation (arrows) and dilated Bowman's space (arrowhead) are observed in mice with adenine-induced CKD. Scale bar, 100 μm. (D) The CKD mice were administered a vehicle (n = 5; 0.5% methyl cellulose) or metformin (n = 29; 0.5 mg/g body weight) per os, and lactate levels were measured after 4 h. The experiment was repeated the following day. The values of the area under the concentration-time curve of each group were compared using an unpaired Student t test. Error bars indicate 1 standard error of the mean. H&E, hematoxylin and eosin.
Effects of a PHD inhibitor on MALA in CKD mice.
To assess whether treatment with the PHD inhibitor could improve the survival of MALA by CKD mice, CKD mice were administered metformin in the morning, and their lactate levels were checked after 4 h. Those with blood lactate levels exceeding 8 mmol/liter were then treated with either the vehicle or the PHD inhibitor REC2923 (Fig. 5A, left). For mice whose lactate levels did not meet this criterion, the experiment was repeated the following day. There was no significant difference in the amount of administered metformin between the two groups (vehicle, 1.313 ± 0.458 mg/g body weight; REC2923, 1.364 ± 0.393 mg/g body weight; P = 0.797). Mice that were treated with REC2923 exhibited significantly higher survival rates than the vehicle-treated mice, indicating that the PHD inhibitor may act as a rescue agent in the setting of lactic acidosis in metformin-prescribed patients (Fig. 5A, right). To see whether the improved survival was a consequence of lower lactate levels, blood lactate levels were measured after 6 h of treatment with the vehicle or REC2923. Although the difference did not reach significance, there was a tendency toward lower blood lactate levels in REC2923-treated mice (Fig. 5B). We detected the upregulation of the erythropoietin gene (Epo) in the kidneys of CKD mice after 6 h of treatment with REC2923 (Fig. 5C, left), but this did not lead to a change in the hematocrit level (Fig. 5C, right), showing that blood lactate levels were not influenced by the red blood cell production at this time point. To check the influence of REC2923 on renal function, serum creatinine and blood urea nitrogen (BUN) were measured after 6 h of treatment with the vehicle or REC2923, but there was no difference between the two treatment groups (Fig. 5D), showing that REC2923 does not have the ability to improve renal function and increase urinary lactate excretion. We have also checked whether the PHD inhibitor had any effects on tissue inflammation, as reported previously, and thus expression levels of genes related to inflammation were analyzed in the kidneys of CKD mice. Interleukin-6 (IL-6) was significantly downregulated in the kidneys of PHD inhibitor-treated mice (Fig. 5E), suggesting that the PHD inhibitor contributed, at least in part, to the improved rate of survival of MALA by CKD mice by ameliorating inflammation.
FIG 5.
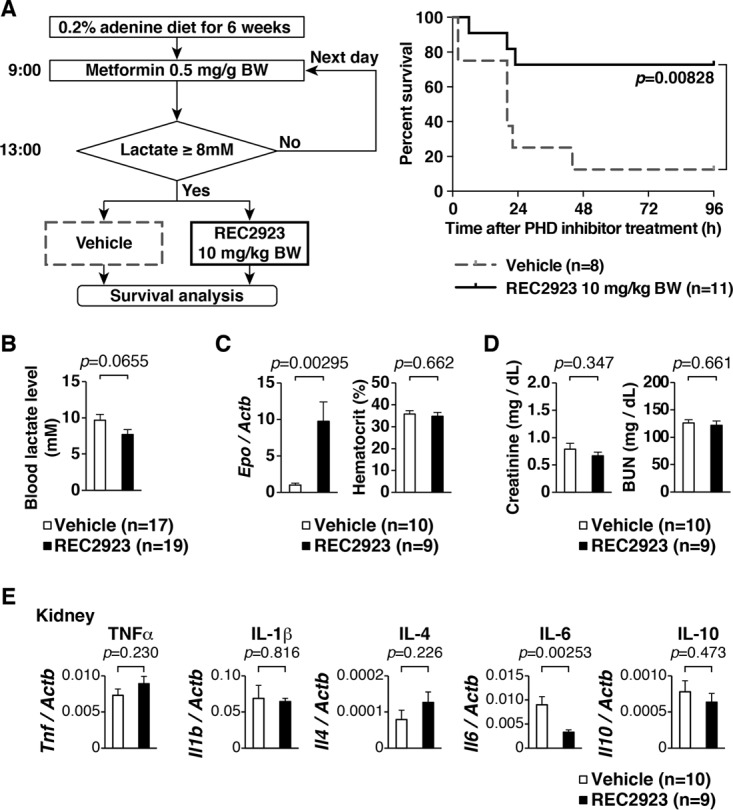
Treatment model of MALA in CKD mice treated with a PHD inhibitor. (A) Schematic of the treatment of MALA in CKD mice and survival analysis of MALA in CKD mice that were treated with the vehicle or the PHD inhibitor REC2923. Mice were administered metformin (0.5 mg/g body weight) per os in the morning, and those with blood lactate levels of >8 mmol/liter after 4 h of metformin administration were then treated with either the vehicle (n = 8. 0.5% methyl cellulose) or the PHD inhibitor REC2923 (n = 11; 10 mg/kg body weight) per os. (B) Blood lactate levels of CKD mice after 6 h of treatment with the vehicle (n = 10; 0.5% methyl cellulose) or REC2923 (n = 9; 10 mg/kg body weight). Error bars indicate 1 standard error of the mean. (C) Real-time RT-PCR analysis of the direct HIF target gene Epo in the kidneys of CKD mice and hematocrit levels of CKD mice after 6 h of treatment with the vehicle or REC2923. Error bars indicate 1 standard error of the mean. (D) Serum creatinine and BUN levels in the CKD mice after 6 h of treatment with the vehicle or REC2923. Error bars indicate 1 standard error of the mean. (E) Real-time RT-PCR analysis of inflammatory mRNAs of Tnf, Il1b, Il4, Il6, and Il10 in CKD mice treated with the vehicle (n = 10) or REC2923 (n = 9). Error bars indicate 1 standard error of the mean. TNF-α, tumor necrosis factor alpha.
Upregulation of the mRNAs involved in gluconeogenesis in both the livers and kidneys of PHD inhibitor-treated mice.
To elucidate the molecular mechanism of how the PHD inhibitors rescued mice with MALA in this study, expression levels of genes related to gluconeogenesis were analyzed in livers of REC2923-treated mice. Lactate dehydrogenase A (LdhA; encoded by Ldha) and monocarboxylate transporter 1 (MCT1; encoded by Slc16a1), which are involved in gluconeogenesis from lactate, were upregulated in the livers of REC2923-treated mice (Fig. 6A). To see whether the rescue effect of PHD inhibitors in MALA depends on the suppression of PHD2 (a dominant isoform of PHDs in vivo) in the liver as shown in our previous report (2), Phd2 liver-specific knockout (Phd2-LKO) mice were administered metformin followed by an i.p. injection of lactic acid, and a lactate tolerance test was performed. Interestingly, Phd2-LKO mice did not show lactate tolerance in MALA (Fig. 6B), suggesting that the activation of the hepatic arm of the Cori cycle does not occur by inhibiting Phd2 alone in the liver of mice with MALA. We then analyzed expression of genes related to gluconeogenesis in the kidneys of REC2923-treated mice (Fig. 6C). LdhA (Ldha), MCT1 (Slc16a1), and phosphoenolpyruvate carboxykinase (PEPCK; encoded by Pck1) were upregulated in the kidneys of REC2923-treated mice, suggesting the possibility that the PHD inhibitors rescued mice with MALA by upregulating gluconeogenic mRNAs, in part, in both the liver and the kidney in this model.
FIG 6.
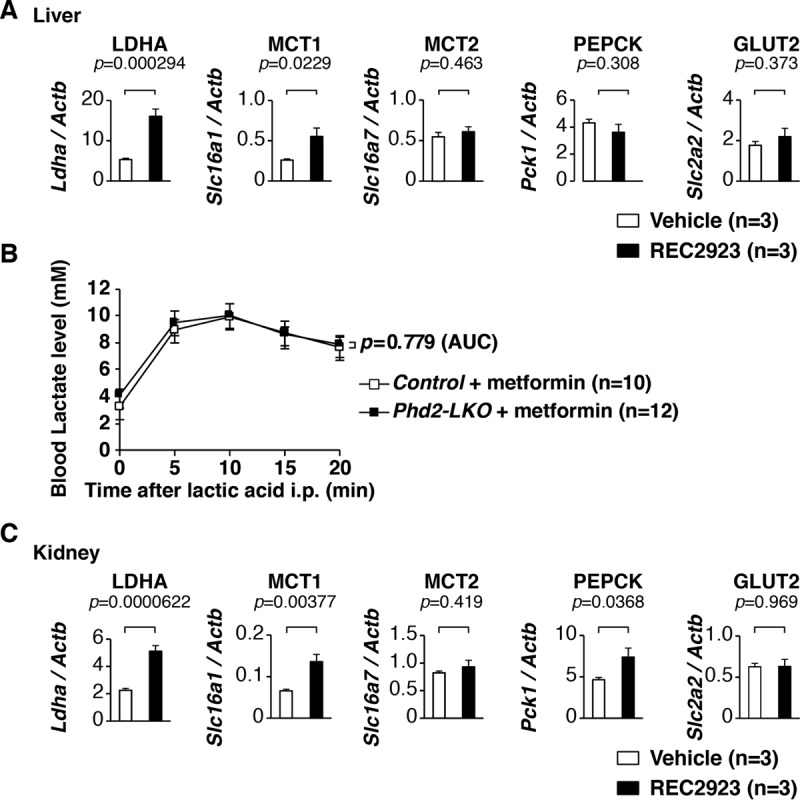
Upregulation of the mRNAs involved in gluconeogenesis in both the livers and kidneys of PHD inhibitor-treated mice. (A) Real-time RT-PCR analysis of the genes involved in gluconeogenesis, Ldha, Slc16a1 (monocarboxylate transporter 1 [MCT1] gene), Slc16a7 (MCT2 gene), Pck1, and Slc2a2 (glucose transporter 2 [GLUT2] gene), in the livers of C57BL/6J male mice after 4 h of administration per os of the vehicle (0.5% methyl cellulose; n = 3) or REC2923 (30 mg/kg body weight; n = 3). Error bars indicate 1 standard error of the mean. (B) Lactate tolerance test. Control (n = 10) and Phd2 liver-specific knockout (Phd2-LKO; n = 12) male mice were administered 0.25 mg/g body weight metformin dissolved in distilled water in the morning and evening of day 1 and in the morning of day 2 per os. After 4 h, the mice then received an i.p. injection of 0.4 mg/g body weight lactic acid, and blood lactate levels were measured at the indicated times. The values of the area under the concentration-time curve of each group were compared using an unpaired Student t test. Error bars indicate 1 standard error of the mean. (C) Real-time RT-PCR analysis of the genes involved in gluconeogenesis, Ldha, Slc16a1 (monocarboxylate transporter 1 [MCTs]), Slc16a7 (MCT2), Pck1, and Slc2a2 (glucose transporter 2 [GLUT2]), in the livers of C57BL/6J male mice after 4 h of administration per os of the vehicle (n = 3; 0.5% methyl cellulose) or REC2923 (n = 3; 30 mg/kg body weight). Error bars indicate 1 standard error of the mean.
DISCUSSION
Metformin is currently prescribed to over 120 million people worldwide (7), and the number of people with impaired glucose tolerance is expected to increase to 420 million by 2025 (8). However, despite being one of the most widely used drugs for the treatment of type 2 diabetes mellitus, its mechanism of action is still being debated (9) because it helps to lower blood glucose levels via multiple mechanisms. Metformin inhibits mitochondrial complex I (10), reducing ATP generation and increasing the AMP/ATP ratio, which leads to the activation of AMP-activated protein kinase (AMPK); this then suppresses gluconeogenesis by downregulating gluconeogenic genes such as the PEPCK or glucose-6-phosphatase gene (11–14). It has also been reported that metformin suppresses gluconeogenesis by inhibiting mitochondrial glycerol-3-phosphate dehydrogenase (15), improves the uptake of glucose into the skeletal muscles (16), and reduces glucose absorption in the small intestine (17).
Metformin has also been shown to suppress cancer cell growth through the inhibition of mitochondrial complex I or the activation of AMPK (13, 18), and its use has been associated with a decreased incidence of several types of cancer (19–23). In addition, a clinical trial named “Targeting Aging with Metformin” is currently scheduled (24), and if this trial is successful, we will see metformin being approved as an antiaging drug by the U.S. Food and Drug Administration (FDA). This would substantially increase the number of individuals prescribed metformin across the world, even in developing countries, as there will be no financial barriers to mass-producing this drug, which is more than 60 years old.
However, metformin has also been associated with the development of critical lactic acidosis (3, 25, 26). The inhibition of mitochondrial complex I, which converts NADH to its oxidized form (NAD+), leads to decreased NAD+ production (13, 18), and the inhibition of mitochondrial glycerol-3-phosphate dehydrogenase, which converts glycerol 3-phosphate (G3P) to dihydroxyacetone phosphate (DHAP) using flavin adenine dinucleotide (FAD) as a cofactor, leads to decreased DHAP production and the accumulation of G3P in the mitochondria (15). The last results in the accumulation of cytosolic G3P, which halts the glycerophosphate shuttle and leads to the accumulation of cytosolic NADH, inhibiting the conversion of lactate to pyruvate by lactate dehydrogenase (15). Thus, lactate accumulates in the hepatocytes, which suppresses its absorption from the bloodstream into the liver.
The overall reported incidence of MALA is approximately 3 to 10 per 100,000 person-years (3); however, the FDA has recently announced that metformin can be used safely in patients with mild impairment in kidney function and in some patients with moderate impairment in kidney function and required a change in labeling in accordance with the expansion of metformin's use in patients with reduced kidney function (https://www.fda.gov/Drugs/DrugSafety/ucm493244.htm). Therefore, metformin will also be used not only to treat diabetes and cancer but also for cancer prevention and antiaging purposes in the future; thus, we may see a concurrent increase in the number of patients with MALA. MALA has a high mortality rate of up to 50% (27, 28), so an established treatment is required.
Although our in vivo studies previously detected the upregulation of the gluconeogenic mRNAs MCT2 (Slc16a7), PEPCK (Pck1), and glucose transporter 2 (GLUT2; Slc2a2) in the livers of Phd2-LKO mice (2), the upregulation of these mRNAs were not identified through either in vitro experiments using primary hepatocytes (data not shown) or in vivo experiments following the treatment with PHD inhibitors in the present study. This was probably due to a previous study disrupting the Phd2 gene alone, while the present study led to the pharmacological inhibition of not only PHD2 but also other PHD isoforms or other 2-oxoglutarate-dependent dioxygenases as off-target effects.
To evaluate whether the rescue effect of PHD inhibitors in mice with MALA depends on the suppression of PHD2 in the liver, as shown in our previous report (2), Phd2-LKO mice were administered metformin followed by an i.p. injection of lactic acid, and a lactate tolerance test was performed. Interestingly, Phd2-LKO mice did not show lactate tolerance in MALA (Fig. 6B), suggesting that the activation of the hepatic arm of the Cori cycle does not occur by inhibiting Phd2 alone in the liver of mice with MALA. Metformin activates AMPK indirectly by inhibiting mitochondrial complex I, thus inhibiting mammalian target of rapamycin complex 1 (mTORC1) (29), which positively regulates HIF1α; so metformin administration reduces hypoxia-induced HIF1α stabilization and diminishes expression of HIF target genes (7). HIF activation in the liver due to Phd2 disruption in Phd2-LKO mice may have been diminished by the anti-HIF1α effect of metformin; so the activation of the hepatic arm of the Cori cycle in Phd2-LKO mice, as previously reported, did not occur in Phd2-LKO mice with MALA, and hyperlactatemia was not ameliorated.
PHD inhibitors administered per os preferentially target the liver and the kidney (Fig. 2A and B), suggesting that the kidney, which contributes to approximately 20% of gluconeogenesis (30), could be another target of a PHD inhibitor administered per os in the setting of MALA treatment. We found that Pck1, which codes for PEPCK, one of the rate-limiting enzymes of gluconeogenesis, was upregulated in the kidneys of REC2923-treated mice, suggesting that gluconeogenesis was enhanced in the kidney, in addition to the liver, of the mice with MALA.
A previous study reported that mice with adenine-induced CKD displayed severe anemia due to decreased renal EPO production in the kidney, which activated hepatic EPO production (31). It is possible that locally produced EPO in the liver affected the function of the hepatocytes, including gluconeogenesis, as EPO has organ-protective effects under certain medical conditions, including ischemia in hearts, brains, and kidneys (32). In our mouse model of MALA in CKD, Epo was induced in the kidney several hours after the PHD inhibitor treatment. However, there was no change in kidney function as a result of treatment with a PHD inhibitor (Fig. 5D), which indicates that the improved survival was not a consequence of ameliorated renal function due to increased EPO production. EPO enhances red blood cell (RBC) production, which may lead to an increase in lactate excretion from RBCs, but the hematocrit levels after the treatment with PHD inhibitor did not increase during the short period of our experiments (Fig. 2C and 5C), indicating that the EPO-RBC pathway also did not affect the survival of our mouse model of MALA.
Another possibility is that mice with MALA were rescued by a PHD inhibitor via an altered immune response (33). In our mouse model of MALA in CKD, the proinflammatory cytokine IL-6 was significantly downregulated in the kidneys of PHD inhibitor-treated mice, which might have had an organ-protective effect and contributed to better survival (Fig. 5E).
Hemodynamic studies using a pressure-volume conductance catheter (34) revealed that the PHD inhibitor did not ameliorate the cardiac dysfunction in mice with MALA (Fig. 3 and data not shown), indicating that the rescue effect of a PHD inhibitor on MALA is independent of cardiac function.
It is also possible that the PHD inhibitor alters the cellular uptake or excretion of metformin by organic cation transporters (OCTs) or multidrug and toxin extrusion (MATE) transporters as the off-target effects (35). Another study recently reported that systemic or skeletal muscle-specific Phd2 inactivation protects mice against myocardial ischemia-reperfusion injury independent of the HIF pathway (36), and so this unknown HIF-independent pathway may also have been involved here. Further investigation is required to fully understand the mechanism of how PHD inhibition rescues MALA, including HIF dependency. For the findings to be applied in the clinic in the future, we need to be aware of the complications of the high doses of oral PHD inhibitors required to ameliorate lactic acidosis.
PHD inhibitors may also be used to treat lactic acidosis induced by other clinical conditions that involve shock, severe respiratory disease, or mitochondrial disease. In septic shock patients, increased blood lactate levels have been associated with a 10-fold increase in the mortality rate compared with the rate with normal lactate levels, and the increased lactate levels have been shown to be a better predictor of morbidity and mortality than physiological triage criteria (37). Therefore, a lactate level-guided treatment with PHD inhibitors may contribute to the improvement of sepsis patients with lactic acidosis.
In summary, we have found that PHD inhibitors significantly improved the survival of mice with MALA, and, furthermore, a PHD inhibitor also improved the rate of survival of MALA by CKD mice. Oral PHD inhibitors have been developed and are now under clinical trial for renal anemia (1). Our findings indicate that PHD could be a new therapeutic target for MALA treatment and may also be used for a variety of pathophysiological conditions.
MATERIALS AND METHODS
Mice.
All experiments were approved by the Animal Care and Utilization Committee of the Keio University School of Medicine, Tokyo, Japan (11050-2). Wild-type mice used in this study were C57BL/6J male mice aged 7 to 13 weeks, which were obtained from CLEA Japan, Inc. (Tokyo, Japan). All Phd2flox/flox mice used in this study were backcrossed to the C57BL/6J strain at least five times, as previously reported (38). The transgenic mice expressing albumin promoter-driven Cre recombinase (Alb-Cre) were also described previously (1, 39, 40). The mice were maintained on a 12:12-h light-dark cycle in a specific-pathogen-free facility and were fed ad libitum.
Development of a mouse model of MALA.
Nine-week-old wild-type C57BL/6J male mice were administered metformin (0.25 mg/g body weight) dissolved in distilled water in the morning and evening of day 1 and in the morning of day 2 per os. After 4 h, the mice were then administered an intraperitoneal (i.p.) injection of lactic acid (0.4 mg/g body weight) (252476; Sigma-Aldrich, St. Louis, MO) dissolved in 0.9% sodium chloride.
RNA isolation and real-time RT-PCR analysis.
Total RNA was isolated from the livers, kidneys, muscles, and hearts of each mouse using TRIzol reagent (15596-026; Invitrogen, Carlsbad, CA) and an RNeasy column (74104; Qiagen, Hilden, Germany). Real-time reverse transcription-PCR (RT-PCR) was performed with an AffinityScript QPCR cDNA synthesis kit (600559; Agilent Technologies, Santa Clara, CA) and Thunderbird SYBR qPCR mix (QPS-201; Toyobo, Osaka, Japan) using a real-time PCR system (model 7300; Applied Biosystems, Foster City, CA). The mRNA levels were normalized to the β-actin (Actb) level. The primer sequences are shown in Table 1.
TABLE 1.
Primer sequences for real-time reverse transcription-PCR analysis
| Gene | Primer |
|
|---|---|---|
| Direction | Sequence | |
| Ldha | Forward | 5′-ACAGTTGTTGGGGTTGGTGC-3′ |
| Reverse | 5′-CGCAGTTACACAGTAGTCTTTG-3′ | |
| Pdk1 | Forward | 5′-ACCTCGTTTATGTTTCTGCG-3′ |
| Reverse | 5′-CAACTCCTGAAGGCTTTGG-3′ | |
| Pgk1 | Forward | 5′-GATGAGGGTGGACTTCAAC-3′ |
| Reverse | 5′-TAAGGACAACGGACTTGGC-3′ | |
| Epo | Forward | 5′-CATCTGCGACAGTCGAGTTCTG-3′ |
| Reverse | 5′-CACAACCCATCGTGACATTTTC-3′ | |
| Slc7a5 | Forward | 5′-GCCCTCATCATTTTGCTCG-3′ |
| Reverse | 5′-TCAGATAGTTCCATCCTCCG-3′ | |
| Slc16a1 | Forward | 5′-TGGTTGTCTGTCTGGTTGC-3′ |
| Reverse | 5′-CAGTGGTCGCTTCTTGTAG-3′ | |
| Slc16a7 | Forward | 5′-TTCAACACCACCTCCAGTC-3′ |
| Reverse | 5′-CAGCATAATAGTCCTCCCAC-3′ | |
| Pck1 | Forward | 5′-GGAAGGACAAAGATGGCAAG-3′ |
| Reverse | 5′-TCAGGTTCAAGGCGTTTTC-3′ | |
| Slc2a2 | Forward | 5′-GTCGCCTCATTCTTTGGTG-3′ |
| Reverse | 5′-CTGATACACTTCGTCCAGC-3′ | |
| Tnf | Forward | 5′-TCCCTCTCATCAGTTCTATGG-3′ |
| Reverse | 5′-AAGAGAACCTGGGAGTAGAC-3′ | |
| Il1b | Forward | 5′-GACCTGTTCTTTGAAGTTGACG-3′ |
| Reverse | 5′-TGTTGATGTGCTGCTGCGAG-3′ | |
| Il4 | Forward | 5′-AGACTCTTTCGGGCTTTTC-3′ |
| Reverse | 5′-TGATGCTCTTTAGGCTTTCC-3′ | |
| Il6 | Forward | 5′-CCAGAGTCCTTCAGAGAGATAC-3′ |
| Reverse | 5′-ATGGTCTTGGTCCTTAGCC-3′ | |
| Il10 | Forward | 5′-GCTGGACAACATACTGCTAAC-3′ |
| Reverse | 5′-TGCTCCTTGATTTCTGGGC-3′ | |
Venous blood gas analysis.
Eight-week-old wild-type C57BL/6J male mice administered either the vehicle or REC2923 were anesthetized with isoflurane (AbbVie, Inc., Tokyo, Japan), and after 4 h, whole-blood samples were taken from the retro-orbital sinus using microhematocrit capillary tubes (22-362-566; Thermo Fisher Scientific, Inc., MA). Hematocrit and blood urea nitrogen (BUN) levels were measured using an i-STAT 1 analyzer (Abbott, IL) and EC8+ cartridge (AB-3P7925; Abbott).
Treatment of mice with MALA using a PHD inhibitor per os.
Mice diagnosed with MALA were treated with either the vehicle (n = 18; 0.5% methyl cellulose) (64625; Sigma-Aldrich), REC2923 (n = 21; 30 mg/kg body weight) (Daiichi Sankyo, Tokyo, Japan), or FG-4592 (n = 21; 50 mg/kg body weight) (15294; Cayman Chemical, MI) per os immediately after metformin administration on day 2. After 4 h, the mice were then administered an i.p. injection of lactic acid (0.4 mg/g body weight) dissolved in 0.9% sodium chloride. Kaplan-Meier survival analysis was performed.
Development of a mouse model of CKD.
Seven-week-old wild-type C57BL/6J male mice were fed either a normal CE-2 diet (CLEA Japan, Tokyo, Japan) or a 0.2% adenine-containing CE-2 diet (CLEA Japan) for 6 weeks ad libitum (5, 41). Blood lactate and serum creatinine levels were then measured at 0, 3, and 6 weeks after the start of each diet. To measure blood lactate levels, whole-blood samples (5 μl) were obtained from the tail veins, which were tested using a Lactate Pro test meter (Cycle Classic Imports, New South Wales, Australia) and Lactate Pro test strip (Cycle Classic Imports). To measure serum creatinine levels, the mice were anesthetized with isoflurane (AbbVie, Inc.), and whole-blood samples were obtained from the retro-orbital sinus using microhematocrit capillary tubes. Each sample was then collected in a 1.5-ml tube and left at room temperature for 30 min to separate the hemocytes from the serum. The serum was then transferred into a new tube and centrifuged at 20,000 × g for 5 min. This procedure was repeated twice per sample. The isolated serum (10 μl) was placed on a Fuji Dri-Chem slide CRE-PIII (14A2X10004000004; Fujifilm, Inc., Tokyo, Japan), and serum creatinine levels were measured with a Dri-Chem 7000i (Fujifilm, Inc.).
Histological analysis.
The mice fed a normal diet mice and mice with adenine-induced CKD were anesthetized with isoflurane (AbbVie, Inc.). Their kidneys were then removed and separated into upper, middle, and lower parts. The middle part of each kidney, which contained the renal pelvis, was fixed in Bouin's solution and embedded in paraffin. Thin-sliced sections were then made, which were stained with hematoxylin (hematoxylin 3G 8656; Sakura Finetek Japan, Tokyo, Japan) and eosin (eosin 8659; Sakura Finetek Japan). Photomicrographs were obtained using a BZ-9000 fluorescence microscope (Keyence, Osaka, Japan) at a magnification of ×20. Matrix-assisted laser desorption ionization–imaging mass spectrometry (MALDI-IMS) analysis of 2,8-dihydroxyadenine (m/z 168.05) in the kidneys of mice receiving a normal diet or an adenine-containing diet was performed in the positive ion mode using an atmospheric pressure MALDI–quadrupole ion trap time of flight mass spectrometer (MALDI-QIT-TOF-MS) (Shimadzu, Kyoto, Japan) as described previously (6, 42, 43).
Treatment of MALA in CKD mice using a PHD inhibitor per os.
The CKD mice, as described in “Development of a mouse model of CKD” above, were administered metformin (0.5 mg/g body weight), and blood lactate levels were then measured after 4 h. Mice with blood lactate levels of >8 mmol/liter were treated with either the vehicle (n = 8; 0.5% methyl cellulose) or REC2923 (n = 11; 10 mg/kg body weight) per os. For mice whose lactate levels did not meet this criterion, the experiment was repeated the following day. Measurement of blood lactate levels, hematocrit, serum creatinine, and BUN and isolation of kidneys for real-time RT-PCR analysis of genes related to inflammation were performed after 6 h of treatment with either the vehicle or REC2923. Kaplan-Meier survival analysis was performed.
Lactate tolerance test.
Phd2 liver-specific knockout (Phd2-LKO) male mice, 8 to 9 weeks old, were administered metformin (0.25 mg/g body weight) dissolved in distilled water in the morning and evening of day 1 and in the morning of day 2 per os. After 4 h, the mice were then administered an i.p. injection of lactic acid (0.4 mg/g body weight) dissolved in 0.9% sodium chloride. Whole-blood samples (5 μl) were obtained from the tail veins at 0, 5, 10, 15, and 20 min after the injection. The blood lactate levels were measured using a Lactate Pro test meter and Lactate Pro test strip.
Statistics.
The two treatment groups were compared using unpaired t tests. The survival rate of the mice in each treatment group was determined using a Kaplan-Meier survival analysis, and differences in survival rates were analyzed using a log rank (Mantel-Cox) test performed with Prism software (GraphPad Software, Inc., La Jolla, CA). Statistical significance was defined as a P value of <0.05.
ACKNOWLEDGMENTS
We thank the members of Grant-in-Aid for Scientific Research on Innovative Areas “Oxygen Biology: a New Criterion For Integrated Understanding of Life” (26111006) from The Ministry of Education, Culture, Sports, Science and Technology (MEXT), Japan, and the members of Keiichi I. Nakayama's laboratory for valuable feedback. The PHD inhibitor REC2923 was kindly provided by Daiichi Sankyo Co. Ltd.
Y.A.M. is supported in part by Grant-in-Aid for Scientific Research (B) (23310136 and 16H04723), Grant-in-Aid for Exploratory Research (20593966), and Grant-in-Aid for Scientific Research on Innovative Areas “Oxygen Biology: a New Criterion for Integrated Understanding of Life” (26111006) from The Ministry of Education, Culture, Sports, Science and Technology (MEXT), Japan. T.S. is supported in part by a research grant from the Mitsukoshi Health and Welfare Foundation, Japan. S.M. is supported in part by a Grant-in-Aid for Exploratory Research (20622088) and Grant-in-Aid for Scientific Research (C) (17K11060) from MEXT, Japan.
We declare that we have no conflict of interests.
REFERENCES
- 1.Minamishima YA, Kaelin WG. 2010. Reactivation of hepatic EPO synthesis in mice after PHD loss. Science 329:407–407. doi: 10.1126/science.1192811. [DOI] [PMC free article] [PubMed] [Google Scholar]
- 2.Suhara T, Hishiki T, Kasahara M, Hayakawa N, Oyaizu T, Nakanishi T, Kubo A, Morisaki H, Kaelin WG Jr, Suematsu M, Minamishima YA. 2015. Inhibition of the oxygen sensor PHD2 in the liver improves survival in lactic acidosis by activating the Cori cycle. Proc Natl Acad Sci U S A 112:11642–11647. doi: 10.1073/pnas.1515872112. [DOI] [PMC free article] [PubMed] [Google Scholar]
- 3.Inzucchi SE, Lipska KJ, Mayo H, Bailey CJ, McGuire DK. 2014. Metformin in patients with type 2 diabetes and kidney disease: a systematic review. JAMA 312:2668–2675. doi: 10.1001/jama.2014.15298. [DOI] [PMC free article] [PubMed] [Google Scholar]
- 4.Panzer U, Kluge S, Kreymann G, Wolf G. 2004. Combination of intermittent haemodialysis and high-volume continuous haemofiltration for the treatment of severe metformin-induced lactic acidosis. Nephrol Dial Transplant 19:2157–2158. doi: 10.1093/ndt/gfh337. [DOI] [PubMed] [Google Scholar]
- 5.Tanaka T, Doi K, Maeda-Mamiya R, Negishi K, Portilla D, Sugaya T, Fujita T, Noiri E. 2009. Urinary L-type fatty acid-binding protein can reflect renal tubulointerstitial injury. Am J Pathol 174:1203–1211. doi: 10.2353/ajpath.2009.080511. [DOI] [PMC free article] [PubMed] [Google Scholar]
- 6.Yamamoto T, Takano N, Ishiwata K, Ohmura M, Nagahata Y, Matsuura T, Kamata A, Sakamoto K, Nakanishi T, Kubo A, Hishiki T, Suematsu M. 2014. Reduced methylation of PFKFB3 in cancer cells shunts glucose towards the pentose phosphate pathway. Nat Commun 5:3480. doi: 10.1038/ncomms4480. [DOI] [PMC free article] [PubMed] [Google Scholar]
- 7.Luengo A, Sullivan LB, Heiden MG. 2014. Understanding the complex-I-ty of metformin action: limiting mitochondrial respiration to improve cancer therapy. BMC Biol 12:82. doi: 10.1186/s12915-014-0082-4. [DOI] [PMC free article] [PubMed] [Google Scholar]
- 8.Hossain P, Kawar B, El Nahas M. 2007. Obesity and diabetes in the developing world–a growing challenge. N Engl J Med 356:213–215. doi: 10.1056/NEJMp068177. [DOI] [PubMed] [Google Scholar]
- 9.Hundal RS, Inzucchi SE. 2003. Metformin: new understandings, new uses. Drugs 63:1879–1894. doi: 10.2165/00003495-200363180-00001. [DOI] [PubMed] [Google Scholar]
- 10.Owen MR, Doran E, Halestrap AP. 2000. Evidence that metformin exerts its anti-diabetic effects through inhibition of complex 1 of the mitochondrial respiratory chain. Biochem J 348:607–614. doi: 10.1042/bj3480607. [DOI] [PMC free article] [PubMed] [Google Scholar]
- 11.Heishi M, Ichihara J, Teramoto R, Itakura Y, Hayashi K, Ishikawa H, Gomi H, Sakai J, Kanaoka M, Taiji M, Kimura T. 2006. Global gene expression analysis in liver of obese diabetic db/db mice treated with metformin. Diabetologia 49:1647–1655. doi: 10.1007/s00125-006-0271-y. [DOI] [PubMed] [Google Scholar]
- 12.Song S, Andrikopoulos S, Filippis C, Thorburn AW, Khan D, Proietto J. 2001. Mechanism of fat-induced hepatic gluconeogenesis: effect of metformin. Am J Physiol Endocrinol Metab 281:E275–E282. [DOI] [PubMed] [Google Scholar]
- 13.Viollet B, Guigas B, Sanz Garcia N, Leclerc J, Foretz M, Andreelli F. 2012. Cellular and molecular mechanisms of metformin: an overview. Clin Sci (Lond) 122:253–270. doi: 10.1042/CS20110386. [DOI] [PMC free article] [PubMed] [Google Scholar]
- 14.Zhou G, Myers R, Li Y, Chen Y, Shen X, Fenyk-Melody J, Wu M, Ventre J, Doebber T, Fujii N, Musi N, Hirshman MF, Goodyear LJ, Moller DE. 2001. Role of AMP-activated protein kinase in mechanism of metformin action. J Clin Invest 108:1167–1174. doi: 10.1172/JCI13505. [DOI] [PMC free article] [PubMed] [Google Scholar]
- 15.Madiraju AK, Erion DM, Rahimi Y, Zhang XM, Braddock DT, Albright RA, Prigaro BJ, Wood JL, Bhanot S, MacDonald MJ, Jurczak MJ, Camporez JP, Lee HY, Cline GW, Samuel VT, Kibbey RG, Shulman GI. 2014. Metformin suppresses gluconeogenesis by inhibiting mitochondrial glycerophosphate dehydrogenase. Nature 510:542–546. doi: 10.1038/nature13270. [DOI] [PMC free article] [PubMed] [Google Scholar]
- 16.Hundal HS, Ramlal T, Reyes R, Leiter LA, Klip A. 1992. Cellular mechanism of metformin action involves glucose transporter translocation from an intracellular pool to the plasma membrane in L6 muscle cells. Endocrinology 131:1165–1173. doi: 10.1210/endo.131.3.1505458. [DOI] [PubMed] [Google Scholar]
- 17.Ikeda T, Iwata K, Murakami H. 2000. Inhibitory effect of metformin on intestinal glucose absorption in the perfused rat intestine. Biochem Pharmacol 59:887–890. doi: 10.1016/S0006-2952(99)00396-2. [DOI] [PubMed] [Google Scholar]
- 18.Wheaton WW, Weinberg SE, Hamanaka RB, Soberanes S, Sullivan LB, Anso E, Glasauer A, Dufour E, Mutlu GM, Budigner GS, Chandel NS. 2014. Metformin inhibits mitochondrial complex I of cancer cells to reduce tumorigenesis. eLife 3:e02242. doi: 10.7554/eLife.02242. [DOI] [PMC free article] [PubMed] [Google Scholar]
- 19.Decensi A, Puntoni M, Goodwin P, Cazzaniga M, Gennari A, Bonanni B, Gandini S. 2010. Metformin and cancer risk in diabetic patients: a systematic review and meta-analysis. Cancer Prev Res (Phila) 3:1451–1461. doi: 10.1158/1940-6207.CAPR-10-0157. [DOI] [PubMed] [Google Scholar]
- 20.Evans JM, Donnelly LA, Emslie-Smith AM, Alessi DR, Morris AD. 2005. Metformin and reduced risk of cancer in diabetic patients. BMJ 330:1304–1305. doi: 10.1136/bmj.38415.708634.F7. [DOI] [PMC free article] [PubMed] [Google Scholar]
- 21.Noto H, Goto A, Tsujimoto T, Noda M. 2012. Cancer risk in diabetic patients treated with metformin: a systematic review and meta-analysis. PLoS One 7:e33411. doi: 10.1371/journal.pone.0033411. [DOI] [PMC free article] [PubMed] [Google Scholar]
- 22.Quinn BJ, Kitagawa H, Memmott RM, Gills JJ, Dennis PA. 2013. Repositioning metformin for cancer prevention and treatment. Trends Endocrinol Metab 24:469–480. doi: 10.1016/j.tem.2013.05.004. [DOI] [PubMed] [Google Scholar]
- 23.Zhang ZJ, Zheng ZJ, Kan H, Song Y, Cui W, Zhao G, Kip KE. 2011. Reduced risk of colorectal cancer with metformin therapy in patients with type 2 diabetes: a meta-analysis. Diabetes Care 34:2323–2328. doi: 10.2337/dc11-0512. [DOI] [PMC free article] [PubMed] [Google Scholar]
- 24.Check Hayden E. 2015. Anti-ageing pill pushed as bona fide drug. Nature 522:265–266. doi: 10.1038/522265a. [DOI] [PubMed] [Google Scholar]
- 25.Bernier GM, Miller M, Springate CS. 1963. Lactic acidosis and phenformin hydrochloride. JAMA 184:43–46. doi: 10.1001/jama.1963.03700140099014. [DOI] [PubMed] [Google Scholar]
- 26.Lebacq EG, Tirzmalis A. 1972. Metformin and lactic acidosis. Lancet i:314–315. [DOI] [PubMed] [Google Scholar]
- 27.DeFronzo R, Fleming GA, Chen K, Bicsak TA. 2016. Metformin-associated lactic acidosis: Current perspectives on causes and risk. Metabolism 65:20–29. doi: 10.1016/j.metabol.2015.10.014. [DOI] [PubMed] [Google Scholar]
- 28.Peters N, Jay N, Barraud D, Cravoisy A, Nace L, Bollaert PE, Gibot S. 2008. Metformin-associated lactic acidosis in an intensive care unit. Crit Care 12:R149. doi: 10.1186/cc7137. [DOI] [PMC free article] [PubMed] [Google Scholar]
- 29.Suhara T, Baba Y, Shimada BK, Higa JK, Matsui T. 2017. The mTOR signaling pathway in myocardial dysfunction in type 2 diabetes mellitus. Curr Diab Rep 17:38. doi: 10.1007/s11892-017-0865-4. [DOI] [PMC free article] [PubMed] [Google Scholar]
- 30.Gerich JE, Meyer C, Woerle HJ, Stumvoll M. 2001. Renal gluconeogenesis: its importance in human glucose homeostasis. Diabetes Care 24:382–391. doi: 10.2337/diacare.24.2.382. [DOI] [PubMed] [Google Scholar]
- 31.Duan LJ, Takeda K, Fong GH. 2014. Hematological, hepatic, and retinal phenotypes in mice deficient for prolyl hydroxylase domain proteins in the liver. Am J Pathol 184:1240–1250. doi: 10.1016/j.ajpath.2013.12.014. [DOI] [PMC free article] [PubMed] [Google Scholar]
- 32.Pearl RG. 2014. Erythropoietin and organ protection: lessons from negative clinical trials. Crit Care 18:526. doi: 10.1186/s13054-014-0526-9. [DOI] [PMC free article] [PubMed] [Google Scholar]
- 33.Hams E, Saunders SP, Cummins EP, O'Connor A, Tambuwala MT, Gallagher WM, Byrne A, Campos-Torres A, Moynagh PM, Jobin C, Taylor CT, Fallon PG. 2011. The hydroxylase inhibitor dimethyloxallyl glycine attenuates endotoxic shock via alternative activation of macrophages and IL-10 production by B1 cells. Shock 36:295–302. doi: 10.1097/SHK.0b013e318225ad7e. [DOI] [PMC free article] [PubMed] [Google Scholar]
- 34.Minamishima S, Bougaki M, Sips PY, Yu JD, Minamishima YA, Elrod JW, Lefer DJ, Bloch KD, Ichinose F. 2009. Hydrogen sulfide improves survival after cardiac arrest and cardiopulmonary resuscitation via a nitric oxide synthase 3-dependent mechanism in mice. Circulation 120:888–896. doi: 10.1161/CIRCULATIONAHA.108.833491. [DOI] [PMC free article] [PubMed] [Google Scholar]
- 35.Emami Riedmaier A, Fisel P, Nies AT, Schaeffeler E, Schwab M. 2013. Metformin and cancer: from the old medicine cabinet to pharmacological pitfalls and prospects. Trends Pharmacol Sci 34:126–135. doi: 10.1016/j.tips.2012.11.005. [DOI] [PubMed] [Google Scholar]
- 36.Olenchock BA, Moslehi J, Baik AH, Davidson SM, Williams J, Gibson WJ, Pierce KA, Miller CM, Hanse EA, Kelekar A, Sullivan LB, Wagers AJ, Clish CB, Vander Heiden MG, Kaelin WG Jr. 2016. EGLN1 inhibition and rerouting of alpha-ketoglutarate suffice for remote ischemic protection. Cell 164:884–895. doi: 10.1016/j.cell.2016.02.006. [DOI] [PMC free article] [PubMed] [Google Scholar]
- 37.Bakker J, Jansen TC. 2007. Don't take vitals, take a lactate. Intensive Care Med 33:1863–1865. doi: 10.1007/s00134-007-0679-y. [DOI] [PMC free article] [PubMed] [Google Scholar]
- 38.Minamishima YA, Moslehi J, Bardeesy N, Cullen D, Bronson RT, Kaelin WG. 2008. Somatic inactivation of the PHD2 prolyl hydroxylase causes polycythemia and congestive heart failure. Blood 111:3236–3244. doi: 10.1182/blood-2007-10-117812. [DOI] [PMC free article] [PubMed] [Google Scholar]
- 39.Minamishima YA, Moslehi J, Padera RF, Bronson RT, Liao R, Kaelin WG Jr. 2009. A feedback loop involving the Phd3 prolyl hydroxylase tunes the mammalian hypoxic response in vivo. Mol Cell Biol 29:5729–5741. doi: 10.1128/MCB.00331-09. [DOI] [PMC free article] [PubMed] [Google Scholar]
- 40.Haase VH, Glickman JN, Socolovsky M, Jaenisch R. 2001. Vascular tumors in livers with targeted inactivation of the von Hippel-Lindau tumor suppressor. Proc Natl Acad Sci U S A 98:1583–1588. doi: 10.1073/pnas.98.4.1583. [DOI] [PMC free article] [PubMed] [Google Scholar]
- 41.Santana AC, Degaspari S, Catanozi S, Delle H, de Sa Lima L, Silva C, Blanco P, Solez K, Scavone C, Noronha IL. 2013. Thalidomide suppresses inflammation in adenine-induced CKD with uraemia in mice. Nephrol Dial Transplant 28:1140–1149. doi: 10.1093/ndt/gfs569. [DOI] [PubMed] [Google Scholar]
- 42.Kubo A, Ohmura M, Wakui M, Harada T, Kajihara S, Ogawa K, Suemizu H, Nakamura M, Setou M, Suematsu M. 2011. Semi-quantitative analyses of metabolic systems of human colon cancer metastatic xenografts in livers of superimmunodeficient NOG mice. Anal Bioanal Chem 400:1895–1904. doi: 10.1007/s00216-011-4895-5. [DOI] [PMC free article] [PubMed] [Google Scholar]
- 43.Bao Y, Mukai K, Hishiki T, Kubo A, Ohmura M, Sugiura Y, Matsuura T, Nagahata Y, Hayakawa N, Yamamoto T, Fukuda R, Saya H, Suematsu M, Minamishima YA. 2013. Energy management by enhanced glycolysis in G1-phase in human colon cancer cells in vitro and in vivo. Mol Cancer Res 11:973–985. doi: 10.1158/1541-7786.MCR-12-0669-T. [DOI] [PubMed] [Google Scholar]