

ABSTRACT
Epstein-Barr virus (EBV) is a ubiquitous human gammaherpesvirus that establishes a latency reservoir in B cells. In this work, we show that ibrutinib, idelalisib, and dasatinib, drugs that block B cell receptor (BCR) signaling and are used in the treatment of hematologic malignancies, block BCR-mediated lytic induction at clinically relevant doses. We confirm that the immunosuppressive drugs cyclosporine and tacrolimus also inhibit BCR-mediated lytic induction but find that rapamycin does not inhibit BCR-mediated lytic induction. Further investigation shows that mammalian target of rapamycin complex 2 (mTORC2) contributes to BCR-mediated lytic induction and that FK506-binding protein 12 (FKBP12) binding alone is not adequate to block activation. Finally, we show that BCR signaling can activate EBV lytic induction in freshly isolated B cells from peripheral blood mononuclear cells (PBMCs) and that activation can be inhibited by ibrutinib or idelalisib.
IMPORTANCE EBV establishes viral latency in B cells. Activation of the B cell receptor pathway activates lytic viral expression in cell lines. Here we show that drugs that inhibit important kinases in the BCR signaling pathway inhibit activation of lytic viral expression but do not inhibit several other lytic activation pathways. Immunosuppressant drugs such as cyclosporine and tacrolimus but not rapamycin also inhibit BCR-mediated EBV activation. Finally, we show that BCR activation of lytic infection occurs not only in tumor cell lines but also in freshly isolated B cells from patients and that this activation can be blocked by BCR inhibitors.
KEYWORDS: B cell receptor pathway, cyclosporine, dasatinib, Epstein-Barr virus, ibrutinib, idelalisib, lytic infection, rapamycin, tacrolimus, mTOR
INTRODUCTION
Epstein-Barr virus (EBV) is a ubiquitous human gammaherpesvirus infection that is maintained in a pool of resting memory B cells following primary infection (1–3). The disappearance of B cells from blood as assessed by flow cytometry following treatment with a B cell-targeting monoclonal antibody commonly results in an inability to detect EBV DNA in peripheral blood mononuclear cells (PBMCs) (4). The reservoir in B cells appears to be necessary to maintain the virus as evidenced by the observation that chronic infection is not established in patients with Bruton agammaglobulinemia who lack B cells (3). B cells not only harbor the virus, but the character of the B cells that harbor virus influence viral gene regulation. In vitro, EBV infection of B cells results in immortalized lymphoblastoid cell lines expressing eight or more latency antigens, whereas in vivo, in healthy seropositive adults, the B cells that harbor viral genomes demonstrate very restricted viral gene expression. The germinal center reaction that occurs in lymphoid tissue is hypothesized to play a key role in downmodulating viral gene expression (1). In some B cell tumor lines, B cell receptor (BCR) signaling is a potent activator of EBV lytic gene expression (5). EBV gene expression and particularly expression of latent membrane protein 2A (LMP2A) and LMP2B influence the BCR signaling pathway (6). Thus, B cells harbor virus, and B cell biology is important to the viral life cycle.
Several pharmacologic agents that target B cell signaling pathways have come into clinical use. These pharmacologic agents include agents used because they target BCR signaling pathways such as ibrutinib which inhibits Bruton's tyrosine kinase (BTK) and idelalisib which inhibits phosphatidylinositol 3-kinase δ (PI3Kδ) and other agents with off-target effects on BCR signaling such as dasatinib, which targets Bcr-Abl kinase but also has effects on LYN.
In the investigations presented here, we show that some BCR signaling inhibitors profoundly inhibit BCR-driven activation of lytic infection in B cell tumor lines that harbor EBV. We also show that whereas the immunosuppressive drugs cyclosporine and tacrolimus inhibit BCR-driven activation of lytic infection, rapamycin, another immunosuppressive drug, does not. Finally, we show for the first time that BCR signaling is an activator of EBV lytic infection in naturally infected patient B cells and that ibrutinib, idelalisib, and dasatinib block that activation.
RESULTS
Previous investigators had demonstrated that anti-Ig induces lytic EBV replication in the Akata Burkitt cell line (7). We studied lytic gene expression and green fluorescent protein (GFP) expression in the BX1-Akata cell line, where GFP served as an indicator of lytic replication of EBV (Fig. 1). Induction with anti-Ig led to increased viral lytic RNA, protein, viral DNA, and increased GFP expression. Thus, in the BX1-Akata cell line, GFP expression parallels other indications of EBV lytic gene expression. We investigated treatment with kinase inhibitors known to block BCR signaling: ibrutinib, idelalisib, or dasatinib. Each of these agents also decreased basal levels of Zta RNA and protein, likely reflecting inhibition of basal BCR signaling, and in combination with anti-Ig, blocked the induction of Zta RNA, ZTA protein, GFP fluorescence, and EBV DNA replication.
FIG 1.

Ibrutinib, idelalisib, and dasatinib block BCR-mediated EBV activation. BX1-Akata cells were treated with 1 μM ibrutinib, (IB), idelalisib (ID), or dasatinib (DS) for 1 h, followed by induction (+) with anti-IgG. (A) qRT-PCR amplifying Zta cDNA 24 h after treatment with anti-IgG normalized to glyceraldehyde-3-phosphate dehydrogenase (GAPDH). (B) Immunoblot showing ZTA 24 h after treatment with anti-IgG. (C) GFP-positive cells were counted and compared with an untreated sample 24 h after treatment. (D) qPCR amplifying the BamW region of the EBV genome 48 h after treatment with anti-IgG. (E, top) Immunofluorescence showing ZTA 24 h after treatment with anti-IgG. (Bottom) GFP 24 h after treatment with anti-IgG.
To determine the potency of these drugs in blocking of BCR-mediated lytic induction of EBV, we performed dose-response experiments on BX1-Akata cells. We calculated the 50% inhibitory concentration (IC50) for inhibition of GFP expression (Fig. 2A). These results parallel values reported in the literature for inhibition of BTK, PI3Kδ, and LYN enzymatic activities (8–10). As shown in Fig. 2B, these agents block anti-Ig-induced phosphorylation of downstream B cell receptor signaling proteins. Thus, the pharmacodynamics of inhibition of EBV lytic induction paralleled the inhibition of the expected target pathway, i.e., ibrutinib, idelalisib, and dasatinib all inhibited phosphorylation of AKT, extracellular signal-regulated kinase (ERK), and PI3K. Note that clinically dasatinib is used to inhibit ABL kinase and inhibition of LYN is an off-target effect (10). To validate the specificity of the drugs on their target genes, we performed small interfering RNA (siRNA) knockdown experiments against BTK, LYN, and PI3K (Fig. 2C). In each siRNA experiment, anti-IgG mediated increased GFP expression, and Zta expression was blocked relative to control samples.
FIG 2.

Ibrutinib, idelalisib, and dasatinib inhibit BCR-mediated EBV activation in a dose-dependent manner. (A) GFP-positive cells were counted and plotted against drug concentration 24 h after anti-IgG treatment. The graphs are representative of the results from three or more independent experiments. (B) Cells were treated with 1 or 0.1 μM ibrutinib (IB), idelalisib (ID), or dasatinib (DS) for 1 h followed by induction with anti-IgG (+). Protein was isolated 10 min after anti-IgG treatment and analyzed by Western blotting. The blots are representative of the blots from three or more independent experiments. p-AKT, phosphorylated AKT. (C) BX1-Akata cells were nucleofected with siRNA targeting the indicated transcripts followed by treatment with anti-IgG. qRT-PCR amplifying Zta cDNA 24 h after treatment with anti-IgG. Zta levels are normalized to GAPDH and compared to a control sample.
To further explore the effects of ibrutinib and idelalisib on lytic activation, we studied the effects of other EBV lytic inducers: ionomycin, tetradecanoyl phorbol acetate (TPA), and NaB (Fig. 3). No inhibition of lytic activation was apparent. At lower doses of TPA and NaB, ibrutinib and idelalisib had no effect on lytic activation (data not shown). Thus, inhibition of lytic induction is not a general phenomenon but seems to be specific to BCR-activated lytic induction.
FIG 3.

Kinase inhibitors with other inducers. BX1-Akata cells were treated with the indicated kinase inhibitors and lytic inducers. (A) GFP-positive cells 24 h after treatment with inducers. (B) GFP-positive cells were counted and compared to the number of GFP-positive cells in an untreated sample. (C) Immunofluorescence staining showing ZTA. Cells were treated with 1 μM ionomycin (Io), 20 ng/ml TPA, or 3 mM NaB.
It has been previously reported that anti-Ig induction of the EBV lytic cycle in Akata cells can be blocked by the immunosuppressants cyclosporine and tacrolimus (11). As shown in Fig. 4, we first confirmed the observation that cyclosporine and tacrolimus block anti-IgG-induced EBV lytic activation. It appears that rapamycin weakly activates lytic infection (Fig. 4B and G). This may reflect activation of a feedback loop between mTOR complex 1 and AKT.
FIG 4.

Rapamycin does not block anti-IgG-induced lytic activation. (A) BX1-Akata cells were pretreated with 1 μM cyclosporine (CsA) or 10 nM tacrolimus (TAC) for 1 h, followed by treatment with anti-IgG. (B) BX1-Akata cells were treated with various micromolar doses of rapamycin (R). (C and D) BX1-Akata cells were pretreated with rapamycin using various doses for 1 h and followed by induction with anti-IgG (C) or ionomycin (D). (E) BX1-Akata cells were treated with rapamycin for 1 h, followed by treatment with NaB or TPA. (F to I) Fluorescence microscopy was used to determine the number of GFP-positive cells. Values were graphed as a function of the experimental control. Panels F, G, H, and I depict the data in panels A, B, C, and D quantified, respectively. Cells were treated with 1 μM ionomycin, 20 ng/ml TPA, or 3 mM NaB unless otherwise indicated.
Previous investigations reported that rapamycin inhibited EBV lytic activation, albeit in different cell types and with other lytic inducers (12). However, rapamycin does not block anti-Ig-induced EBV activation (Fig. 4C and H). The investigators who had reported inhibition of lytic EBV infection with rapamycin had not studied anti-Ig-induced EBV activation but had studied NaB and TPA EBV activation. This led us to investigate differential effects of immunosuppressants on EBV lytic activation by various inducers. We pretreated cells with cyclosporine, tacrolimus, or rapamycin, followed by treatment with anti-IgG, NaB, TPA, or ionomycin. We confirmed the previous report that rapamycin blocked NaB and TPA induced EBV lytic activation (Fig. 4E) and found that cyclosporine and tacrolimus did not do so (data not shown). In contrast, we found that cyclosporine and tacrolimus blocked ionomycin-induced EBV lytic activation in the same manner as anti-IgG induction (data not shown) but rapamycin did not (Fig. 4D and I). These results suggest that cyclosporine, tacrolimus, and rapamycin, although all immunosuppressive agents, have very different effects on EBV activation.
Tacrolimus and rapamycin both form binary complexes with FKBP (FK506-binding protein) (13). The FKBP-tacrolimus complex binds to and inhibits the enzymatic activity of the protein phosphatase calcineurin, blocking calcium-dependent intracellular signaling, while the FKBP-rapamycin complex binds to the protein kinase mTOR (mammalian target of rapamycin). Tacrolimus and rapamycin have nearly identical FKBP-binding domains (FKBDs), but each possesses distinct effector domains responsible for interactions with calcineurin and mTOR. The failure of rapamycin to inhibit Ig-induced lytic activation suggested that binding FKBP is not sufficient to block EBV lytic activation. To further verify this hypothesis, we synthesized two nonimmunosuppressive analogs of tacrolimus and investigated their effects on EBV lytic activation by anti-IgG (Fig. 5). The two analogs, FKAM and FKN4, have the same FKBP-binding domain but altered effector domains. Thus, new substitutions were added to the allyl group of FK506 to generate FKN4 and FKAM (Fig. 6A). The presence of the newly added “bumps” in the effector domain of FK506 is expected to prevent FKN4 and FKAM from binding to calcineurin without affecting their interactions with FKBP. The lack of inhibition of calcineurin was verified using a nuclear factor of activated T cells (NFAT)-luciferase reporter gene, which upon transfection into Jurkat T cells, can be stimulated by phorbol myristate acetate (PMA) and ionomycin. While FK506 potently inhibited the NFAT-luciferase reporter, neither FKN4 nor FNAM had an appreciable effect on the reporter activity at the highest concentrations tested (Fig. 6B). The interactions of FKN4 and FKAM with FKBP are demonstrated by their ability to compete with FK506 and block inhibition of NFAT-luciferase (Fig. 6C). Next, we determined the effects of the nonimmunosuppressive analogs on EBV lytic activation in response to anti-IgG stimulation. BX1-Akata cells were pretreated with these analogs at various doses for 1 h and then induced with anti-IgG. EBV activation was assessed by GFP expression 24 h after treatment. Neither FKN4 nor FKAM affected GFP expression induced by anti-IgG, further supporting the notion that FKBP binding is not sufficient to block EBV lytic activation and that the inhibitory effects observed for cyclosporine and tacrolimus were mediated through inhibition of calcineurin (Fig. 6D and E).
FIG 5.

Synthesis of tacrolimus analogs. (A) Synthetic scheme of FKN4. (B) Synthetic scheme of FKAM. OMe, methyl group bound to oxygen.
FIG 6.

FKBP12 binding is not sufficient for blocking EBV lytic activation. (A) Structures of FK506, rapamycin, and nonimmunosuppressive FK506 analogs FKN4 and FKAM. The newly added substituents in FKN4 and FKAM are blue. (B) Effects of FK506, FKN4, and FKAM on the activation of an NFAT-luciferase reporter gene stimulated with PMA and ionomycin in Jurkat T cells. (C) NFAT luciferase reporter gene competition assay in Jurkat T cells. (D) BX1-Akata cells were pretreated with tacrolimus and tacrolimus analogs FKAM and FKN4 using various doses for 1 h followed by induction with anti-IgG for 24 h. (E) GFP-positive cells were counted and compared with the number of GFP-positive cells in an untreated sample. ctrl, control.
To further investigate the impact of blocking mTOR signaling on EBV lytic activation, we used the mTOR active site inhibitor torin2. While rapamycin inhibits mTOR complex 1 (mTORC1), torin2 has been shown to block both mTORC1 and mTORC2 (14). BX1-Akata cells were pretreated with either rapamycin or torin2 and induced with anti-IgG after 30 min. ZTA expression was assessed by immunofluorescence and immunoblot, while Zta RNA level was assessed by quantitative reverse transcription-PCR (qRT-PCR) 24 h after treatment (Fig. 7). Rapamycin did not block anti-IgG-induced EBV lytic activation, but torin2 did. Treatment by anti-IgG increased phosphorylation of mTOR, AKT, and S6 kinase (S6K), a downstream target of mTOR kinase. We found that both rapamycin and torin2 blocked phosphorylation of mTOR and its downstream target, S6K (Fig. 7E). However, profound inhibition of AKT phosphorylation was shown after 30 min in torin2-treated cells, as it blocks both mTORC1 and mTORC2, which has a positive-feedback loop with AKT. Rapamycin also blocked phosphorylation of AKT, but to a lesser degree. Torin2 treatment alone also resulted in a decrease in ZTA expression, likely due to inhibition of basal BCR signaling (Fig. 7). These results suggest that mTORC2 and likely AKT activity is crucial for anti-IgG-mediated EBV lytic activation in the Akata cell line.
FIG 7.

mTORC2 activity is crucial for B cell receptor (BCR)-mediated EBV lytic activation. BX1-Akata cells were pretreated with rapamycin (R) or torin2 (T) for 30 min followed by induction with anti-IgG. (A) Zta RNA level was measured by qRT-PCR 24 h after either rapamycin or torin2 treatment and normalized to GAPDH. (B) ZTA protein level was assessed by immunoblotting 24 h after treatment. (C) GFP-positive cells were counted and compared with the number of GFP-positive cells in an untreated sample (−). (D) GFP and ZTA protein level was assessed by immunofluorescence 24 h after treatment. (E) Phosphorylation of AKT, mTOR, and S6K were assessed by immunoblotting 10 min after anti-IgG treatment.
Although many investigators have documented the effects of BCR signaling on activation of EBV in a variety of cell lines (5, 15, 16), to the best of our knowledge, these effects have never been documented directly in B cells from patients. For this investigation, we obtained PBMCs from two patients with high EBV copy number without malignancy. We isolated B cells and treated with anti-IgG and anti-IgM in combination with ibrutinib or idelalisib (Fig. 8). We found that BCR stimulation activated EBV lytic replication as shown by increased viral DNA but that this effect was blocked by ibrutinib and idelalisib. Thus, BCR signaling can activate EBV replication in nonmalignant cells, and pharmacologic agents that block the BCR signaling pathway inhibit this activation.
FIG 8.
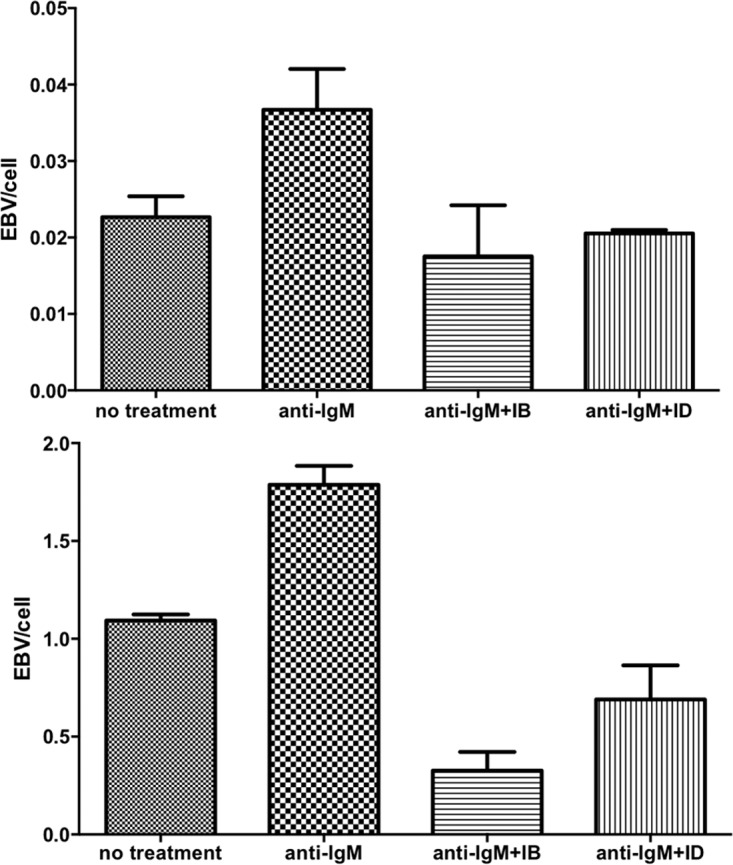
BCR-mediated EBV activation in naturally infected EBV-positive B cells. This activation is inhibited by ibrutinib and idelalisib. Peripheral blood mononuclear cells were obtained from two patients with high EBV copy number, but no malignancy. B cells were negatively selected using magnetically activated cell sorting. Treatment with anti-IgM led to increased EBV genome amplification at 48 h. Pretreatment with 1 μM ibrutinib or idelalisib 1 h before anti-IgM treatment prevented EBV amplification.
DISCUSSION
The studies presented here demonstrate that pharmacologic agents targeting the BCR pathway block BCR-mediated activation of the EBV lytic cycle. Furthermore, with the investigation of fresh, naturally infected B cells, we have presented evidence that BCR activation may be relevant in vivo as well.
Since the early days of organ transplantation, pharmacologic agents have been recognized to play an important role in the pathogenesis of EBV-associated lymphoproliferative diseases (17). Immunosuppressive agents such as azathioprine, cyclosporine, tacrolimus, mycophenolate, antithymocyte globulin, OKT3, and others have been associated with an increased risk of posttransplant lymphoproliferative disease. The increased risk was generally attributed to drug effects on T cell function and resultant loss of control of EBV-driven B cell lymphoproliferation (18). In more recent years, rapamycin has often replaced or supplemented calcineurin inhibitors in many transplantation regimens. Evidence has been presented that whereas calcineurin inhibitors block T cell function, in some special instances, rapamycin enhances T cell function (19). For example, in a genetic immunodeficiency syndrome associated with activation of PI3Kδ, rapamycin has shown promise as a therapeutic agent because it enhances antiviral T cell function (20). Similarly, rapamycin may correct the antiviral deficiency associated with belatacept, a CTLA4-Ig derivative used in organ transplantation (19).
In this report, our focus is not on T cells but on B cells (21). With regard to B cells, it has previously been reported that cyclosporine and tacrolimus increase the viability of spontaneous EBV-lymphoblastoid cell lines, possibly reflecting partial protection from Fas-mediated apoptosis, and this phenomenon may also occur in vivo and play a role in the pathogenesis of posttransplant lymphoproliferative disorder (22). Conversely, antibody-mediated B cell depletion has long been recognized as an effective intervention for EBV-associated posttransplant lymphoproliferative disease (4, 23). The EBV latency reservoir is the resting B cell reservoir, and depleting the B cell reservoir reduces both the pool of infected cells and those that might become infected (24).
Little is known of the regulation of viral activation in latently infected B cells in vivo, but certainly BCR signaling may play a role. BCR signaling has been used as a laboratory tool to activate lytic infection in certain cell lines in vitro for many years. Here we show that BCR signaling also activates lytic infection in freshly isolated naturally infected B lymphocytes. Furthermore, we show that pharmacologic agents that inhibit BCR signaling also inhibit EBV lytic activation.
These BCR inhibitors in aggregate are used in the treatment of chronic lymphocytic leukemia, mantle cell lymphoma, Waldenstrom macroglobulinemia, marginal zone lymphoma, follicular lymphoma, and chronic myeloid leukemia (25, 26). We note that the BCR effects of dasatinib are off target and that the agent is used to inhibit BCR-ABL in the treatment of chronic myelocytic leukemia. All of these agents are orally administered and in contrast to earlier generations of antineoplastic agents are typically prescribed until there is tumor progression, i.e., patients may be treated with these agents for months or years. None of these malignancies is typically associated with EBV, although high EBV copy number in blood has been reported in some patients with chronic lymphocytic leukemia (27, 28), and chronic lymphocytic leukemia may evolve into EBV-associated diffuse large B cell lymphoma or Hodgkin lymphoma (29, 30).
We suspect that the BTK and PI3Kδ inhibitors will impact the long-term EBV reservoir and EBV viremia. However, it is difficult to predict from first principles what these effects will be. Thus, if sustenance of that reservoir required intermittent infection of previously uninfected cells, then blocking EBV activation might interfere with the ability to maintain that reservoir. Preventing lytic replication and new rounds of infection might result in fewer EBV-infected cells and less EBV malignancy. Alternatively, if periodic lytic EBV activation results in the death of virus harboring cells that might evolve to malignant cells, then inhibiting lytic activation might increase EBV malignancy.
Although both calcineurin inhibitors and rapamycin are inhibitors of T cell function and are used in transplantation to suppress or prevent organ rejection in solid organ transplantation or graft versus host disease in allogeneic hematopoietic cell transplantation, these agents have markedly different effects from each other on BCR-mediated EBV activation in B cells. As was previously shown (11) and confirmed here, the calcineurin inhibitors block EBV activation following BCR stimulation, whereas such activation is not inhibited by rapamycin in our experiments. Thus, these agents may be expected to have very different effects with regard to posttransplant lymphoproliferative disease. A recent report indicated that in renal transplant recipients who were EBV seronegative prior to transplant, treatment with rapamycin and mycophenolate was associated with a lower risk of posttransplant lymphoproliferative disease than treatment with tacrolimus and mycophenolate (31). Whether the difference in posttransplant lymphoproliferative disease reflects drug effects on T cells or B cells or both is not known.
In conclusion, our investigations suggest that activation of the BCR pathway leads to EBV lytic induction in freshly isolated peripheral blood B cells in vitro. Furthermore, inhibitors of the BCR pathway blocked EBV activation in vitro and in freshly isolated B cells. Finally, in contrast to calcineurin inhibitors, rapamycin does not inhibit BCR-driven EBV activation. As these drugs are increasingly widely used and usually are used for months or years, it seems that further investigation of their effects on EBV-associated phenomena is indicated. BTK inhibitors are used widely to treat chronic lymphocytic leukemia, it has been suggested that EBV copy number in blood may have prognostic significance, and EBV-related complications though rare are well recognized. Thus, the impact of these agents in chronic lymphocytic leukemia would seem to be an appropriate focus of future research. Similarly, with differences in the incidence of EBV-associated posttransplant lymphoproliferative disease associated with regimens that include calcineurin inhibitors, further investigation of the possible role of BCR-mediated EBV activation in the pathogenesis of posttransplant lymphoproliferative disease may be warranted.
MATERIALS AND METHODS
Reagents and antibodies.
Antibodies against phospho-AKT (Ser473), Akt, phospho-BTK (Tyr223), phospho-ERK, and ERK were obtained from Cell Signaling Technologies. Antibodies against BTK were obtained from R&D Systems. Antibodies against phospho-PI3Kδ (Tyr485), PI3Kδ, and EBV ZTA were obtained from Santa Cruz Biotechnology and against β-actin from Sigma-Aldrich. Anti-IgG and anti-IgM were purchased from Sigma-Aldrich (catalog no. I5260 and I0759, respectively). In all treatments, anti-IgG and anti-IgM were used at 10 μg/ml. Secondary anti-mouse and anti-rabbit antibodies were purchased from Jackson ImmunoResearch. Ibrutinib was purchased from ApexBio. Idelalisib and dasatinib were obtained from MedKoo. Ionomycin was purchased from Sigma-Aldrich. Nonimmunosuppressive FK506 analogs were synthesized and characterized as described later in Materials and Methods.
Cell lines and culture.
An engineered Akata cell line derivative (BX1-Akata) that carries a recombinant EBV that constitutively expresses a green fluorescent protein (GFP) was a gift from L. Hutt-Fletcher (32). BX1-Akata cells were cultured in RPMI 1640 medium (Mediatech) supplemented with 10% fetal bovine serum (FBS) (Mediatech), 100 U/ml penicillin, 100 μg/ml streptomycin (Life Technologies), 100 mM l-glutamine (Life Technologies), and 500 μg/ml G418.
Fluorescence microscopy.
A total of 1.5 × 10⁵ cells were taken from culture and washed with phosphate-buffered saline (PBS). Subsequently, the cells were spun onto microscope slides using a Cytospin centrifuge. The cells were fixed, permeabilized with ice-cold methanol for 15 min, and blocked in PBS containing 5% bovine serum albumin (BSA) for 30 min at room temperature. ZTA antibodies (Santa Cruz) were diluted 1:50 in PBS containing 5% BSA and applied to the cells for 1 h at room temperature. The attached cells were then washed three times for 10 min each time with PBS containing 5% BSA and 0.1% Tween 20. Cy3 goat anti-mouse antibodies (Jackson ImmunoResearch) were diluted 1:50 in PBS containing 5% BSA and applied to the cells for 1 h at room temperature in the dark. The slides were then washed three times for 10 min each time with PBS containing 5% BSA and 0.1% Tween 20. The cells were stained with Vectashield mounting medium with 4′,6′-diamidino-2-phenylindole (DAPI) was purchased from Vector Laboratories. For GFP, BX-1 Akata cells were cultured as described above and treated as indicated in the figures. A ZOE fluorescent cell imager (Bio-Rad) was used to image the fixed cells for Cy3 and live cells for GFP.
Quantitative PCR.
DNA was isolated from cells using the QIAamp kit from Qiagen. A quantitative PCR assay of the BamW repeat region of the EBV genome was performed to measure the viral load. A BamW probe (Integrated DNA Technologies) (5′ [6-carboxyfluorescein {FAM}] CACACACTACACACACCCACCCGTCTC [BH1] 3′) was used in conjunction with SsoAdvance supermix (Bio-Rad). BamW primers were obtained from Integrated DNA Technologies (fwd [fwd stands for forward] [5′ CCCAACACTCCACCACACC 3′ and rev [rev stands for reverse] [5′ TCTTAGGAGCTGTCCGAGGG 3′]). Copy number was determined by comparison to a serial dilution of the Namalwa cell line. The concentration of primers was 500 nM. The probe concentration was 200 nM. Two microliters of DNA at 50 ng/ml was used per reaction mixture. The reaction mixture size was 20 μl. The CFX96 real-time thermocycler from Bio-Rad was set as follows: (i) 95°C for 2 min; (ii) 40 cycles, with 1 cycle consisting of 95°C for 5 s and 60°C for 10 s. For viral load quantification by quantitative PCR (qPCR), cells were treated with ibrutinib, idelalisib, or dasatinib for 1 h prior to treatment with anti-IgG, and DNA was isolated after 48 h. For Zta mRNA quantification, cells were treated as described above, and RNA was isolated after 24 h (RNeasy kit from Qiagen). cDNA was then made from the RNA using the iScript reverse synthase kit from Bio-Rad. cDNA volume corresponding to 25 ng total RNA was amplified using the SsoFast Evagreen kit from Bio-Rad on a CFX96 real-time thermocycler from Bio-Rad. The cDNA was amplified using a PCR program of 95°C for 30 s once and then 40 cycles, with 1 cycle consisting of 95°C for 5 s and 60°C for 5 s. The primers used for Zta were fwd (5′ACATCTGCTTCAACAGGAGG5 3′) and rev (5′AGCAGACATTGGTGTTCCAC 3′).
Immunoblots.
For phospho-protein immunoblots, cells were serum starved for 3 h and pretreated with ibrutinib, idelalisib, or dasatinib for 1 h prior to treatment by anti-IgG. Protein was isolated 10 min after treatment by anti-IgG. For ZTA blots, cells were treated with ibrutinib, idelalisib, or dasatinib for 1 h prior to anti-IgG treatment, and protein was extracted 24 h after anti-IgG treatment. To prepare protein extracts, 1.5 × 10⁷ cells were pelleted by centrifugation and washed in PBS. The pellet was resuspended in buffer containing 10 mM HEPES (pH 7.9), 10 mM KCl, 100 μM EDTA, and 1× protease/phosphatase inhibitor cocktail (Cell Signaling Technologies) and incubated on ice for 15 min. NP-40 was added to a final concentration of 0.6%, and the cells were lysed by brief vortexing. The cytosolic supernatant was separated from the nuclear pellet by centrifugation at 10,000 rpm for 30 s at 4°C. The nuclear pellet was resuspended in a buffer containing 20 mM HEPES (pH 7.9), 400 mM NaCl, 1 mM EDTA, and 1× protease/phosphatase inhibitor cocktail (Cell Signaling Technologies), followed by rotation for 15 min at 4°C. The nuclear supernatant was isolated by centrifugation at 13,000 rpm for 5 min at 4°C. Equal amounts of protein per sample were separated by SDS-PAGE and subsequently transferred to nitrocellulose membranes. After the membranes were probed with primary antibodies, horseradish peroxidase-conjugated antibodies were applied against the primary antibodies. The immunoblots were imaged using Amersham ECL-Prime chemiluminescent reagent (GE Health). The film used was HyBlot CL autoradiography film (Denville Scientific).
Luciferase reporter assay.
NFAT luciferase reporter assay was performed as described previously (33). Briefly, Jurkat T cells transfected with NFAT reporter construct were seeded into 96-well plates at a density of 5 × 10⁴ cells/180 μl/well. Drugs were serially diluted in dimethyl sulfoxide (DMSO) as 1,000× stocks, which were subsequently diluted to 20× in serum-free RPMI 1640 medium before addition to the 96-well plates. After 30 min of drug incubation, 40 nM phorbol myristate acetate (PMA) and 1 μM ionomycin were added to stimulate cells. After a 6-h incubation, the plates were centrifuged, and the supernatant was removed. Cells were immediately lysed in situ by adding 100 μl/well lysis buffer and kept at room temperature for 30 min. The luciferase activity was determined with sequential injection of luciferin solution into each well followed by photon emission detection.
Statistical analysis.
The 50% inhibitory concentrations (IC50s) were determined using the equation Y = Ymin + (Ymax − Ymin)/(1 + 10^((X − log IC50))) in GraphPad Prism, where Y is effect, Ymin is the minimum Y, Ymax is the maximum Y, and X is dose.
Patient specimens.
With written informed consent and approval of the Johns Hopkins Hospital Investigational Review Board, blood was collected from two older adult patients with night sweats, fevers, and elevated EBV copy number in peripheral blood mononuclear cells (PBMCs). Both patients had diffuse small lymphadenopathy (<2 cm) and biopsy specimens that showed atypical follicular hyperplasia with no evidence of clonality by immunohistochemistry or flow cytometry. Both patients were ultimately treated with rituximab with only transient clinical responses.
Magnetically activated cell sorting (MACS) isolation of patient B cells.
PBMCs were isolated from whole blood using a Ficoll gradient. B cell subsets were isolated by depletion of magnetically labeled non-B cells from patient PBMCs (B cell isolation kit II; Miltenyi Biotec).
siRNA knockdown.
SMARTpool siRNA against BTK (M-003107-01-0005), LYN (L-003153-00-0005), and PIK3CD (L-006775-00-0005) were purchased from Dharmacon and nucleofected into BX1-Akata cells at 30 nM (BTK and LYN) and 300 nM (PIK3CD). Nucleofection was carried out using a Nucleofector II device from Amaxa using Amaxa cell line Nucleofector kit R according to the manufacturer's specifications. Forty-eight hours after the initial nucleofection, the nucleofection was repeated on the same cells used for the first nucleofection. Twenty-four hours after the second nucleofection, the cells were treated with 10 μg/ml anti-IgG. Images were taken, and RNA was extracted 24 h after anti-IgG treatment.
Synthesis and characterization of FK506 analogs. (i) Compound C.
To a mixture of 4-vinylbenzyl chloride (compound A) (0.4 g, 2.6 mmol), K2CO3 (1 g, 7.2 mmol), KI (0.1 g, 0.6 mmol) in anhydrous dimethylformamide (DMF) (5 ml) under Ar was added 1-naphthol (compound B) (0.3 g, 2 mmol). After the mixture was stirred for 40 h at room temperature (rt), the reaction was quenched with 100 ml H2O. The mixture was extracted with dichloromethane (DCM), washed with brine, dried, and concentrated. The resulting residue was purified by passage through a silica gel column using 10% ethyl acetate in hexane as an eluent to give compound C as a white solid. Yield: 62%. 1H-NMR (500 MHz, CDCl3) δ 8.36 to 8.32 (m, 1H), 7.82 to 7.79 (m, 1H), 7.52 to 7.42 (m, 8H), 6.88 (d, J = 7.3 Hz, 1H), 6.75 (dd, J = 17.6, 11.0 Hz, 1H), 5.78 (dd, J = 17.5, 0.8 Hz, 1H), 5.27 (dd, J = 11.0, 0.7 Hz, 1H), 5.24 (s, 2H).
(ii) FKN4.
To a solution of FK506 (compound D) (10 mg, 0.012 mmol) and compound C (15.6 mg, 0.187mmol) in anhydrous dichloroethane (DCE) (3 ml) was added 10 mol% Hoveyda-Grubbs second-generation catalyst in anhydrous DCE (1 ml) at rt (34, 35). The reaction mixture was subjected to microwave irradiation for 5 min at 140°C with shaking. The mixture was filtered and thoroughly washed with DCM (washed five times with 3 ml of DCM each time). The filtrate was collected, concentrated, and resuspended in DMSO for liquid chromatography (LC)-mass spectroscopy (MS) analysis and purification. Yield: 30%. 1H-NMR (500 MHz, CDCl3) δ 8.31 to 8.25 (m, 1H), 7.77 to 7.72 (m, 1H), 7.46 to 7.35 (m, 8H), 6.82 (d, J = 7.3Hz, 1H), 6.36 (d, J = 15.5Hz, 1H), 6.13 to 6.01 (m, 1H), 5.27 (s, 1H), 5.17 (s, 2H), 5.07 to 4.97 (m, 3H), 4.60 to 4.56 (m, 1H), 4.37 (d, J = 14Hz, 1H), 4.20 (s, 1H), 3.95 to 3.77 (m, 2H), 3.65 to 3.60 (m, 1H), 3.55 to 3.47 (m, 1H), 3.37 to 3.29 (m, 13H), 2.99 to 2.90 (m, 2H), 2.79 to 2.70 (m, 1H), 2.64 to 2.50 (m, 2H), 2.32-2.18 (m, 4H), 2.06 to 2.0 (m, 2H), 1.78 to 1.65 (m, 5H), 1.65 to 1.54 (m, 14H), 0.94 to 0.84 (m, 9H), 0.84 to 0.80 (m, 3H). Mass spectrometry: found m/z = 1059.1. [M + Na]+, calculated 1036.3.
(iii) FKAM.
To a solution of FK506 (100 mg, 0.120 mmol) and 30 mol% Zhan1b ruthenium catalyst in 3 ml anhydrous DCE was added 4-allylmorpholine (18.1 μl, 0.132 mmol). The mixture was stirred for 30 s before microwave irradiation at 120°C for 20 min. The crude product was then purified using flash chromatography (0 to 25% gradient methanol [MeOH] in DCM), followed by preparative thin-layer chromatography (TLC) (9:1 DCM-MeOH). Yield: 25%. 1H-NMR (500 MHz, CDCl3) δ 5.51 (s, 2H), 5.33 (s, 1H), 5.19 (s, 1H) 5.12 to 4.98 (m, 2H), 4.60 to 4.40 (m, 1H), 3.98 to 3.85 (m, 1H), 3.75 to 3.65 (d, 5H), 3.61 to 3.56 (d, 1H), 3.42 to 3.32 (m, 8H), 3.3 (s, 2H), 3.05 to 2.89 (m, 3H), 2.76 to 2.65 (m, 2H), 2.43 (s, 5H), 2.35 to 2.25 (m, 2H), 2.20 to 2.12 (d, 2H), 2.10 to 1.93 (dd, 4H), 1.89 (s, 1H), 1.79 to 1.71 (m, 2H), 1.70 to 1.55 (m, 7H), 1.51 to 1.41 (m, 2H), 1.34 to 1.16 (m, 11H), 1.08 to 1.12 (d, 2H), 1.12 to 0.97 (d, 2H), 0.96 to 0.79 (dt, 9H). High-resolution mass spectrometry: found m/z = 903.5614. [M + H]+, calculated 903.5582.
ACKNOWLEDGMENTS
We thank Lindsey Hutt-Fletcher for providing cell lines.
Funding to support this work was from R21CA188824 (R.F.A.), R21AI101377 (S.D.H.), the Flight Attendant Medical Research Institute (J.O.L.), and the Johns Hopkins Institute for Clinical and Translational Research, which is funded in part by grant UL1 TR 001079 from the National Center for Advancing Translational Sciences (NCATS).
REFERENCES
- 1.Thorley-Lawson DA, Hawkins JB, Tracy SI, Shapiro M. 2013. The pathogenesis of Epstein-Barr virus persistent infection. Curr Opin Virol 3:227–232. doi: 10.1016/j.coviro.2013.04.005. [DOI] [PMC free article] [PubMed] [Google Scholar]
- 2.Longnecker R, Kieff E, Cohen JI. 2013. Epstein-Barr virus, p 1898–1959. In Knipe DM, Howley PM, Cohen JI, Griffin DE, Lamb RA, Martin MA, Racaniello VR, Roizman B (ed), Fields virology, 6th ed, vol 2 Lippincott Williams & Wilkins, Philadelphia, PA. [Google Scholar]
- 3.Faulkner GC, Burrows SR, Khanna R, Moss DJ, Bird AG, Crawford DH. 1999. X-linked agammaglobulinemia patients are not infected with Epstein-Barr virus: implications for the biology of the virus. J Virol 73:1555–1564. [DOI] [PMC free article] [PubMed] [Google Scholar]
- 4.Yang J, Tao Q, Flinn IW, Murray PG, Post LE, Ma H, Piantadosi S, Caligiuri MA, Ambinder RF. 2000. Characterization of Epstein-Barr virus-infected B cells in patients with posttransplantation lymphoproliferative disease: disappearance after rituximab therapy does not predict clinical response. Blood 96:4055–4063. [PubMed] [Google Scholar]
- 5.Takada K. 1984. Cross-linking of cell surface immunoglobulins induces Epstein-Barr virus in Burkitt lymphoma lines. Int J Cancer 33:27–32. doi: 10.1002/ijc.2910330106. [DOI] [PubMed] [Google Scholar]
- 6.Cen O, Longnecker R. 2015. Latent membrane protein 2 (LMP2). Curr Top Microbiol Immunol 391:151–180. doi: 10.1007/978-3-319-22834-1_5. [DOI] [PubMed] [Google Scholar]
- 7.Takada K, Horinouchi K, Ono Y, Aya T, Osato T, Takahashi M, Hayasaka S. 1991. An Epstein-Barr virus-producer line Akata: establishment of the cell line and analysis of viral DNA. Virus Genes 5:147–156. doi: 10.1007/BF00571929. [DOI] [PubMed] [Google Scholar]
- 8.Brown JR. 2013. Ibrutinib (PCI-32765), the first BTK (Bruton's tyrosine kinase) inhibitor in clinical trials. Curr Hematol Malig Rep 8:1–6. doi: 10.1007/s11899-012-0147-9. [DOI] [PMC free article] [PubMed] [Google Scholar]
- 9.Lannutti BJ, Meadows SA, Herman SE, Kashishian A, Steiner B, Johnson AJ, Byrd JC, Tyner JW, Loriaux MM, Deininger M, Druker BJ, Puri KD, Ulrich RG, Giese NA. 2011. CAL-101, a p110delta selective phosphatidylinositol-3-kinase inhibitor for the treatment of B-cell malignancies, inhibits PI3K signaling and cellular viability. Blood 117:591–594. doi: 10.1182/blood-2010-03-275305. [DOI] [PMC free article] [PubMed] [Google Scholar]
- 10.Dargart JL, Fish K, Gordon LI, Longnecker R, Cen O. 2012. Dasatinib therapy results in decreased B cell proliferation, splenomegaly, and tumor growth in a murine model of lymphoma expressing Myc and Epstein-Barr virus LMP2A. Antiviral Res 95:49–56. doi: 10.1016/j.antiviral.2012.05.003. [DOI] [PMC free article] [PubMed] [Google Scholar]
- 11.Goldfeld AE, Liu P, Liu S, Flemington EK, Strominger JL, Speck SH. 1995. Cyclosporin A and FK506 block induction of the Epstein-Barr virus lytic cycle by anti-immunoglobulin. Virology 209:225–229. doi: 10.1006/viro.1995.1247. [DOI] [PubMed] [Google Scholar]
- 12.Adamson AL, Le BT, Siedenburg BD. 2014. Inhibition of mTORC1 inhibits lytic replication of Epstein-Barr virus in a cell-type specific manner. Virol J 11:110. doi: 10.1186/1743-422X-11-110. [DOI] [PMC free article] [PubMed] [Google Scholar]
- 13.Li W, Bhat S, Liu JO. 2011. A simple and efficient route to the FKBP-binding domain from rapamycin. Tetrahedron Lett 52:5070–5072. doi: 10.1016/j.tetlet.2011.07.094. [DOI] [PMC free article] [PubMed] [Google Scholar]
- 14.Liu Q, Xu C, Kirubakaran S, Zhang X, Hur W, Liu Y, Kwiatkowski NP, Wang J, Westover KD, Gao P, Ercan D, Niepel M, Thoreen CC, Kang SA, Patricelli MP, Wang Y, Tupper T, Altabef A, Kawamura H, Held KD, Chou DM, Elledge SJ, Janne PA, Wong KK, Sabatini DM, Gray NS. 2013. Characterization of Torin2, an ATP-competitive inhibitor of mTOR, ATM, and ATR. Cancer Res 73:2574–2586. doi: 10.1158/0008-5472.CAN-12-1702. [DOI] [PMC free article] [PubMed] [Google Scholar]
- 15.Inman GJ, Binne UK, Parker GA, Farrell PJ, Allday MJ. 2001. Activators of the Epstein-Barr virus lytic program concomitantly induce apoptosis, but lytic gene expression protects from cell death. J Virol 75:2400–2410. doi: 10.1128/JVI.75.5.2400-2410.2001. [DOI] [PMC free article] [PubMed] [Google Scholar]
- 16.Tovey MG, Lenoir G, Begon-Lours J. 1978. Activation of latent Epstein-Barr virus by antibody to human IgM. Nature 276:270–272. doi: 10.1038/276270a0. [DOI] [PubMed] [Google Scholar]
- 17.Penn I. 1996. Cancers in cyclosporine-treated vs azathioprine-treated patients. Transplant Proc 28:876–878. [PubMed] [Google Scholar]
- 18.Burman K, Crawford DH. 1991. Effect of FK 506 on Epstein-Barr virus specific cytotoxic T cells. Lancet 337:297–298. doi: 10.1016/0140-6736(91)90905-5. [DOI] [PubMed] [Google Scholar]
- 19.Pinelli DF, Wakeman BS, Wagener ME, Speck SH, Ford ML. 2015. Rapamycin ameliorates the CTLA4-Ig-mediated defect in CD8+ T cell immunity during gammaherpesvirus infection. Am J Transplant 15:2576–2587. doi: 10.1111/ajt.13326. [DOI] [PMC free article] [PubMed] [Google Scholar]
- 20.Lucas CL, Kuehn HS, Zhao F, Niemela JE, Deenick EK, Palendira U, Avery DT, Moens L, Cannons JL, Biancalana M, Stoddard J, Ouyang W, Frucht DM, Rao VK, Atkinson TP, Agharahimi A, Hussey AA, Folio LR, Olivier KN, Fleisher TA, Pittaluga S, Holland SM, Cohen JI, Oliveira JB, Tangye SG, Schwartzberg PL, Lenardo MJ, Uzel G. 2014. Dominant-activating germline mutations in the gene encoding the PI(3)K catalytic subunit p110delta result in T cell senescence and human immunodeficiency. Nat Immunol 15:88–97. doi: 10.1038/ni.2771. [DOI] [PMC free article] [PubMed] [Google Scholar]
- 21.Chen C, Johnston TD, Jeon H, Gedaly R, McHugh P, Ranjan D. 2009. Cyclosporine promotes Epstein-Barr virus-infected human B-cell transformation assayed by three correlated assay methods. Transplant Proc 41:366–370. doi: 10.1016/j.transproceed.2008.10.085. [DOI] [PubMed] [Google Scholar]
- 22.Beatty PR, Krams SM, Esquivel CO, Martinez OM. 1998. Effect of cyclosporine and tacrolimus on the growth of Epstein-Barr virus-transformed B-cell lines. Transplantation 65:1248–1255. doi: 10.1097/00007890-199805150-00017. [DOI] [PubMed] [Google Scholar]
- 23.Trappe RU, Dierickx D, Zimmermann H, Morschhauser F, Mollee P, Zaucha JM, Dreyling MH, Duhrsen U, Reinke P, Verhoef G, Subklewe M, Huttmann A, Tousseyn T, Salles G, Kliem V, Hauser IA, Tarella C, Van Den Neste E, Gheysens O, Anagnostopoulos I, Leblond V, Riess H, Choquet S. 19 December 2016. Response to rituximab induction is a predictive marker in B-cell post-transplant lymphoproliferative disorder and allows successful stratification into rituximab or R-CHOP consolidation in an international, prospective, multicenter phase II trial. J Clin Oncol. Epub ahead of print. [DOI] [PubMed] [Google Scholar]
- 24.Miyashita EM, Yang B, Babcock GJ, Thorley-Lawson DA. 1997. Identification of the site of Epstein-Barr virus persistence in vivo as a resting B cell. J Virol 71:4882–4891. [DOI] [PMC free article] [PubMed] [Google Scholar]
- 25.Myklebust JH, Brody J, Kohrt HE, Kolstad A, Czerwinski DK, Walchli S, Green MR, Troen G, Liestol K, Beiske K, Houot R, Delabie J, Alizadeh AA, Irish JM, Levy R. 2017. Distinct patterns of B-cell receptor signaling in non-Hodgkin lymphomas identified by single-cell profiling. Blood 129:759–770. doi: 10.1182/blood-2016-05-718494. [DOI] [PMC free article] [PubMed] [Google Scholar]
- 26.Greenwell IB, Flowers CR, Blum KA, Cohen JB. 2017. Clinical use of PI3K inhibitors in B-cell lymphoid malignancies: today and tomorrow. Expert Rev Anticancer Ther 17:271–279. doi: 10.1080/14737140.2017.1285702. [DOI] [PubMed] [Google Scholar]
- 27.Grywalska E, Rolinski J, Pasiarski M, Korona-Glowniak I, Maj M, Surdacka A, Grafka A, Stelmach-Goldys A, Zgurski M, Gozdz S, Malm A, Grabarczyk P, Staroslawska E. 2015. High viral loads of Epstein-Barr virus DNA in peripheral blood of patients with chronic lymphocytic leukemia associated with unfavorable prognosis. PLoS One 10:e0140178. doi: 10.1371/journal.pone.0140178. [DOI] [PMC free article] [PubMed] [Google Scholar]
- 28.Liang JH, Gao R, Xia Y, Gale RP, Chen RZ, Yang YQ, Wang L, Qu XY, Qiu HR, Cao L, Hong M, Wang R, Wang Y, Fan L, Chen YY, Hu ZB, Li JY, Xu W. 2016. Prognostic impact of Epstein-Barr virus (EBV)-DNA copy number at diagnosis in chronic lymphocytic leukemia. Oncotarget 7:2135–2142. doi: 10.18632/oncotarget.6281. [DOI] [PMC free article] [PubMed] [Google Scholar]
- 29.Chen YA, Wang RC, Yang Y, Chuang SS. 2016. Epstein-Barr virus-positive diffuse large B cell lymphoma arising from a chronic lymphocytic leukemia: overlapping features with classical Hodgkin lymphoma. Pathol Int 66:393–397. doi: 10.1111/pin.12417. [DOI] [PubMed] [Google Scholar]
- 30.Xiao W, Chen WW, Sorbara L, Davies-Hill T, Pittaluga S, Raffeld M, Jaffe ES. 2016. Hodgkin lymphoma variant of Richter transformation: morphology, Epstein-Barr virus status, clonality, and survival analysis–with comparison to Hodgkin-like lesion. Hum Pathol 55:108–116. doi: 10.1016/j.humpath.2016.04.019. [DOI] [PMC free article] [PubMed] [Google Scholar]
- 31.Santos AH Jr, Casey MJ, Xuerong W, Womer KL. 2017. Association of baseline viral serology and sirolimus regimens with kidney transplant outcomes: a 14-year registry-based cohort study in the United States. Transplantation 101:377–386. doi: 10.1097/TP.0000000000001520. [DOI] [PubMed] [Google Scholar]
- 32.Molesworth SJ, Lake CM, Borza CM, Turk SM, Hutt-Fletcher LM. 2000. Epstein-Barr virus gH is essential for penetration of B cells but also plays a role in attachment of virus to epithelial cells. J Virol 74:6324–6332. doi: 10.1128/JVI.74.14.6324-6332.2000. [DOI] [PMC free article] [PubMed] [Google Scholar]
- 33.Nacev BA, Low WK, Huang Z, Su TT, Su Z, Alkuraya H, Kasuga D, Sun W, Trager M, Braun M, Fischer G, Zhang K, Liu JO. 2011. A calcineurin-independent mechanism of angiogenesis inhibition by a nonimmunosuppressive cyclosporin A analog. J Pharmacol Exp Ther 338:466–475. doi: 10.1124/jpet.111.180851. [DOI] [PMC free article] [PubMed] [Google Scholar]
- 34.Clemons PA, Gladstone BG, Seth A, Chao ED, Foley MA, Schreiber SL. 2002. Synthesis of calcineurin-resistant derivatives of FK506 and selection of compensatory receptors. Chem Biol 9:49–61. doi: 10.1016/S1074-5521(02)00085-6. [DOI] [PubMed] [Google Scholar]
- 35.Marinec PS, Evans CG, Gibbons GS, Tarnowski MA, Overbeek DL, Gestwicki JE. 2009. Synthesis of orthogonally reactive FK506 derivatives via olefin cross metathesis. Bioorg Med Chem 17:5763–5768. doi: 10.1016/j.bmc.2009.07.030. [DOI] [PMC free article] [PubMed] [Google Scholar]