

ABSTRACT
Scientific conferences are most beneficial to participants when they showcase significant new experimental developments, accurately summarize the current state of the field, and provide strong opportunities for collaborative networking. A top-notch slate of invited speakers, assembled by conference organizers or committees, is key to achieving these goals. The perceived underrepresentation of female speakers at prominent scientific meetings is currently a popular topic for discussion, but one that often lacks supportive data. We compiled the full rosters of invited speakers over the last 35 years for four prominent international virology conferences, the American Society for Virology Annual Meeting (ASV), the International Herpesvirus Workshop (IHW), the Positive-Strand RNA Virus Symposium (PSR), and the Gordon Research Conference on Viruses & Cells (GRC). The rosters were cross-indexed by unique names, gender, year, and repeat invitations. When plotted as gender-dependent trends over time, all four conferences showed a clear proclivity for male-dominated invited speaker lists. Encouragingly, shifts toward parity are emerging within all units, but at different rates. Not surprisingly, both selection of a larger percentage of first-time participants and the presence of a woman on the speaker selection committee correlated with improved parity. Session chair information was also collected for the IHW and GRC. These visible positions also displayed a strong male dominance over time that is eroding slowly. We offer our personal interpretation of these data to aid future organizers achieve improved equity among the limited number of available positions for session moderators and invited speakers.
IMPORTANCE Politicians and media members have a tendency to cite anecdotes as conclusions without any supporting data. This happens so frequently now, that a name for it has emerged: fake news. Good science proceeds otherwise. The underrepresentation of women as invited speakers at international scientific conferences exemplifies a present-day discussion topic usually occurring without facts to support or refute the arguments. We now provide records profiling four prominent virology conferences over the years 1982 to 2017 with the intention that the trends and accompanying analyses of the gender parity of invited speakers may allow the ongoing discussions to be informed.
KEYWORDS: implicit bias, gender, conference programs, speaker lists, scientific visibility
INTRODUCTION
Scientists attend conferences to learn about new developments in the field, present their data, and establish or renew collaborations that can enhance their research. It is the responsibility of conference organizers to assemble from the full field of practitioners a cogent program with breadth, relevance, and vitality. This goal is achieved in large part through substantive oral presentations as keynote, plenary, or symposia talks. Such talks are almost always delivered by acknowledged leaders in the field drawn from established midcareer or senior level principal investigators (PIs). Fresh viewpoints are provided by newer investigators giving, perhaps, their first presentation at that specific conference. Each major virology meeting series has their own distinct culture directed by tradition or charter, and thus has different preferred mechanisms to select invited speakers and achieve their unique aims of an ideal program.
Any roster of invited speakers is necessarily limited by the number of slots available and by the organizers' access to funds that support registration and travel expenses for the invitees. Therefore, the high-profile talks are almost always complemented with shorter talks and poster sessions configured from participant-submitted abstracts. While such short talks are a measure of success for graduate students and postdoctoral fellows, for PIs they are accorded a lower cachet than the more visible invited speaker slots. Professional advancement and promotion as well as peer-review of grants and papers are decidedly sensitive to the distinctions between invited and abstract-awarded talks. Consequently, invitations to speak at high-level symposia are richly sought after, listed on curricula vitae, and are commonly viewed as personally earned professional recognition. Importantly, when new investigators are included, they can leverage such visibility into program credibility.
Opinions about the success of a particular conference or series will certainly vary among individual attendees, influenced by everything from the science itself, to the venue, the food, and even the weather. Speaker selection, though, is a popular topic of discussion because inclusion carries weight and influences careers. Alleged inequities with regard to the gender or minority status of invited speakers are often murmured sub rosa at meetings. Suggestions of implicit biases (personal or collective), ignorance of conference history, an unwillingness to embrace change, and misunderstandings about the underlying financial restrictions inherent to conference organization provide grist to perceptions and hearsay.
To separate fact from fiction, we tabulated the invited speaker histories of four major virology conferences, the American Society for Virology Annual Meeting (ASV), the International Herpesvirus Workshop (IHW), the Positive-Strand RNA Virus Symposium (PSR), and the Gordon Research Conference on Viruses & Cells (GRC). Similar analyses for other biological fields have recently been published (1, 2). The goal was to document whether speaker trends supported a preference for a particular cohort, and if so, whether this preference was persistent within an individual conference series and/or pervasive across different series. The name of each speaker in each session was transcribed, formatted, and standardized (alternate spellings, abbreviations, nicknames, etc.), cataloged by type of talk (symposium, keynote, named, etc.), and cross-indexed by gender as assigned by our knowledge of that individual or online public sources. Correlative minority information was, unfortunately, not available, but could and should be collected during the registration process to permit a similar analysis for underrepresented minorities. Plots of the percentage of male or female speakers over time demonstrated a long-term, strong dominance of male selections at all four virology conferences. Encouragingly, recent trends also show clear shifts toward (but not reaching) parity. Conferences more rapidly approaching gender parity integrated more first-time speakers, both male and female. Years in which at least one woman participated in speaker selection also showed greater gender parity. These speaker lists, previously published “rules to achieve conference speaker gender balance” (3), and our personal reflections presented here will hopefully stimulate an informed dialogue in both classrooms and conference organizational meetings regarding invited speaker diversity and gender parity at scientific symposia.
RESULTS
Composite data set descriptions.
We collected 4,026 entries representing 92 meetings from 1982 to 2017, covering ASV (24 keynote, 674 symposia, 7 Junior Investigators, 296 State-of-the-Art [SOA]), IHW (114 keynote, 423 symposia, 1,102 chairs), PSR (11 keynote, 428 long, 227 short), and GRC (6 keynote, 404 long, 150 short, 160 discussion leaders). The data include 2,387 separate invited talks delivered by 1,080 unique individuals. Gender was identified for every name.
Over the 35 years covered by this study, the total number of people who delivered invited talks at ASV (with SOA) is 643. For IHW it is 264, for PSR it is 263, and for GRC it is 286. We generated a Venn diagram (Fig. 1) to display the degree to which the individual unit's invited rosters were insular or overlapping. The majority (73%) of individuals (788 unique names) appeared on only one roster. For multiply listed names, GRC is by far the most catholic, with 70% of their invited speakers also receiving invitations to at least one of the other conferences. The PSR (43%) and ASV (41%) showed slightly higher cross-listing than the IHW (35%). Speakers from other conferences were more often cross-listed with ASV (263 speakers) than with any other conference (GRC, 200; PRS, 113; IHW, 92).
FIG 1.
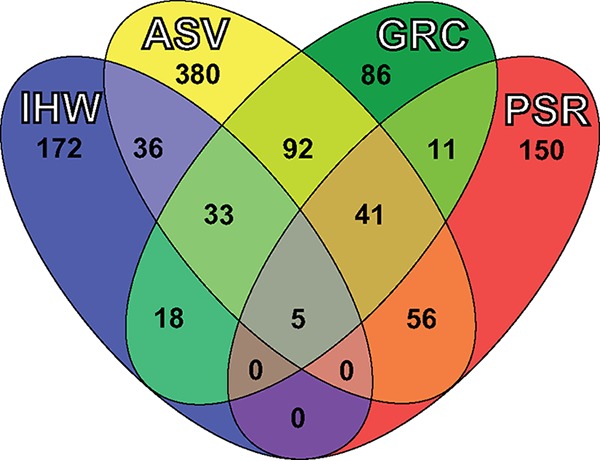
Inclusivity and exclusivity of the ASV, IHW, PSR, and GRC invited speaker programs. The nonredundant “major” speaker names for each conference were counted and are displayed with overlaps in a Venn diagram.
The four conferences we focused on are not the only virology meeting series. Our time-dependent tabulation of gender distribution here does not reflect or predict the behavior of other conferences. To emphasize this point, we analyzed each series individually.
The American Society for Virology Annual Meeting.
Since its inception in 1981, the charter-based agenda of ASV has promoted and supported an Annual Meeting covering the many disciplines of virology (4). Our data come from hard copy abstract books from 1982 to 2013 and from online sources for 2014 to 2017 (books are no longer printed). Breadth and generic appeal are emphasized for the invited keynote and plenary sessions, which are fixed at 18 to 22 invitations per year (Fig. 2A, “ASV Speakers”). Specialty functions are achieved through multiple workshops and posters populated with abstract submitters (∼900 per year), and also by an invited series of State-of-the-Art talks (6 to 8 per year), initiated in 1983. A single keynote speaker and the plenary candidates are proposed by the member-elected ASV President. The Program Chair, appointed by the elected Council, suggests SOA speakers. Both slates require Council ratification. Local organizers have no role in selecting invited speakers. From 2013 onward, 2 invited Junior Investigator talks were added each year to the plenaries, as selected from membership-wide nominations. All invited speakers have their full meeting expenses reimbursed, including travel. Records from the First Annual Meeting (Bill Joklik, personal communication) suggest an attendance of 1,000, which since has steadied at 1,300 to 1,600 in the current decade. The archives count members (∼43%, senior level professionals), nonmembers (∼25%), and graduate students (∼32%) as the composite attendance. Attendee demographics have never been solicited, but registrant lists from the 2006 and 2012 meetings in Madison give similar breakdowns of 52 to 53% male and 47 to 48% female, according to first names commonly associated with gender (>66% classified).
FIG 2.
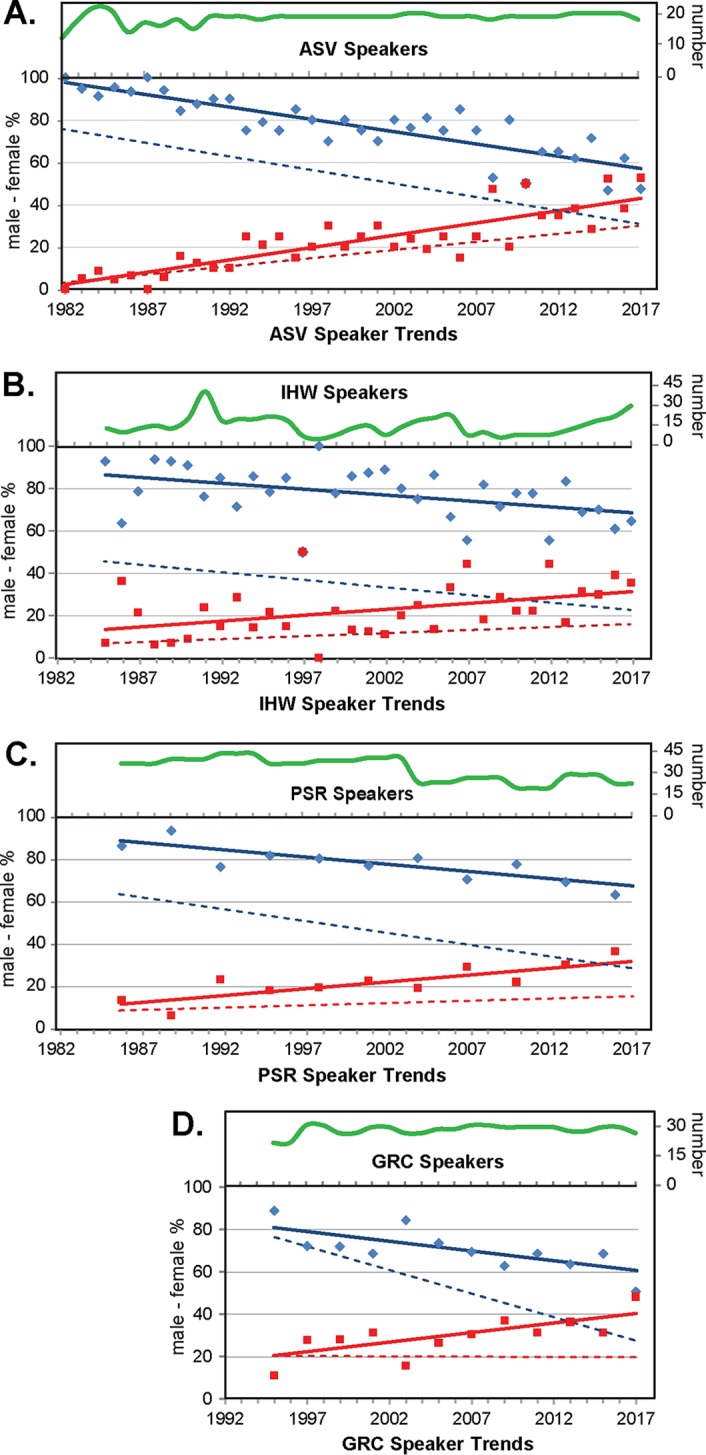
Time-dependent, gender-specific trends of the ASV, IHW, PSR, and GRC major invited speakers. “Major” speaker names were assembled, identified by gender, and plotted for the ASV (A), IHW (B), PSR (C), and GRC (D) series as described in Materials and Methods. The upper (green) lines track the absolute number of speakers per year. Male (blue diamonds) and female (red squares) contributors to each program are shown as the percentage of total speakers for that year. Solid blue (male) and red (female) lines plot the linear regressions of these values. Parallel plots on the same scale (not shown) similarly recorded first-time male and female speakers. Linear regressions of these values (male, dashed blue lines; female, dashed red lines) are plotted.
For the full series (1982 to 2017), 77% of invited plenary/keynote talks were delivered by men and 23% by women. Yearly distributions of men and women are depicted in Fig. 2A. The lowest percentage of invited female plenary speakers was 0% (1982, 1987) and the highest was 53% (2017). When parsed by decade, the data show the inclusion of women progressed from 6% in the 1980s to 19% in the 1990s to 25% in the 2000s to 41% in the 2010s. The solid trend lines are visual aids reflecting the progression of invited speaker demographics over time, and illustrate a move toward, but not reaching, gender parity. While such lines are helpful for discussion purposes, they cannot predict the composition of future programs. We note however, that at the current pace of program evolution, the series might expect to see sustainable invited speaker gender parity (the intersection of the male and female trendlines at 50%) around the year 2024.
The historic dominance of males (Fig. 2A) includes first-time speakers and reinvitations to previous presenters. List sorting can distinguish these. In the early years of a conference, most speakers will be first-time invitees. Therefore, we analyzed repeated invitations over only the last half of each seminar series. For the last half of this series history the percentage of repeat male speakers was 29% (2000 to 2008) and 18% (2009 to 2017). Over the entire series, 18 men spoke at least 4 times, 12 of whom gave 5 or more talks. The percentage of repeat female speakers was 11% (2000 to 2008) and 9% (2009 to 2017). Over the entire series, 4 women spoke 4 times, and no woman has given 5 or more talks. For ASV plenaries, men receive more repeat invitations than women. The percentage of first-time speakers (male and female combined; see individual dashed trendlines in Fig. 2A) was 60% (2000 to 2008) and 73% (2009 to 2017). The percentages of speakers that are new females were 14% (2000 to 2008) and 29% (2009 to 2017). Selecting more first-time speakers correlates with improved gender parity.
ASV State-of-the-Art (SOA) speakers are selected with the express purpose of showcasing junior or midlevel professionals who are making an impact in their specialty fields. The 30-min talks are interspersed within workshop sessions, but are often attended by the majority of meeting participants. The SOAs were conceived to be career-launching talks, and indeed 40% of the speakers have gone on to present an ASV plenary within the next 7 years.
For the full series (1983 to 2017), 71% of SOA talks were delivered by men and 29% by women. Yearly distributions with trend lines are depicted in Fig. 3. The lowest percentage of invited female SOA speakers was 0% (1989) and the highest was 71% (2008). When parsed by decade, the data show the inclusion of women progressed from 15% in the 1980s, to 31% in the 1990s and 2000s, and up to 45% in the 2010s. The trendlines converge in 2016 indicating the evolution of this program has reached a state of invited speaker parity that should be sustainable. For the last half of this series history, the percentage of repeat male SOA speakers was 6% (2000 to 2008) and 8% (2009 to 2017). Over the entire series, 20 men spoke at least 2 times, 5 of whom gave 3 talks. The percentage of repeat female SOA speakers was 5% (2000 to 2008) and 0% (2009 to 2017). Over the entire series, 6 women spoke 2 times, 1 of whom gave 4 talks. The percentage of first-time speakers (male and female combined; see individual dashed trendlines in Fig. 3A) was 90% (2000 to 2008) and 91% (2009 to 2017). The percentages of speakers that are new females were 25% (2000 to 2008) and 45% (2009 to 2017). The ASV SOAs actively promote, as a guiding principle, the selection of first-time speakers, which likely contributes to their recent success at achieving gender parity.
FIG 3.
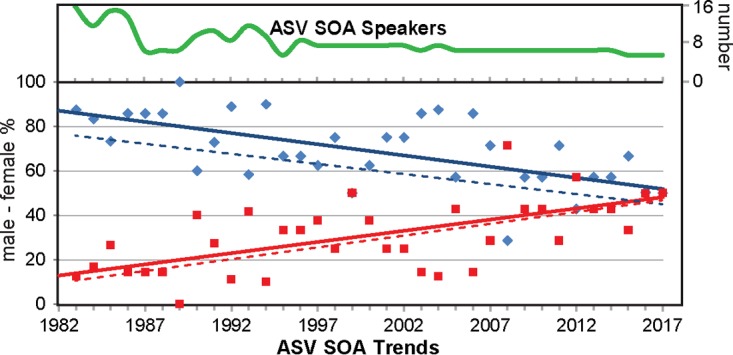
ASV SOA time-dependent, gender-specific invited speaker trends. SOA speaker names were assembled, identified by gender, and plotted. The upper (green) lines track the absolute number of speakers per year. Male (blue diamonds) and female (red squares) contributors to each program are shown as the percentage of total speakers for that year. Solid blue (male) and red (female) lines plot the linear regressions of these values. Parallel plots on the same scale (not shown) similarly recorded first-time male and female speakers. Linear regressions of these values (male, dashed blue lines; female, dashed red lines) are plotted.
The International Herpesvirus Workshop.
With the exception of 1975, an international-based conference dedicated to herpesvirus research has convened annually since 1971. Earlier organizational formats coalesced in 1983 to assume the current IHW name. Our speaker and chair data for this series are derived from participant-issued program books for 1985 to 2016, and from the website describing the 2017 meeting. Organizers and their chosen site are voted on by email ballot by all previous and established future organizers approximately 4 years in advance. Historically, two consecutive meetings are held in North America followed by one international conference. The organizers (generally 2 or 3 individuals) assemble a 5- to 10-member Local Organizing Committee whom they can consult for any purpose. The organizers select the number of invited speakers, which has recently varied between as few as 9 and as many as 31. The organizers also select the identity of most of the invited speakers, who generally are not financially supported. Specific guidance for speaker selection is not codified, but it is generally assumed that all classes of herpesviruses (alpha, beta, and gamma) should be represented. Approximately 3 speakers per year are invited to give named lectures that are financially supported by privately held endowments. For example, a lectureship honoring Dr. Priscilla Schaeffer is sponsored by a donation-based trust. The founding members of the Priscilla Schaeffer Trust, a group of her former trainees and colleagues, are charged with each annual selection. The organizers also select an approximately 50-member Scientific Advisory Board (SAB) to review the submitted abstracts. Assignment of presentation format for the abstracts (short talks or posters) is decided by the Organizers based in large part on the review scores assigned by the SAB. Once a larger meeting (the 1997 roster was 849 attendees), recent registration numbers have stabilized between 450 and 600. In 2016 there were 541 attendees. Tabulation of the 1997 roster estimates that 37% of the attendees were female and 63% male (>79% classified). In 2016 registrants were asked to self-identify for gender, with 42% selecting female, and 58% male (>78% of registrants responded).
For the series years analyzed (1985 to 2017), 77% of invited talks were delivered by men and 23% by women, similar to the ASV plenaries. Yearly distributions are depicted in Fig. 2B. The lowest percentage of invited female speakers was 0% (1998) and the highest was 50% (1997). When parsed by decade, the data show the inclusion of women progressed from 14% in the 1980s to 20% in the 1990s to 22% in the 2000s to 32% in the 2010s. The solid trendline illustrates a move toward invited speaker gender parity, which, at the current pace of program evolution, and for discussion purposes only, might expect to be sustainably achieved around the year 2042.
For the last half of this series history the percentage of repeat male speakers was 50% (2000 to 2008) and 34% (2009 to 2017). Over the entire series, 21 men spoke at least 5 times, 4 of whom gave 8 or more talks. The percentage of repeat female speakers was 11% (2000 to 2008) and 12% (2009 to 2017). Over the entire series, 8 women spoke at least 4 times, 3 of whom gave 7 talks each. These 8 women represent 35% of all talks delivered by women. The percentage of first-time speakers (male and female combined; see individual dashed trendlines in Fig. 2B) was 39% (2000 to 2008) and 54% (2009 to 2017). The percentages of speakers that are new females were 11% (2000 to 2008) and 20% (2009 to 2017). Whether due to culture or the smaller speaker pool compared to broad conferences like ASV (or both), the IHW recycles many of the same speakers year after year.
Visibility at IHW meetings is also achieved by service as a session chair. The organizers select these individuals from registrant lists and they are noted in the program. Our chair listings are complete since 1997, but the records are only partial from 1985 to 1996. Within this context (1,102 entries, 1985 to 2016), 74% of IHW session chairs were men and 26% were women. Yearly distributions are depicted in Fig. 4A. The lowest percentage of female session chairs was 7% (1989) and the highest was 45% (2016). When parsed by decade, the data show the inclusion of women progressed from 18% in the 1980s to 27% in the 1990s, decreased to 23% in the 2000s, and increased again to 32% in the 2010s. The solid trendline illustrates a move toward session chair gender parity, which, at the current pace of program evolution, and for discussion purposes only, might expect to be sustainably achieved around the year 2044.
FIG 4.
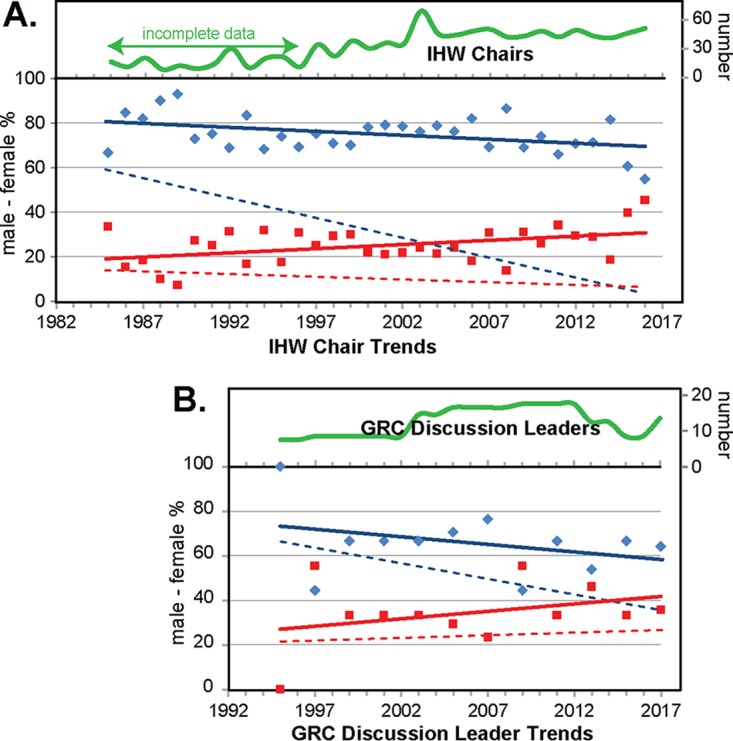
IHW and GRC time-dependent, gender-specific session chair trends. Session chair names for the IHW (A) or discussion leader names for the GRC (B) were assembled, identified by gender, and plotted. The upper (green) lines track the absolute number of chairs/leaders per year. Male (blue diamonds) and female (red squares) contributors to each program are shown as the percentage of total chairs/leaders for that year. Solid blue (male) and red (female) lines plot the linear regressions of these values. Parallel plots on the same scale (not shown) similarly recorded first-time male and female chairs/leaders. Linear regressions of these values (male, dashed blue lines; female, dashed red lines) are plotted. For the IHW from 1985 to 1996, only program sessions listed as “symposia” are included. Additional “workshop” chair information was unavailable (labeled as “incomplete data” on the graph).
For the last half of this series history the percentage of repeat male session chairs was 58% (2000 to 2008) and 54% (2009 to 2017). The percentage of repeat female session chairs was 18% (2000 to 2008) and 23% (2009 to 2017). The percentage of first-time session chairs (male and female combined; see individual dashed trendlines in Fig. 4A) was 24% (2000 to 2008) and 23% (2009 to 2017). The percentages of session chairs that are new females were 4% (2000 to 2008) and 9% (2009 to 2017). In a specialty field with a long running conference like herpes, first-time session chairs are most likely to be newly minted PIs. The data then indicate that new PIs, especially women, are practically invisible within the current chair invitation format. They are not gaining exposure through chairing sessions, perhaps contributing in part to the low numbers being selected for invited talks.
The International Symposium on Positive-Strand RNA Viruses.
The PSR has met at 3-year intervals since 1986. The first meeting was organized under the auspices of a Keystone Conference, reverting back to that umbrella in 2013 and 2016. The intervening years (1989 to 2010) were chaperoned by the generous personal involvement of Professor Margo Brinton at Georgia State University, in consultation with a panel of rotating Advisory Committees (ACs), selected at each meeting from the leaders in the field. Our data are from hard copy abstract books from 1986 to 2016, and from personal organizational records. Over 11 iterations, 3 of which were held in Europe, the speaker slate of long talks averaged 39 per year. These are selected by consensus nominations from the AC (de novo or from submitted abstracts), with required attention to topic distributions over multiple virus types (plant, bacterial, animal), genera (e.g., flavivirus, picornavirus, etc.), topics (replication, virus-host, etc.), and international origin (Asia, Europe, South America) of the laboratories. Gender is an additional discussion component. All keynote and many of the long talk participants are reimbursed, fully or in part, from funds raised from conference sponsors or grants. The first PSR in 1986 had 134 registrants, while the 2004, 2007, and 2010 meetings had between 423 and 454 registrants. Demographic estimates indicate that early meetings had about 80% male and 20% female attendees, whereas current meetings are closer to 60% male and 40% female.
For the full series (1986 to 2016), 79% of invited talks were delivered by men and 21% by women, similar to ASV plenaries and the IHW. Yearly distributions of men and women are depicted in Fig. 2C. The lowest percentage of invited female speakers was 6% (1989) and the highest was 39% (2016). When parsed by decade, the data show the inclusion of women progressed from 10% in the 1980s to 21% in the 1990s to 24% in the 2000s to 31% in the 2010s. The solid trendline illustrates a move toward invited speaker gender parity, which, at the current pace of program evolution, and for discussion purposes only, might expect to be sustainably achieved around the year 2052. Some part of this lag may result from the lower frequency with which this meeting is held.
For the last half of this series history the percentage of repeat male speakers was 35% (2001 to 2016). Over the entire series, 9 men spoke at least 5 times, 2 of whom gave 7 or more talks. The percentage of repeat female speakers was 12% (2001 to 2016). Over the entire series, 4 women spoke at least 5 times, 1 of whom gave 7 talks. These 4 women represent 26% of all talks delivered by women. The percentage of first-time speakers (male and female combined; see individual dashed trendlines in Fig. 2C) was 53% (2001 to 2016). The percentage of speakers that are new females was 15% (2001 to 2016). First-time male speakers are invited into this series more than twice as often as first-time female speakers.
The Gordon Research Conference on Viruses and Cells.
The Gordon Research Conference on Viruses & Cells has met on a biannual basis since 1995, at a variety of national and international (European) Gordon Conference venues. Our data sets drew on full conference programs posted online, from 1995 to 2017. The invited speaker slate at any given meeting is selected by that year's Chair in consultation with the Vice Chair, who automatically becomes the Chair of the next conference iteration. A new Vice Chair in this overlapping leadership rotation is elected at each meeting from individuals present, nominated, and willing, with the caveat that the Chair and Vice Chair must have research specialties alternating between RNA and DNA virus types. Typically, speaker rosters center at about 34 per year (Fig. 2D). After each meeting, invited speakers are reimbursed in full or in part depending upon the success of the Chair's and Vice Chair's fundraising campaign. Demographic information was generously supplied by Katie Lamb, Conference Operations Associate for GRC. For 2015 they report 177 registrants, 47% female and 53% male. Over the last 6 meetings (2005 to 2015), the general participation was similar, averaging 170 conferees per year, 41% female and 59% male.
For the full series (1995 to 2017), 70% of invited talks were delivered by men and 30% by women. While this ratio is the highest overall frequency of women within conferences we studied, one must consider this meeting began more than a decade later than ASV, IHW, or PSR. Over the time period of the GRC, this ratio is comparable to ASV (70% male/30% female) and exceeds the IHW and PSR (both 75% male/25% female). Yearly distributions of men and women are depicted in Fig. 2D. The lowest percentage of invited female speakers was 11% (1995) and the highest was 44% (2017). When parsed by decade, the data show the inclusion of women progressed from 23% in the 1990s to 29% in the 2000s to 36% in the 2010s. The solid trendline illustrates a move toward invited speaker gender parity, which, at the current pace of program evolution, and for discussion purposes only, might expect to be sustainably achieved around the year 2023.
For the last half of this series history, the percentage of repeat male speakers was 27% (2007 to 2017). Over the entire series, 24 men spoke at least 3 times, 6 of whom gave 4 talks each. The percentage of repeat female speakers was 14% (2007 to 2017). Over the entire series, 4 women spoke at least 3 times, 2 of whom gave 4 talks each. The percentage of first-time speakers (male and female combined; see individual dashed trendlines in Fig. 2D) was 59% (2007 to 2017). The percentage of speakers that are new females was 21% (2001 to 2016).
Each component session of a GRC is moderated by 1 or 2 discussion leaders selected by the Chair and Vice Chair from among the list of registrants. As visible positions within this conference, we compiled the list of discussion leaders from 1995 to 2017. In total, 65% of GRC discussion leaders were men and 35% were women. Yearly distributions are depicted in Fig. 4B. The lowest percentage of female discussion leaders was 0% (1995) and the highest was 56% (1997 and 2009). When parsed by decade, the data show the inclusion of women progressed from 31% in the 1990s to 36% in the 2000s to 37% in the 2010s. The solid trendline illustrates a move toward discussion leader gender parity, which, at the current pace of program evolution, and for discussion purposes only, might expect to be sustainably achieved around the year 2038.
For the last half of this series history the percentage of repeat male discussion leaders was 18% (2007 to 2017). The percentage of repeat female discussion leaders was 11% (2007 to 2017). The percentage of first-time discussion leaders (male and female combined; see individual dashed trendlines in Fig. 4B) was 71% (2007 to 2017). The percentage of discussion leaders that are new females was 27% (2007 to 2017). The recent incorporation of first-time discussion leaders at GRC meetings is clearly evident.
First-time speakers correlate with but do not guarantee parity.
One qualitative observation from the presented data is that conference series that do a better job incorporating first-time speakers into their programs have better parity. This is not surprising considering the repeat speaker pool is 76% male. To quantitate how incorporation of first-time speakers correlated with gender composition, we focused on the ASV plenary talks from the 18 years (2000 to 2017) representing the last half of the series. For each individual year, the percentage of total male speakers was plotted as a function of the percentage of total first-time speakers (Fig. 5A). Data points representing the highest fraction of first-time speakers appear as filled symbols, and those representing the lowest fraction of first-time speakers appear as open symbols. Analyzing these individual cohorts (Fig. 5B) reveals that better average parity (60%) was achieved by the nine meetings with the most first-time speakers than by the nine with the fewest first-time speakers (76%). Of course, simply selecting first-time speakers does not guarantee parity, as the outliers in the plot demonstrate (Fig. 5A). In fact, when we documented the accumulation of all 1,080 first-time speakers according to their initial appearance on any program (Fig. 5C), we discovered that new men (∼22/year) are accumulating three times faster than new women (∼7/year). Thus, selecting first-time speakers affords a better opportunity to achieve parity, but speakers must still be chosen judiciously.
FIG 5.
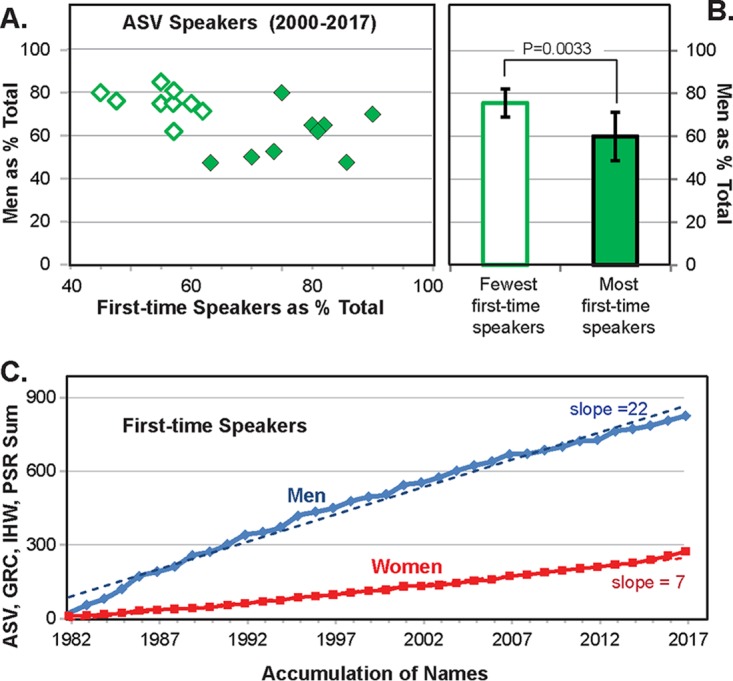
ASV conferences with more first-time speakers show better gender parity. (A) The percentage of male ASV symposia and keynote speakers for each year from 2000 to 2017 is plotted as a function of the percent first-time speakers (male and female combined). Individual points on the scatter plot are differentiated as belonging to the years with the highest (filled symbols) or lowest (open symbols) percentages of first-time speakers. (B) For the highest and lowest first-time speaker cohorts, the average percentage of male speakers is plotted. The error is ±1 standard deviation. An unpaired Student t test measured the statistical significance of the difference. (C) The cumulative summation of new individuals (male, blue; female; red) appearing in ASV, SOA, IHW, PSR, or GRC major speaker rosters is plotted as a function of the year (solid lines). Linear regressions of these values (male, dashed blue lines; female, dashed red lines) are plotted and were used to calculate the slopes. R2 = 0.985 (male) and 0.989 (female).
Female representation on speaker selection committees correlates with better gender parity.
For the General Meeting of the American Society for Microbiology (ASM), session conveners select the invited speakers. For the years 2011, 2012, and 2013, sessions convened by all men contained, on average, 25% female speakers while sessions convened by teams including at least one woman contained, on average, 43% female speakers (5). Thus, having a woman as part of the speaker selection process correlated with a 72% increase in female invited speakers at the ASM General Meeting.
We performed a similar analysis for the ASV, IHW, and GRC meetings. ASV meetings were divided into those in which the President was a man (24 meetings) or a woman (11 meetings). IHW meetings were divided into those in which all of the organizers were men (16 meetings) or those in which the organizing team contained at least one woman (17 meetings). GRC meetings were divided into those in which the Chair was a man (6 meetings) or a woman (6 meetings). The nearly equal distribution between male-only or female-inclusive selectors permitted a meaningful statistical analysis (this was not the case for the PSR, in which only 2 of the 11 meetings had male-only selection teams, and therefore that meeting was not considered here). The results mirrored the ASM General Meeting (5). Male ASV Presidents presided over meetings that averaged 19% female speakers, while female Presidents presided over meetings that averaged 31% female speakers (Fig. 6). For IHW, men-only teams organized meetings that averaged 18% female speakers while teams with women organized meetings that averaged 26% female speakers (Fig. 6). Male GRC chairs assembled speaker rosters that averaged 24% female speakers while female Chairs assembled speaker rosters that averaged 35% female speakers (Fig. 6). Thus, having a woman as part of the speaker selection process correlated with an increase in female invited speakers by 63% for ASV, 44% for IHW, and 46% for GRC.
FIG 6.
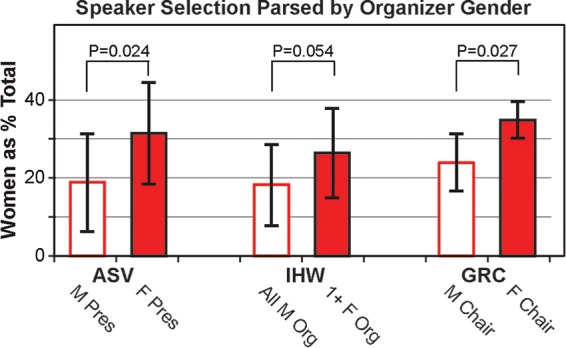
Female participation in speaker selection correlates with improved gender parity. The indicated conference series were each divided into years in which the individuals or committees that chose the invited speakers were exclusively male (open bars) or had female representation (filled bars). The average female speaker representation (% of total) for each subgroup is plotted. The error is ±1 standard deviation. An unpaired Student t test measured the statistical significance of the difference.
DISCUSSION
Our data collections demonstrate that the strong, sustained dominance of men as the majority of invited speakers at these four virology conferences is beginning to decay. This progression toward parity is incomplete but encouraging, and with attention and thoughtfulness, can and should continue. The purpose of this study is not to be punitive to past organizers, but informative for future organizers and hopefully transformative for the field. While the past was bleak, the future is promising.
The genesis of our analysis was 2-fold. First, in 2007 in preparation for the upcoming ASV Annual Meeting, A. C. Palmenberg compiled a list of invited ASV speakers covering the preceding ∼10 years, thereby documenting that unit's gender imbalance and speaker recycling. Second, in 2015 in preparation for the upcoming IHW, A. C. Palmenberg and R. F. Kalejta compiled a list of invited IHW speakers covering the preceding ∼20 years, which showed similar gender imbalance and speaker recycling. Those data were presented (by A. C. Palmenberg) at the 2016 IHW, after which we were encouraged by colleagues to expand and publish our findings. Below we discuss five lessons we learned not only from this exercise, but also from excellent previous publications on this topic (1, 2, 3, 5), and as reinforced by personal experiences as meeting organizers and, for A. C. Palmenberg, her leadership roles in the ASV. We hope this collection of data and its analysis and discussion will stimulate ongoing conversations regarding our shared professional responsibilities to craft inclusionary climates that benefit all virologists.
Lesson number 1: Invited female speakers underrepresent conference demographics. The underrepresentation of women as invited speakers at virology conferences is a real phenomenon; it is a problem that we must collectively acknowledge and collectively fix. The data are clear. Our historical record is not one to be proud of. Optimistically though, the most recent years show sustained evidence of positive change. In 2017, both the ASV and GRC will present invited speaker programs less than 60% male, and all four conferences are trending toward parity (even if the approach rate for some is glacial). But should parity (a 50/50 split) be the ultimate goal when attendance pools show 40:60 or 45:55 female-to-male ratios? Is equity (fair representation) more appropriate? If so, should this equity in invited speaker gender reflect the demographic distribution of the conference registrants or the pool of PIs from which the overwhelming majority of invited speakers are chosen? If PI demographics were to be used as the metric, such data would need to be compiled and annotated with subfield specialties. Online conference registration engines and annual ASV membership applications have the capability to collect and curate such data. As our analysis here clearly demonstrates, access to the underlying data is powerful. Thus, gathering demographic data correlated with PI status should be an intrinsic part of such processes. Women have an absolute right to, and should expect, equivalent selection standards. However, inclusion for the sake of quotas can be as demeaning as exclusion based on bias, and the quality of the science presented must stay at the very forefront of invited speaker selections. Future organizers will need to tackle these questions, but the days of woefully unbalanced programs should be forever behind us.
Lesson number 2: Transparency is the medium for growth. The documented history of female underrepresentation became known to ASV organizers before the 2008 meeting and to IHW organizers before the 2016 meeting. Those hard data made an immediate impact, as can be seen on the graphs (Fig. 2A and B). For ASV, an informed questioning of speaker composition has been consistently maintained over the last decade. The IHW, PSR, and GRC are now presented with the same opportunity to accelerate their transformations to equitable programs. The lists not only catalog the history of individual speakers for a specific conference, they are a unique and invaluable resource, making it simple for any organizer to determine, for any potential speaker, how many times they have already spoken at a conference and the interval since their last invitation. They can also remind organizers of individuals who have not spoken for some time, and who may have something new to contribute. Moreover, the lists from other meetings may help organizers become aware of first-time outside speakers for their conferences, whether they are recently minted PIs or established investigators venturing into new territory.
Lesson number 3: Resolution requires teamwork. Organizers need to try harder to achieve gender parity; constituents need to make their jobs easier. For the 2016 IHW, seven women (and three men) declined invitations to speak. Alternative individuals with similar demographics (gender, geography, etc.) were unavailable (or unapparent) and thus the slots were filled with speakers who compromised the intended level of diversity. This is not uncommon. Studies from other fields suggest that women do turn down speaker invitations more frequently than men (1). Women (and men) decline invitations for perfectly valid reasons, including previously scheduled commitments, family obligations, or a lack of funding for travel. Senior, highly renowned women are tapped relentlessly for speaker slots even outside their fields, creating huge time and financial burdens that are difficult to meet.
Women declining invitations to speak clearly does not create the gender parity problem, but it does put the onus on the organizers to identify a suitable replacement to maintain the intended level of gender parity. When the author of a previous study (2) was asked by one of us (A. C. Palmenberg) what to do if an effort to identify and secure female speakers flounders, the answer was simple and concise: “try harder.” We agree that it is the organizer's responsibility to put in every effort to assemble an equitable program. But we also add that the virology community must take steps, individually and collectively, to help make this happen. Accept an invitation if inclusion promotes parity and diversity, and decline it if it does not. If you must decline for any reason, be ready with a list of suitable replacements populated with new and diverse names. Proactively contact future organizers with suggestions for individuals or topic-oriented groups that promote first-time speakers and gender equity. Lobby conference hierarchies to set aside funds specifically to cover the expenses of first-time speakers and those who increase parity and decrease repetitiveness. Most importantly, each unit should consider creating evolving rosters of their virologists listing research specialties and gender. While it would be a Herculean task to generate and maintain such lists, a stable administrative unit, such as the ASV, might be suited for such an important responsibility. If unbalanced programs are to be a vestige of the past, then the time for grumbling after the fact is over. Proactive efforts are needed from everyone to ensure equitable future programs.
Lesson number 4: Expectations define character. The virology conferences we studied have traditions and organizational structures that have evolved relatively little over the last 30 years. In general, it falls to a very small cohort of people to craft these programs, often without any oversight or official feedback. When provided, comments usually come from like-minded friends and colleagues personally selected by the organizers. This process is clearly in the interest of those who have previously gained and will continue to gain from it. A consequence is the disenfranchisement of all but the conference leadership. Indeed, ASV broke away from the ASM in 1981 specifically because establishment microbiologists treated virologists as outsiders (4). Biannual meetings focused on individual herpesviruses (Epstein-Barr virus, cytomegalovirus, Kaposi's sarcoma-associated herpesvirus) are now convened largely for the same reason. Without inclusion, we risk isolation.
Lesson number 5: Success starts with a good plan. As past meeting organizers ourselves, we have direct knowledge of the challenges in assembling exciting, representative, and diverse programs of invited speakers relevant to multiple constituencies. The desire to have equity in one area (e.g., gender) can at times compromise one's ability to ensure parity in other areas such as novelty (repeats/new), content (hot new topic/classic paradigm), career status (junior/established), geographical location (the Americas/Asia/Europe/Oceania), and expertise (RNA/DNA; pathogenesis/replication, etc.). If and when these priorities come into conflict, a vetted and published conference strategic plan could help organizers make these tough and unmistakably real decisions.
An invited speaker list that is exciting and anticipated by attendees requires planning to achieve a sensible balance between repeat lectures by long-standing, well-deserving contributors and investigators giving their first ever presentations. As in any competitive profession, those whose work is outstanding among their peers and who deliver effective presentations are deserving of repeat invitations. Furthermore, exposing trainees (who may only go to one or two iterations of a meeting) to lectures by luminaries in the field provides memorable experiences, and should not be avoided simply because they have previously delivered talks. However, our data indicate that repetitive programs correlate with gender imbalance, and that the concerted addition of first-time speakers correlates with better parity (Fig. 5A and B). Therefore, the identification and incorporation of first-time speakers need to become a higher priority. Organizers might simply consider crafting initial programs based on first-time speakers that achieve gender equity, relying on repeat speakers to fill in the gaps, instead of first inviting repeat luminaries before considering first-time speakers. Either way, all invitations will now be offered (and accepted) with a full knowledge of the conference history and parity discrepancies, and those informed decisions will need to be justified.
In conclusion, we note that at the current rate of change, each of these series may take decades to reach parity unless there is a sustained effort to modify the ongoing inclusion slopes. Now that the problem is codified, our collective response to it will define our values into the future. We encourage the initiation and continuation of strategic planning discussions at conference business meetings, perhaps guided by this published template (3). When organizers are committed to inclusion rather than historical precedents, and when the status quo is specifically not the objective, positive change is actualized, and our fields are better for it. The ASV SOA program is a shining example of an outstanding, balanced program featuring primarily first-time speakers who deliver compelling presentations. The goals we should wish to achieve are not out of our reach.
MATERIALS AND METHODS
Full sets of official program listings for the American Society for Virology Annual Meeting (ASV; 1st to 36th; 1982 to 2017), the International Herpesvirus Workshop (IHW; 10th to 42nd; 1985 to 2017), the International Symposium on Positive-Strand RNA Viruses (PSR; 1st to 11th; 1998 to 2016), and the Gordon Research Conference on Viruses and Cells (GRC; 1st to 12th; 1995 to 2017) were gathered from personal collections of participant-issued books, copies loaned from colleagues, or publically available web resources (asv.org/archives; grc.org; herpesvirusworkshop.com; keystonesymposia.org/16N1).
Spreadsheets for each series recorded meeting dates, locations, series iterations (i.e., 1st, 2nd, etc.) and named organizers. For ASV and IHW, names (first, last) associated with “keynote,” “symposium,” “overview,” “state-of the-art,” or “summary” were transcribed for each year, along with indications (if listed) of that speaker's session topic/title, and whether any particular talk was accorded special distinction (i.e., a named presentation). GRC and PSR conventions differed, listing only a single “keynote” per meeting, with the remainder of speakers accorded 30- to 45-min “long talks” (L) or 10- to 15-min “short talks” (S), corresponding (essentially) to invited or abstract-derived origins, respectively. Correspondingly, “L” and “S” designations were recorded for each listed name for each year. We define as “major” (predominantly invited) those speakers in any of the above categories, except for GRC and PSR “S” designations. ASV “State-of-the-Art” (SOA) speakers, also wholly invited, were tabulated separately.
For the IHW we also captured all names listed as “session chair.” These and every IHW speaker received an additional notation (“B”) if the name appeared on that year's Scientific Advisory Board (SAB). Similarly, GRC “Discussion Leaders” were recorded. ASV and PSR symposium chairs are drawn primarily from each session's speakers, and therefore ignored for purposes of these data sets.
The lists were assembled, sorted and edited for continuity. Different iterations of the same person were standardized (e.g., “R. Kalejta” and “Rob Kalejta” were converted to “Robert F. Kalejta”). Where there was doubt, putatively duplicate names or single initials were cross-referenced by session topic, presentation titles, and speaker institutional affiliations. Gender was identified by our own knowledge of the listed person, or searches of public websites giving unambiguous “he” or “she” referents (or photos). The final data sets in sortable Excel formats are available on figshare (https://doi.org/10.6084/m9.figshare.5054029.v1), and on the University of Wisconsin—Madison Institute for Molecular Virology website (http://www.virology.wisc.edu/index.html). While admittedly some misidentifications may persist, these files represent our best-faith efforts at accurately reconstructing the historical rosters for each unit. The chronology of new names or repeated names was identified by simple sorts. For each graph the plotted trend lines are R2 linear regressions.
ACKNOWLEDGMENTS
Our initial data trends for ASV, IHW, and PSR were presented by A.C.P. as “Symposia Speaker Choices,” in a 2016 IHW session on “Diversity in Biomedical Research: Some Problems and Potential Solutions.” We thank Curtis Brandt and Shannon Kenney, who along with R.F.K. organized that session, and Janet Mertz, the moderator. These people are among our encouragers and stimuli for the current paper. We are grateful to Paul Ahlquist, Katie Lamb, Blossom Damania, John Sinclair, and others for providing program-specific materials and Emily Albright for proofreading the manuscript.
REFERENCES
- 1.Schroeder J, Dugdale HL, Radersma R, Hinsch M, Buehler DM, Saul J, Porter L, Liker A, De Cauwer I, Johnson PJ, Santure AW, Griffin AS, Bolund E, Ross L, Webb TJ, Feulner PGD, Winney I, Szulkin M, Komdeur J, Versteegh MA, Hemelrijk CK, Sevensson EI, Edwards H, Karlsson M, West SA, Barrett ELB, Richardson DS, Van Den Brink V, Wimpenny JH, Ellwood SA, Rees M, Matson KD, Charmantier A, Dos Remedios N, Schneider NA, Teplitsky C, Laurance WF, Butlin RK, Horrocks NPC. 2013. Fewer invited talks by women in evolutionary biology symposia. J Evol Biol 26:2063–2069. doi: 10.1111/jeb.12198. [DOI] [PMC free article] [PubMed] [Google Scholar]
- 2.Casadevall A. 2015. Achieving speaker gender equity at the American Society of Microbiology general meeting. mBio 6:e01146-15. doi: 10.1128/mBio.01146-15. [DOI] [PMC free article] [PubMed] [Google Scholar]
- 3.Martin JL. 2014. Ten simple rules to achieve conference speaker balance. PLoS Comput Biol 10:e1003903. doi: 10.1371/journal.pcbi.1003903. [DOI] [PMC free article] [PubMed] [Google Scholar]
- 4.Joklik WK, Grossberg SE. 2006. How the American Society for Virology was founded. Virology 344:250–257. doi: 10.1016/j.virol.2005.09.022. [DOI] [PubMed] [Google Scholar]
- 5.Casadevall A, Handelsman J. 2014. The presence of female conveners correlates with a higher proportion of female speakers at scientific symposia. mBio 5:e00846-13. doi: 10.1128/mBio.00846-13. [DOI] [PMC free article] [PubMed] [Google Scholar]