

ABSTRACT
N6-adenosine methylation (m6A) is the most common posttranscriptional RNA modification in mammalian cells. We found that most transcripts encoded by the Kaposi's sarcoma-associated herpesvirus (KSHV) genome undergo m6A modification. The levels of m6A-modified mRNAs increased substantially upon stimulation for lytic replication. The blockage of m6A inhibited splicing of the pre-mRNA encoding the replication transcription activator (RTA), a key KSHV lytic switch protein, and halted viral lytic replication. We identified several m6A sites in RTA pre-mRNA crucial for splicing through interactions with YTH domain containing 1 (YTHDC1), an m6A nuclear reader protein, in conjunction with serine/arginine-rich splicing factor 3 (SRSF3) and SRSF10. Interestingly, RTA induced m6A and enhanced its own pre-mRNA splicing. Our results not only demonstrate an essential role of m6A in regulating RTA pre-mRNA splicing but also suggest that KSHV has evolved a mechanism to manipulate the host m6A machinery to its advantage in promoting lytic replication.
IMPORTANCE KSHV productive lytic replication plays a pivotal role in the initiation and progression of Kaposi's sarcoma tumors. Previous studies suggested that the KSHV switch from latency to lytic replication is primarily controlled at the chromatin level through histone and DNA modifications. The present work reports for the first time that KSHV genome-encoded mRNAs undergo m6A modification, which represents a new mechanism at the posttranscriptional level in the control of viral replication.
KEYWORDS: KSHV, N6-adenosine methylation, RNA splicing, lytic replication
INTRODUCTION
Gene expression is controlled not only at the chromatin level through histone and DNA modifications but also at the posttranscriptional level through RNA modifications. N6-adenosine methylation (m6A) is the most abundant RNA modification found in ∼25% of RNA species in mammalian cells (1, 2). Despite its discovery decades ago (3–7), the biochemical pathways responsible for m6A and the biological functions of this process were not fully defined until very recently (8–10). Three methyltransferases, including methyltransferase-like 3 (METTL3), methyltransferase-like 14 (METTL14), and Wilms' tumor 1-associated protein (WTAP), act as m6A writers and catalyze RNA m6A at specific sites with the consensus sequence [(G/A)GAC, where the underlined adenosine is the methylation site] (11, 12). Two demethylases, fat mass- and obesity-associated protein (FTO) and AlkB homolog 5 (ALKBH5), both of which act as m6A erasers, reverse this process (13–17). Most m6A sites are located near the transcription start sites, exonic regions flanking splicing sites, stop codons, and the 3′ untranslated region (3′ UTR) (1, 2, 9, 18), contributing to the control of RNA splicing, export, and stability and protein translation (19–24).
The biological functions of m6A are mediated by its reader proteins. In the nucleus, heterogeneous nuclear ribonucleoprotein C (hn-RNP-C) and another member of the hn-RNP family, hn-RNP-A2B1, selectively bind RNA at m6A sites to regulate pre-mRNA processing and alternative splicing (20, 25, 26). In addition, m6A sites in pre-mRNA can serve as the cues for YTH domain containing 1 (YTHDC1), another m6A nuclear reader protein (27–29). YTHDC1 preferentially recruits serine/arginine-rich splicing factor 3 (SRSF3) over serine/arginine-rich splicing factor 10 (SRSF10) in an m6A-dependent manner (29). SRSF3 is responsible for exon inclusion splicing, while SRSF10 is involved in both exon inclusion and exclusion splicing (30–32). In the cytoplasm, three members of the YTH domain-containing family of proteins, YTHDF1, YTHDF2, and YTHDF3, preferentially bind m6A-containing mRNAs to regulate RNA stability, protein translation, and RNA decay (1, 22, 26). In addition, eukaryotic initiation factor 3 (eIF3), a component of the 43S translation preinitiation complex, directly binds m6A sites in the 5′ untranslated region (5′ UTR) of mRNAs to enhance protein translation (33).
RNA m6A has been reported to control various biological processes, such as stem cell differentiation and metabolism (34–38), and aberrant RNA m6A has been found in certain diseases, including cancer (36, 39). Viruses, such as simian virus 40 (SV40), adenovirus, and influenza virus, have been shown to undergo m6A modification in their RNAs (40–44). However, little is known about the biological significance of RNA m6A modification for these viruses. Several recent studies demonstrated that the mRNAs of human immunodeficiency virus type 1 (HIV-1) are also extensively m6A methylated, with these methylated mRNAs not only controlling HIV-1 gene expression and replication but also regulating viral infection (45–49).
Kaposi's sarcoma-associated herpesvirus (KSHV) is the etiological agent associated with Kaposi's sarcoma (KS), primary effusion lymphoma (PEL), and multicentric Castleman's disease (MCD) (50–53). Productive KSHV lytic replication plays an essential role in the development of KS and MCD (54), and tumors regress when patients are treated with drugs targeting KSHV lytic replication (55–57). Thus, understanding the mechanisms controlling KSHV lytic replication is crucial for the development of strategies to prevent and treat these malignancies. Until now, it was widely believed that expression of KSHV lytic genes is primarily controlled at the chromatin level through histone and DNA modifications (58–65).
Here we report on m6A modification of most KSHV transcripts and its role in regulating viral lytic gene expression and replication. We found that the level of m6A-modified mRNA (m6A-mRNA) for a given viral transcript increases substantially when infected cells are stimulated for lytic replication. To examine how m6A impacts KSHV lytic gene expression and replication, we stimulated KSHV-infected cells for lytic replication in the presence of 3-deazaadenosine (DAA), which inhibits the hydrolysis of S-adenosylhomocysteine (SAH) to block the catalytic reaction of RNA m6A (66). DAA strongly inhibits splicing of the pre-mRNA encoding the KSHV replication transcription activator (RTA), which is an essential mediator of KSHV lytic replication (67), and halts virion production. We identified several m6A sites crucial for RTA pre-mRNA splicing that are bound by m6A nuclear reader protein YTHDC1 and its associated splicing factors, SRSF3 and SRSF10. Furthermore, we found that the lytic switch protein RTA itself strongly induces m6A and enhances its own pre-mRNA splicing. Our data demonstrate for the first time that KSHV not only utilizes but also manipulates the host m6A machinery to promote lytic gene expression and replication.
RESULTS
Most KSHV-encoded transcripts undergo m6A modification.
In order to determine m6A modification of KSHV-encoded transcripts, we stimulated BCBL1 cells with phosphate-buffered saline (PBS; placebo) or 12-O-tetradecanoyl-phorbol-13-acetate (TPA) for various amounts of time (in hours). We next isolated total RNAs from the cells and conducted m6A-modified RNA immunoprecipitation (MeRIP) with a widely used rabbit anti-m6A antibody and control IgG, followed by conversion of the input RNAs and the RNA immunoprecipitation (RIP) products into cDNAs with reverse transcriptase (RT) (Fig. 1A). We then quantified each of the KSHV-encoded transcripts in the different cDNA samples by quantitative RT-PCR (qRT-PCR), using the viral gene-specific primers described previously (68). KSHV transcripts were detected in the input and the product of RIP with anti-m6A. No or negligible levels of viral transcripts were detected in the product of RIP with IgG (Fig. 1B). Abundantly expressed host housekeeping genes, such as β-actin, were detected in the product of RIP with IgG. However, their levels were several hundred times lower than those in the product of RIP with anti-m6A (Fig. 1C and D). Therefore, the MeRIP procedure is highly specific for the detection and quantification of m6A-mRNA of viral transcripts.
FIG 1.
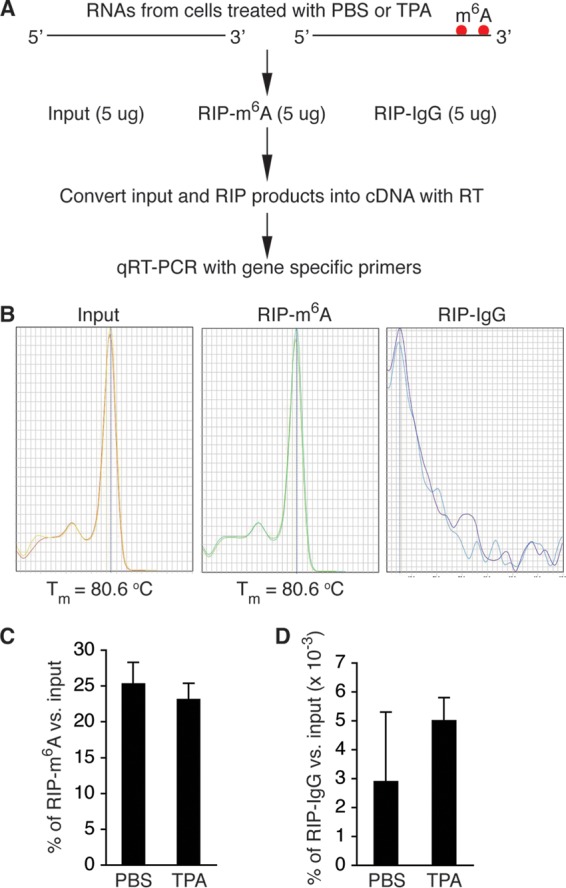
MeRIP–qRT-PCR measurement of m6A-mRNA and total mRNA of KSHV transcripts. (A) Schematic presentation of MeRIP procedure. (B) Melting temperature (Tm) of qRT-PCR product of KSHV ORF50 (RTA). Positive signals were seen only with cDNAs from the input and the product of RIP with anti-m6A (RIP-m6A). No signal was seen with cDNAs from the product of RIP with control IgG (RIP-IgG). (C and D) Percentages of m6A-mRNA of β-actin in the products of RIP with m6A (C) and IgG (D), noting that the levels of m6A-mRNA of β-actin from BCBL1 cells treated with PBS or TPA for 24 h were several hundred times higher in the products of RIP with m6A than in the products of RIP with IgG.
From the cDNAs of the input, we measured the relative level of total mRNA of each viral transcript. From the cDNAs of the MeRIP products, we measured the relative level of m6A-mRNA. As shown in Table 1, most of the tested KSHV transcripts underwent m6A modification. The level of m6A-mRNA of a given viral transcript increased in parallel with that of total mRNA upon TPA stimulation (Fig. 2). While the three latent transcripts demonstrated modest increases in both total mRNA and m6A-mRNA levels, lytic transcripts, particularly immediate early (IE) and early (E) transcripts, such as ORF45, ORF49, ORF50 (RTA), ORF57, ORF59, and ORFK8, displayed more robust increases in both total mRNA and m6A-mRNA levels at 24 h after TPA stimulation. As shown in Fig. 3, the levels of m6A-mRNA and total mRNA of the IE and E genes, such as ORF45 and ORF50 (RTA), decreased in parallel at later time points. In contrast, the levels of total mRNA and m6A-mRNA of late lytic transcripts, such as ORF63 and ORF75, increased at late time points. These results demonstrate that TPA not only activates transcription of KSHV lytic genes but also simultaneously induces posttranscriptional m6A modification to the viral transcripts.
TABLE 1.
Levels of total mRNA and m6A-mRNA of all tested KSHV transcripts in BCBL1 cells treated with PBS or TPA for 24 h
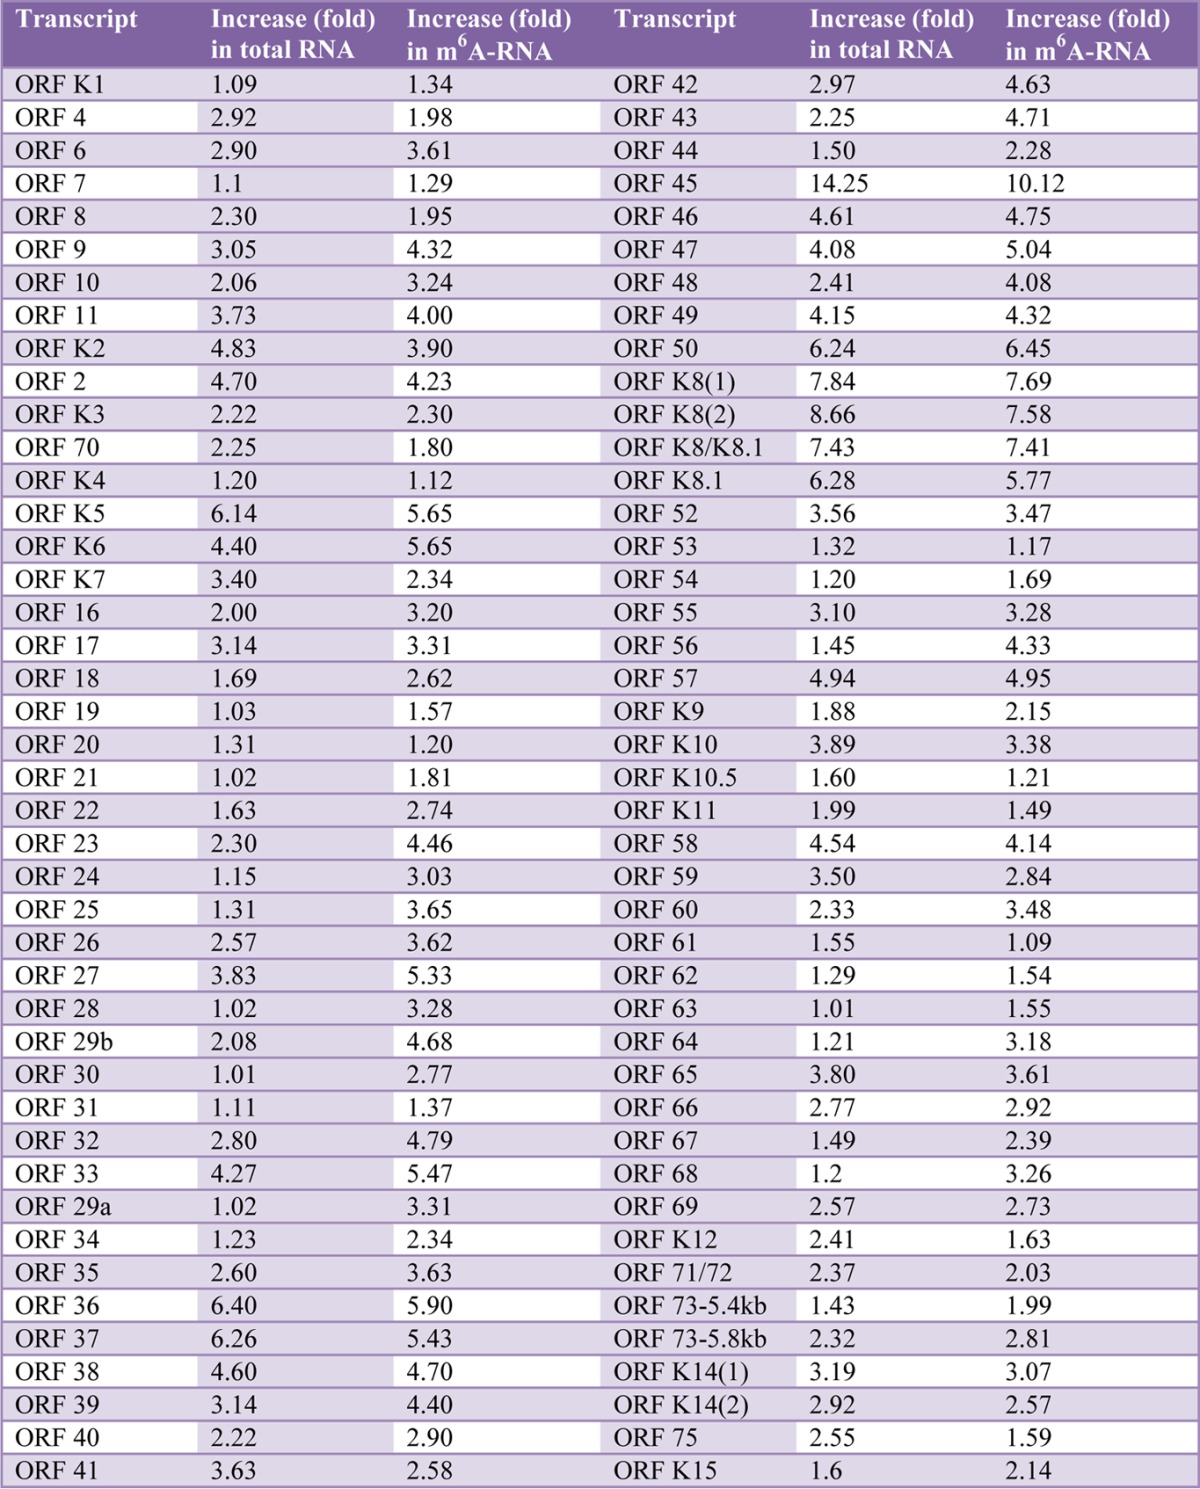
FIG 2.
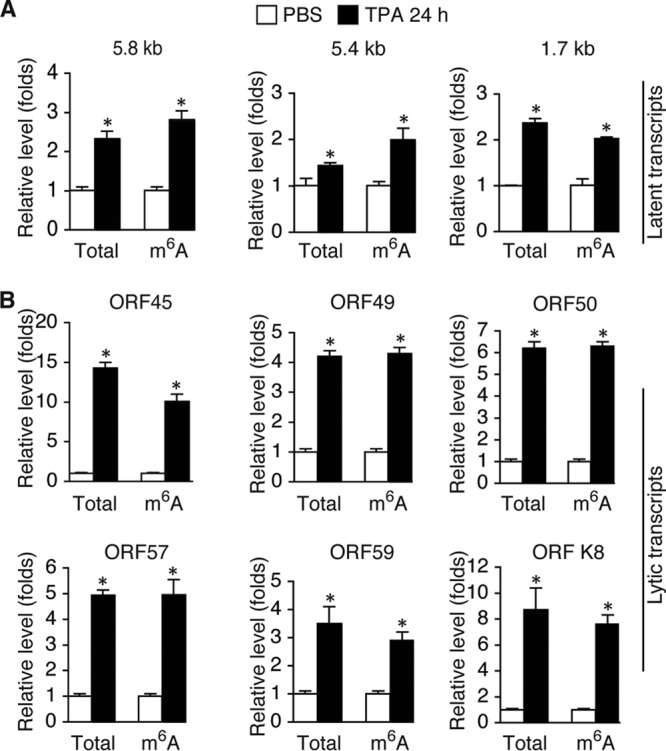
The levels of total mRNA and m6A-mRNA of KSHV lytic transcripts increase in parallel when cells are stimulated for lytic replication. (A) Levels of total mRNA and m6A-mRNA of the 5.8-kb and 5.40-kb tricistronic latent transcripts encoding LANA (ORF73), viral cyclin (ORF72), and viral FLIP (ORF71) and the 1.7-kb bicistronic latent transcript encoding viral cyclin (ORF72) and viral FLIP (ORF71) in BCBL1 cells treated with PBS (placebo control) or TPA (20 ng/ml) for 24 h. (B) Levels of total mRNA and m6A-mRNA of lytic transcripts ORF45, ORF49, ORF50 (RTA), ORF57, ORF59, and ORFK8 from the cells described in the legend to panel A. All qRT-PCRs were conducted in triplicate. The statistical significance of the differences in the level of m6A-mRNA or total mRNA of a given transcript between cells treated with PBS and cells treated with TPA was analyzed by an unpaired t test. *, differences with P values of <0.05 (n = 3).
FIG 3.
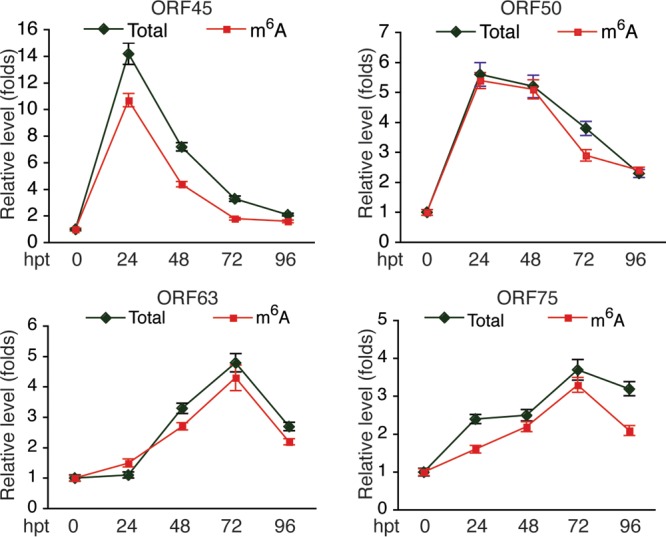
Levels of total mRNA and m6A-mRNA of KSHV IE transcripts ORF45 and ORF50 (RTA) and late transcripts ORF63 and ORF75 in BCBL1 cells at different times after TPA treatment. hpt, hours posttreatment.
To investigate if m6A modification of KSHV transcripts occurs in other types of cells, we conducted similar MeRIP–qRT-PCR experiments with total RNAs from KSHV-infected telomerase-immortalized human umbilical vein endothelial cells (TIVE-KSHV cells). All tested KSHV transcripts from these cells underwent m6A modification, and the levels of both total mRNA and m6A-mRNA increased in parallel upon TPA stimulation (Fig. 4A). Furthermore, to examine if other KSHV lytic replication stimuli had similar effects, we treated BCBL1 cells with sodium butyrate (NaB), hydrogen peroxide (H2O2), and the inflammatory cytokine tumor necrosis factor alpha (TNF-α) as described previously (69), followed by isolation of RNAs and MeRIP–qRT-PCR measurement of total mRNA and m6A-mRNA of individual KSHV transcripts as described above. All stimuli increased the levels of total mRNA and m6A-mRNA of ORF50 (RTA) and ORF57 (Fig. 4B). Therefore, m6A modification of KSHV transcripts occurs in different types of cells and can be induced by different lytic replication stimuli.
FIG 4.
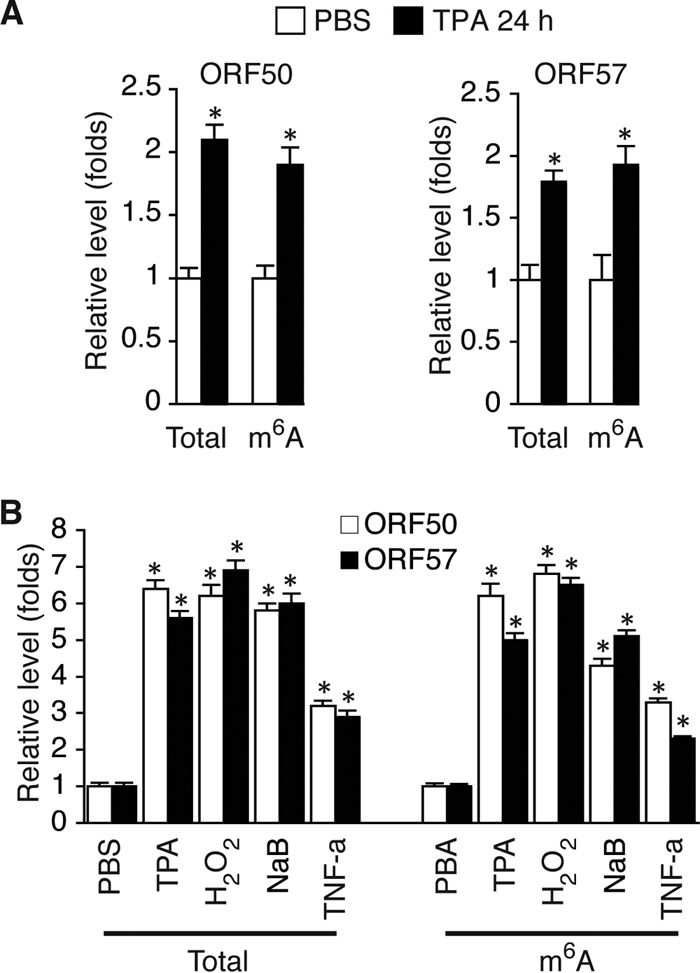
Posttranscriptional m6A modification of KSHV transcripts also occurs in endothelial cells and can be induced by different lytic replication stimuli. (A) Levels of total mRNA and m6A-mRNA of KSHV lytic transcripts ORF50 (RTA) and ORF57 in TIVE-KSHV cells treated with PBS or TPA for 24 h. (B) Levels of total mRNA and m6A-mRNA of ORF50 (RTA) in BCBL1 cells treated with PBS (placebo), TPA (20 ng/ml), H2O2 (400 μM), NaB (0.5 mM), or TNF-α (10 ng/ml) for 24 h. The statistical significance of the differences in the level of m6A-mRNA or total mRNA of a given transcript between cells treated with PBS and cells treated with different stimuli was analyzed by an unpaired t test. *, differences with P values of <0.05 (n = 3).
Knockdown (KD) of FTO increases m6A and enhances lytic gene expression, while KD of METTL3 has the opposite effects.
Data from the MeRIP–qRT-PCR experiments suggested that m6A modification is an important event in KSHV lytic gene expression and replication. To investigate how m6A impacts KSHV lytic gene expression, we transduced BCBL1 cells with two different sets of lentiviruses expressing FTO- or METTL3-specific short hairpin RNA (shRNA) from Santa Cruz Biotechnologies (shRNA-SC) and Origene Technologies, Inc. (shRNA-OT), and established cell lines that stably express METTL3- or FTO-specific shRNA or control shRNA. Similar results were obtained with both sets of shRNA. As shown in Fig. 5A and E, FTO mRNA and protein levels in cells expressing FTO-specific shRNA-SC or FTO-specific shRNA-OT were significantly lower than those in cells expressing control shRNA. Knockdown (KD) of FTO not only increased the levels of m6A-mRNA (Fig. 5D) but also enhanced TPA induction of KSHV lytic genes, such as ORF50 (RTA) and ORF57, at both the mRNA and protein levels (Fig. 5B, C, and E) and increased the level of virion production (Fig. 5F). Notably, TPA treatment decreased the level of expression of FTO at both the mRNA and protein levels (Fig. 5A and E), which may explain why TPA induces m6A.
FIG 5.

shRNA KD of FTO increases m6A and KSHV lytic gene expression. (A) Levels of FTO mRNA in BCBL1 cells expressing FTO-specific shRNA from Santa Cruz Biotechnologies (shRNA-SC) or Origene Technologies, Inc. (shRNA-OT), or control shRNA. The cells were treated with PBS or TPA for 24 h. (B and C) Levels of ORF50 (RTA) (B) and ORF57 (C) mRNAs in the cells described in the legend to panel A. (D) Levels of m6A-mRNA of ORF50 (RTA) in the cells described in the legend to panel A. (E) Western blot detection of FTO and KSHV lytic proteins encoded by ORF50 (RTA) and ORF57 in the cells described in the legend to panel A. The level of the housekeeping gene β-tubulin was used as a loading control. (F) Relative levels of KSHV virions in the supernatants of the cells described in the legend to panel A at 96 h after TPA stimulation, determined by quantitative PCR using primers specific for ORF72. The cellular debris in the supernatants was removed by high-speed centrifugation (4,000 × g, 15 min), followed by filtration through 0.8-μm-pore-size filters. Total DNAs from 200 μl of each supernatant and 200 μl of the corresponding cells were purified by using a Qiagen genomic DNA purification kit. The level of viral DNA in each supernatant was normalized to that of the corresponding cellular DNA measured with primers specific for β-actin. The level of viral DNA in the supernatant from cells expressing control shRNA and treated with PBS was set as a reference and was equal to 1, and the relative level (fold change) of viral DNA in any of the other supernatants was calculated by using the formula 1/2ΔCT, where ΔCT is the difference in the CT values after normalization between the supernatant in question and that of the reference. All quantitative PCRs were carried out in triplicate.
In contrast, METTL3 KD had the opposite effects. As shown in Fig. 6A and E, the METTL3 mRNA and protein levels in cells expressing METTL3-specific shRNA-SC or METTL3-specific shRNA-OT were significantly lower than those in cells expressing control shRNA. METTL3 KD not only decreased the levels of m6A-mRNA (Fig. 6D) but also inhibited TPA induction of KSHV lytic gene expression at both the mRNA and protein levels (Fig. 6B, C, and E) and reduced the level of virion production (Fig. 6F). Collectively, the results from both the FTO and METTL3 KD experiments suggest that m6A modification is required for effective expression of KSHV lytic genes.
FIG 6.

KD of METTL3 decreases m6A and reduces KSHV lytic gene expression. (A) Levels of METTL3 mRNA in BCBL1 cells expressing METTL3-specific shRNA from Santa Cruz Biotechnologies (shRNA-SC) or Origene Technologies, Inc. (shRNA-OT), or control shRNA. The cells were treated with PBS or TPA for 24 h. (B and C) Levels of ORF50 (RTA) (B) and ORF57 (C) mRNA in the cells described in the legend to panel A. (D) Levels of m6A-mRNA of ORF50 (RTA) in the cells described in the legend to panel A. (E) Western blot detection of METTL3 and KSHV lytic proteins encoded by ORF50 (RTA) and ORF57 in the cells described in the legend to panel A. The level of β-tubulin was used as a loading control. (F) Relative levels of KSHV DNA in the supernatants of the cells described in the legend to panel A at 96 h after TPA stimulation, which were determined as described in the legend to Fig. 5F.
Functional inhibition of FTO enhances lytic gene expression, while the blocking of m6A abolishes lytic gene expression and virion production.
As alternative approaches to further investigate the effects of m6A on KSHV lytic gene expression, we next attempted to increase m6A by treating BCBL1 cells with meclofenamic acid (MA), a selective inhibitor of FTO (70), or block m6A with DAA. We first determined the cytotoxicity and optimal concentrations of MA and DAA by treating BCBL1 cells with various concentrations of these reagents for 24 h, followed by propidium iodide (PI) staining of the cells and flow cytometry analysis of cell viability. We found that 95.2% and 89.6% of the cells were viable when they were treated with 1 μM and 2 μM MA, respectively, and 90.3% and 79.8% of the cells were viable when they were treated with 25 μM and 50 μM DAA, respectively. We thus treated BCBL1 cells with PBS (placebo), MA (1 μM), DAA (25 μM), or TPA in the absence or presence of MA or DAA, followed by measurement of m6A-mRNA levels and the levels of total mRNA of viral transcripts and proteins as described above. In addition, to assess the effects of MA and DAA on virion production, we stimulated identical numbers of BCBL1-BAC36 cells, which were BCBL1 cells that carried a green fluorescent protein (GFP)-expressing recombinant KSHV, bacterial artificial chromosome 36 (BAC36) (71), with PBS, MA, DAA, or TPA in the absence or presence of MA or DAA. Upon changing of the medium at 24 h posttreatment and culture for four more days, the supernatants were collected. We then infected human umbilical vein endothelial cell (HUVECs) with identical amounts of supernatants from the differently treated BCBL1-BAC36 cells and determined the percentages of GFP-positive cells as a measurement of the relative viral titers in the different supernatants.
Neither MA nor DAA alone had a significant impact on the expression of KSHV genes (Fig. 7A, B, and D), which is consistent with the notion that m6A regulates gene expression at the posttranscriptional level. As shown in Fig. 7C, MA enhanced the TPA induction of m6A, while DAA blocked this event. MA enhanced the TPA induction of KSHV lytic gene expression at both the mRNA and protein levels. In contrast, DAA blocked the TPA induction of lytic gene expression. The opposite effects of MA and DAA on TPA induction of virion production were also seen (Fig. 7E and F). Intriguingly, neither MA nor DAA significantly affected expression of the latent protein latent nuclear antigen (LANA) (Fig. 7D), although MA enhanced TPA induction of the two latent transcripts (Fig. 7A). Collectively, these results, which are in full agreement with data from the FTO and METTL3 KD experiments described above, further support the suggestion that m6A is essential for effective KSHV lytic gene expression and replication.
FIG 7.

Inhibition of FTO activity enhances KSHV lytic gene expression, while blocking of m6A abolishes lytic gene expression and virion production. (A and B) Relative levels of KSHV latent transcripts (5.4 kb and 5.8 kb) and lytic transcripts ORF50 (RTA) and ORF57 in BCBL1 cells treated with PBS (control), MA (1 μM), DAA (25 μ), and TPA, alone or in combination, for 24 h. (C) Levels of m6A-mRNA of ORF50 (RTA) and ORF57 in the BCBL1 cells described in the legend to panels A and B. (D) Western blot detection of KSHV latent protein LANA (ORF73) and lytic proteins encoded by ORF50 (RTA), ORF57, ORF62, and ORF65 in cells treated as described in the legend to panels A and B for 24 h and 72 h. (E) Representative images of HUVECs at 72 h postinfection with culture supernatants from equal numbers of BCBL1-BAC36 cells that were stimulated as described in the legend to panels A and B and collected at 5 days after treatment. (F) Percentage of GFP-positive cells at 72 h postinfection with the different culture supernatants described in the legend to panel E.
DAA blocking of m6A inhibits ORF50 (RTA) pre-mRNA splicing.
Due to differential splicing, the about 5,400-nucleotide (nt) KSHV ORF50 (RTA) and ORFK8 loci produce at least three different groups of transcripts, including ORF50 (RTA)/ORFK8/ORFK8.1 tricistronic mRNAs, ORFK8/ORFK8.1 bicistronic mRNAs, and monocistronic ORFK8.1 mRNAs (72). ORF50 (RTA), which is expressed from the tricistronic mRNAs, consists of two exons and one intron (Fig. 8A). Because DAA blocks TPA induction of RTA protein expression and m6A is known to regulate cellular RNA splicing, we reasoned that DAA might block RTA pre-mRNA splicing. To test this hypothesis, we converted the RNAs for which the results are described in Fig. 7 into cDNAs using an ORF50 (RTA) transcript-specific primer (Fig. 8A), followed by qRT-PCR measurement of the level of RTA pre-mRNA with a pair of primers chosen from the intron and the level of mRNA with specific primers described previously (68). The same RNA samples were also converted into cDNAs with a poly(T) primer in separate reverse transcription reactions. As shown in Fig. 8B, TPA stimulation increased the levels of both RTA pre-mRNA and mRNA. However, in the presence of DAA, TPA induction of RTA mRNA was strongly inhibited. In contrast, the level of RTA pre-mRNA was much less affected by DAA. Consistent with this result, the RTA mRNA-to-pre-mRNA ratio was substantially reduced when the cells were induced with TPA in the presence of DAA (Fig. 8C). These results unequivocally demonstrate that DAA blocking of m6A inhibits RTA pre-mRNA splicing.
FIG 8.
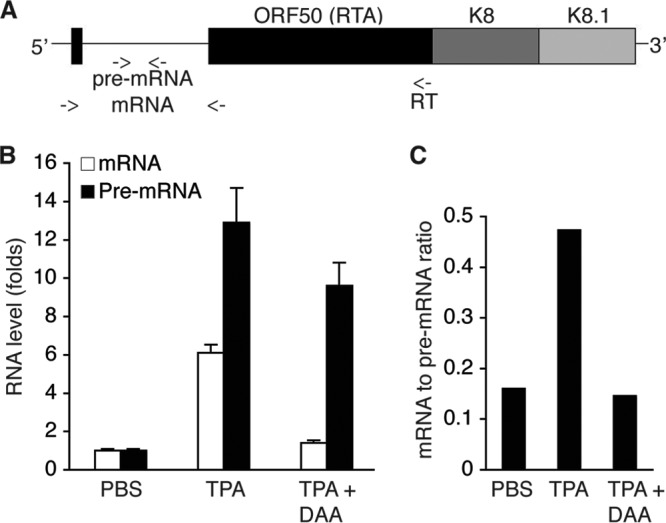
Blocking of m6A inhibits ORF50 (RTA) pre-mRNA splicing. (A) Schematic presentation of the tricistronic pre-mRNA encoding ORF50 (RTA), ORFK8, and ORFK8.1, as well as the locations (indicated with arrows) of the primers used for ORF50 (RTA)-specific cDNA synthesis and qRT-PCR detection of RTA pre-mRNA and mRNA. (B) Levels of ORF50 (RTA) pre-mRNA and mRNA in BCBL1 cells treated with PBS (placebo), TPA, or TPA plus DAA for 24 h. (C) ORF50 (RTA) mRNA-to-pre-mRNA ratios in the cells described in the legend to panel B.
Specific m6A sites are responsible for ORF50 (RTA) pre-mRNA splicing.
To examine how m6A contributes to ORF50 (RTA) pre-mRNA splicing, we conducted sequencing analysis of the products of MeRIP (MeRIP-seq) to determine where m6A occurs along the ORF50 (RTA) pre-mRNA by using total RNAs from BCBL1 cells that were stimulated with TPA for 24 h. As shown in Fig. 9A, multiple clusters of m6A sites were found in the intron and exon2 of ORF50 (RTA). Analysis of the DNA sequence in the ORF50 (RTA) locus identified six m6A consensus sites (GGAC) in the intron (sites A to F) and eight such sites in exon2 (sites G to N) (Fig. 9B). Notably, the locations of the m6A consensus sites matched quite well with the clusters of m6A sites determined by MeRIP-seq, suggesting that these sites are indeed methylated.
FIG 9.

Specific m6A sites in ORF50 (RTA) pre-mRNA are responsible for splicing. (A) m6A sites in the ORF50 (RTA) locus determined by MeRIP-seq. (B) Genomic locations of m6A consensus GGAC sites in the ORF50 (RTA) locus of the KSHV genome and presentation of the pExon1-intron-exon2-GFP plasmid. (C) ORF50 (RTA) mRNA-to-pre-mRNA ratios in 293T cells transfected with equal amounts (4 μg) of wild-type (WT) pExon1-intron-exon2-GFP or its mutants with mutations at each of the individual m6A sites (Mut-A to Mut-J) (GGAC → GGCC). (D) Western blot detection at 48 h posttransfection of RTA and β-tubulin in the 293T cells described in the legend to panel C. (E) Representative images of GFP expression in the cells described in the legend to panel C. The statistical significance of the differences in the ORF50 (RTA) mRNA-to-pre-mRNA ratio between cells transfected with the wild-type plasmid and cells transfected with a plasmid harboring any mutant was analyzed by an unpaired t test. *, differences with P values of <0.05 (n = 3).
To determine which sites were involved in ORF50 (RTA) pre-mRNA splicing, we cloned the exon1-intron-exon2 DNA fragment into plasmid pCMV-myc. The coding sequence of GFP immediately downstream of the start codon (ATG) was fused in-frame to ORF50 (RTA) at its C terminus (Fig. 9B). Transcription of the exon1-intron-exon2-GFP sequence was under the control of a cytomegalovirus (CMV) promoter, and expression of the RTA-GFP fusion protein depended on successful pre-mRNA splicing. We next conducted in vitro mutagenesis on the wild-type plasmid, resulting in mutant plasmids with each of the m6A sites mutated (GGAC → GGCC). Successful mutation of the sites was verified by DNA sequencing. None of the mutations created stop codons or frameshifts that disrupted the expression of the fusion protein. We then transfected equal numbers of 293T cells with the wild type and each of the mutant plasmids using equal amounts of DNA. Upon isolation of total RNAs from the cells at 48 h posttransfection, we measured the levels of ORF50 (RTA) mRNA and pre-mRNA, as well as their ratio in each sample, and the results are provided in Fig. 8. Remarkably, as shown in Fig. 9C, D, and E, mutation of sites A, B, and F drastically reduced the mRNA-to-pre-mRNA ratio and the level of RTA protein expression. Mutation of these sites had little effect on the level of pre-mRNA (data not shown), thus suggesting that m6A modification of these sites is indispensable for ORF50 (RTA) pre-mRNA splicing. Mutation of site G also substantially reduced the mRNA-to-pre-mRNA ratio and the level of RTA protein expression, indicating that this site is also important for splicing. In contrast, mutation of sites C, D, E, H, I, and J did not significantly affect splicing. Therefore, m6A modification of sites A, B, F, and G, which are in the intron and exon2 near the two splicing sites, is crucial for ORF50 (RTA) pre-mRNA splicing and RTA protein expression.
ORF50 (RTA) pre-mRNA is bound by m6A nuclear reader protein YTHDC1 and splicing factors SRSF3 and SRSF10.
A recent study reported that m6A nuclear reader protein YTHDC1 binds to pre-mRNA in an m6A-dependent manner and preferentially recruits splicing factor SRSF3 over SRSF10 (29). We treated identical numbers of BCBL1 cells with PBS or TPA in the absence or presence of DAA for 24 h, followed by conducting a coimmunoprecipitation (co-IP) assay with a rabbit polyclonal antibody to YTHDC1 and control IgG and protein lysates from the differently treated cells. As shown in Fig. 10, all three proteins were expressed in BCBL1 cells, and DAA blocking of m6A had little effect on the expression of these proteins. The anti-YTHDC1 antibody pulled down not only YTHDC1 but also SRSF3 and SRSF10, indicating that these proteins are indeed associated with each other in BCBL1 cells.
FIG 10.
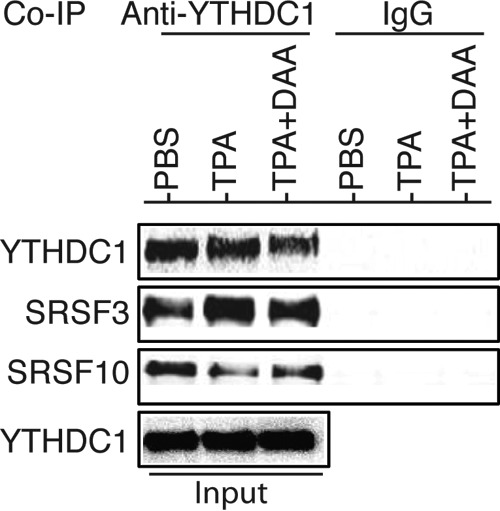
The m6A nuclear reader YTHDC1 is associated with RNA splicing factors SRSF3 and SRSF10 in BCBL1 cells. Equal amounts (1 mg) of proteins prepared from BCBL1 cells treated with PBS, TPA, or TPA plus DAA for 24 h were used for coimmunoprecipitation (co-IP) with a rabbit anti-YTHDC1 antibody or control IgG. The co-IP products and input samples were subsequently analyzed by Western blot detection with antibodies to YTHDC1, SRSF3, and SRSF10.
We next examined if these proteins are recruited to ORF50 (RTA) pre-mRNA in an m6A-dependent manner by conducting RNA immunoprecipitation (RIP) with antibodies to YTHDC1, SRSF3, SRSF10, and m6A and control IgG and subsequent qRT-PCR measurement of the amount of protein-bound RNA in the RIP products (Fig. 11A). Briefly, we treated equal numbers of BCBL1 cells with PBS or TPA for 24 h. In parallel, we transfected equal numbers of 293T cells with identical amounts of DNA of the wild-type pExon1-intron-exon2-GFP plasmid and its mutants in which m6A sites A, F, and G were mutated (Mut-A, Mut-F, and Mut-G, respectively) and collected the cells at 48 h posttransfection. All cells were harvested and resuspended in ice-cold PBS. One-tenth of the cells from each treatment were saved for RNA purification and used as input before RNase A digestion. The rest of the cells were UV cross-linked, harvested by centrifugation, and homogenized in RIP lysis buffer. The samples were then subjected to partial RNase A digestion. One-tenth of each RNase A-treated sample was then used for RIP with equal amounts of antibodies to YTHDC1, SRSF3, SRSF10, and m6A and control IgG. Upon purification of RNA from the input and RIP products and cDNA synthesis with random primers, qRT-PCR was performed to quantify RNA fragments in the regions of m6A sites A, F, and G in ORF50 (RTA) pre-mRNA. Effective RNase A digestion of RNA unbound by proteins was verified by negative qRT-PCR results with primers detecting mature ORF50 (RTA) mRNA, and the specificity of RIP with the different antibodies was verified by negative PCR results for the RIP products with the control IgG (Fig. 11B and C).
FIG 11.

RIP-qRT-PCR measurement of RNA bound by YTHDC1, SRSF3, and SRSF10. (A) Schematic presentation of RIP–qRT-PCR procedure. (B) Locations of the primers used for qRT-PCR measurement of a protein-bound RNA fragment carrying m6A site A in ORF50 (RTA) pre-mRNA, as well as th eprimers used for detection of ORF50 (RTA) mRNA. (C) RIP products obtained by qRT-PCR analyzed in an agarose (2%) gel by electrophoresis. The ∼100-bp fragment (RTA mRNA) was detected only in the input (before RNase A digestion), suggesting that it was not protected by RNA binding proteins and, thus, was sensitive to RNase A digestion. In contrast, the ∼150-bp fragment (RTA pre-mRNA in the m6A site A region) was protected and could be pulled down by anti-YTHDC1 antibody but not control IgG.
As shown in Fig. 12, upon TPA induction, the level of m6A at site A increased substantially in BCBL1 cells, and this increase was accompanied by increased levels of YTHDC1 and SRSF3. SRSF10 was also present in this region. However, its level did not change as much upon TPA stimulation. In 293T cells, mutation of site A dramatically reduced the levels of YTHDC1, SRSF3, and SRSF10, suggesting that their presence at site A is m6A dependent. All three proteins were also present in the region of site F in BCBL1 cells (Fig. 13B). In 293T cells, mutation of site F substantially reduced the levels of YTHDC1 and SRSF3 but had little effect on the level of SRSF10 (Fig. 13C). These results, along with the data shown in Fig. 9C to E, strongly suggest that m6A modification of sites A and F plays a critical role in RTA pre-mRNA splicing by recruiting YTHDC1 and the splicing factors SRSF3 and SRSF10. Different from the findings for sites A and F, TPA treatment reduced the level of SRSF10 at site G in BCBL1 cells (Fig. 14B). In 293T cells, mutation of site G decreased the levels of YTHDC1 and SRSF3 but did not significantly change the level of SRSF10 (Fig. 14C). These results, along with the data shown in Fig. 9C to E, suggest that m6A-dependent dissociation of SRSF10 from site G plays an important role in RTA pre-mRNA splicing.
FIG 12.
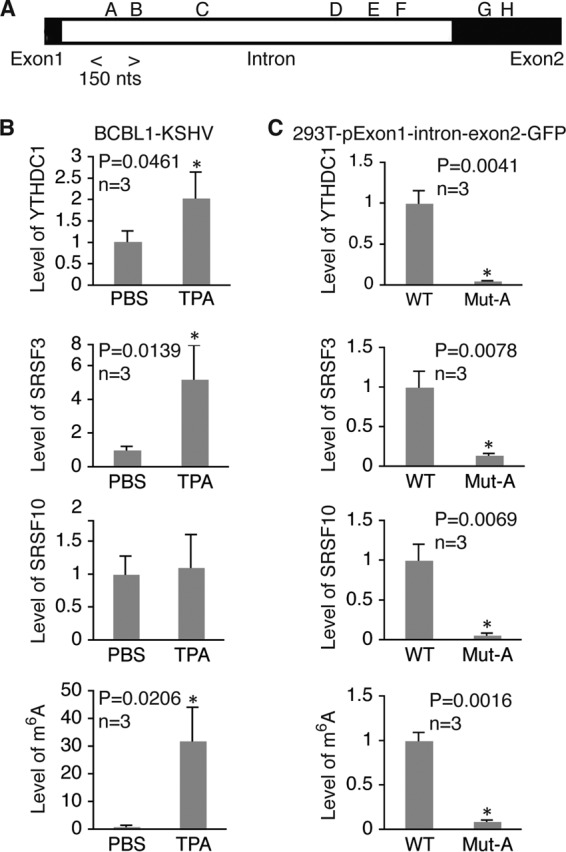
m6A modification of site A in ORF50 (RTA) pre-mRNA is required for recruitment of YTHDC1, SRSF3, and SRSF10. (A) Location of the m6A site A region analyzed by RIP–qRT-PCR with antibodies to YTHDC1, SRSF3, and SRSF10 and the specific primers listed in Table 2. (B) Relative levels of RNA bound by YTHDC1, SRSF3, or SRSF10 and the levels of m6A in the site A region in BCBL1 cells treated with PBS or TPA for 24 h. For all comparisons, the levels of RNA and m6A in cells treated with PBS were set equal to 1. (C) Relative levels of RNA bound by YTHDC1, SRSF3, or SRSF10 and the levels of m6A in the site A region in 293T cells transfected with wild-type (WT) pExon1-intron-exon2-GFP or its mutant with site A mutated (Mut-A). For all comparisons, the levels of RNA and m6A in cells transfected with the wild-type plasmid were set equal to 1. *, differences with a P value of <0.05.
FIG 13.
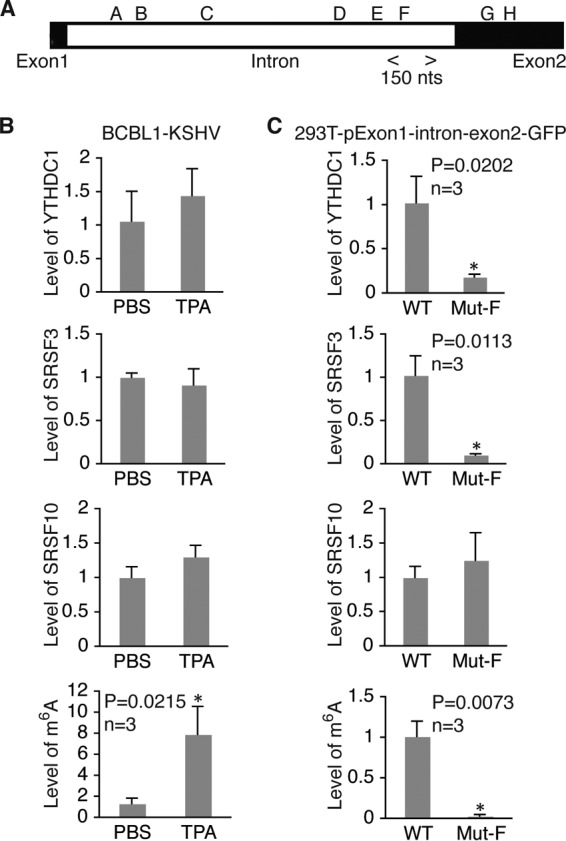
m6A modification of site F in ORF50 (RTA) pre-mRNA is required for recruitment of YTHDC1 and SRSF3. (A) Location of m6A site F region analyzed by RIP–qRT-PCR with antibodies to YTHDC1, SRSF3, and SRSF10 and the specific primers listed in Table 2. (B) Relative levels of RNA bound by YTHDC1, SRSF3, or SRSF10 and the levels of m6A in the site F region in BCBL1 cells treated with PBS or TPA for 24 h. For all comparisons, the levels of RNA and m6A in cells treated with PBS were set equal to 1. (C) Relative levels of RNA bound by YTHDC1, SRSF3, or SRSF10 and the levels of m6A in the site F region in 293T cells transfected with wild-type (WT) pExon1-intron-exon2-GFP or its mutant with site F mutated (Mut-F). For all comparisons, the levels of RNA and m6A in cells transfected with the wild-type plasmid were set equal to 1. *, differences with a P value of <0.05.
FIG 14.
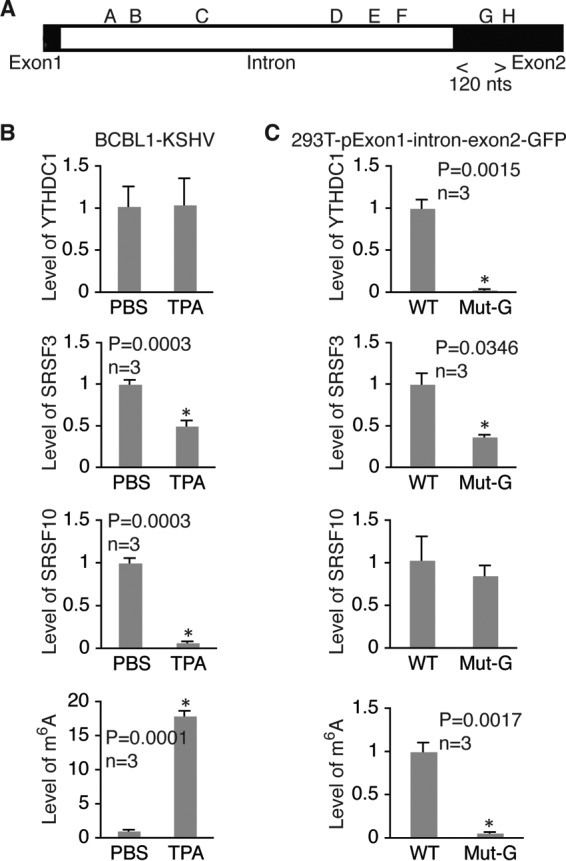
m6A modification of site G in ORF50 (RTA) pre-mRNA is required for recruitment of YTHDC1 and SRSF3 and disassociation of SRSF10. (A) Location of the m6A site G region analyzed by RIP–qRT-PCR with antibodies to YTHDC1, SRSF3, and SRSF10 and the specific primers listed in Table 2. (B) Relative levels of RNA bound by YTHDC1, SRSF3, or SRSF10 and the levels of m6A in the site G region in BCBL1 cells treated with PBS or TPA for 24 h. For all comparisons, the levels of RNA and m6A in cells treated with PBS were set equal to 1. (C) Relative levels of RNA bound by YTHDC1, SRSF3, or SRSF10 and levels of m6A in the site G region in 293T cells transfected with wild type (WT) pExon1-intron-exon2-GFP or its mutant with site G mutated (Mut-G). For all comparisons, the levels of RNA and m6A in cells transfected with the wild-type plasmid were set equal to 1. *, differences with a P value of <0.05.
RTA induces m6A and enhances its own pre-mRNA splicing.
RTA is an IE gene that is both necessary and sufficient for KSHV lytic replication (67, 73). RTA not only directly targets several downstream lytic genes for active transcription but also enhances its own expression at the transcriptional level (74, 75). Since our data demonstrate that m6A is essential for KSHV lytic gene expression, we reasoned that RTA might induce m6A. To test this hypothesis, we induced RTA protein expression in iSLK-BAC16 cells, which carry a tetracycline-inducible RTA expression cassette, bacterial artificial chromosome 16 (BAC16), independently of KSHV genomes (76), with doxycycline. In a separate experiment, we transfected 293T cells with RTA expression plasmid pRTA-3×FLAG or an empty vector. We then isolated total RNAs from the cells, loaded 10 μg RNAs from each sample onto a nitrocellulose membrane, and measured the overall m6A levels in each sample on dot blots by using the anti-m6A antibody and subsequent chemiluminescence detection. As shown in Fig. 15A and B, expression of RTA strongly increased m6A levels in both iSLK-BAC16 and 293T cells. Data from MeRIP–qRT-PCR analysis further demonstrated significantly higher levels of m6A-mRNA of ORF50 (RTA) in iSLK-BAC16 cells after induction of RTA expression (Fig. 15C). Thus, RTA indeed induces m6A.
FIG 15.

KSHV lytic switch protein RTA (ORF50) induces m6A and enhances its own pre-mRNA splicing. (A) Western blot detection of RTA and β-tubulin in iSLK-BAC16 cells without (Control) and with doxycycline stimulation for 24 h and 293T cells at 48 h posttransfection with an equal amount (4 μg) of pRTA-3×FLAG (pRTA) or the empty vector. (B) Dot blot detection of m6A in 10 μg total RNAs isolated from the cells described in the legend to panel A, using an antibody to m6A and subsequent chemiluminescence detection. The blot was also stained with ethidium bromide (EtBr). (C) Relative levels of total mRNA and m6A-mRNA of ORF50 (RTA) in iSLK-BAC16 cells treated as described in the legend to panel A. (D) ORF50 (RTA) mRNA-to-pre-mRNA ratios in 293T cells cotransfected with wild-type pExon1-intron-exon2-GFP (WT; 2 μg) plus pRTA-3×FLAG (pRTA; 2 μg) or the empty vector (Vector; 2 μg) or mutant plasmids with site A or F mutated (Mut-A and Mut-F, respectively) with similar cotransfection combinations. *, differences that were statistically significant with P values of <0.05.
To test if RTA enhances its own pre-mRNA splicing in an m6A-dependent manner, we cotransfected equal numbers of 293T cells with the wild-type pExon1-intron-exon2-GFP plus pRTA-3×FLAG or the empty vector, as well as plasmids carrying Mut-A and Mut-F with the same cotransfection combinations, followed by RNA isolation at 48 h posttransfection and measurement of RTA mRNA and pre-mRNA levels and their ratios. As shown in Fig. 15D, the mRNA-to-pre-mRNA ratio was substantially higher in cells cotransfected with wild-type pExon1-intron-exon2-GFP and pRTA-3×FLAG than in cells cotransfected with pExon1-intron-exon2-GFP and the empty vector, suggesting that RTA enhances its own pre-mRNA splicing. In contrast, the mRNA-to-pre-mRNA ratio remained low in cells cotransfected with the mutant plasmids and pRTA-3×FLAG, suggesting that RTA enhancement of its own pre-mRNA splicing is m6A dependent.
DISCUSSION
Like all herpesviruses, latency is the default replication mode of KSHV. Previous studies suggested that the switch of KSHV from latency to productive lytic replication is primarily controlled at the viral chromatin level through histone and DNA modifications (58–65). In this study, we demonstrate that most KSHV-encoded mRNAs undergo posttranscriptional m6A modification. The level of m6A-mRNA increased in parallel with that of total mRNA for a given viral transcript when KSHV-infected cells were stimulated for lytic replication with agents such as TPA, NaB, H2O2, and TNF-α. Therefore, these stimuli not only activated the transcription of KSHV lytic genes but also simultaneously induced m6A modification of the viral transcripts. We observed that TPA downregulated the expression of FTO at both the mRNA and protein levels, which may have accounted for its effect on m6A induction. Nevertheless, the mechanisms by which the different lytic replication stimuli induce RNA m6A modification remain to be further investigated.
The remarkable increases in the levels of m6A-mRNA of most KSHV transcripts suggest that RNA m6A modification is an important event during viral lytic replication. Consistent with this notion, expressional KD or functional inhibition of the m6A demethylase FTO increased the levels of m6A and enhanced TPA induction of KSHV lytic gene expression. In contrast, KD of METTL3 had exactly the opposite effects, and DAA blocking of m6A abolished TPA induction of KSHV lytic gene expression and virion production. Collectively, these data suggest that m6A modification of KSHV transcripts represents a newly identified mechanism that plays a pivotal role in the control of viral lytic gene expression and replication at the posttranscriptional level.
Indeed, our results unequivocally revealed an essential role of m6A in regulating pre-mRNA splicing of KSHV lytic switch protein RTA. DAA blocking of m6A strongly inhibited RTA pre-mRNA splicing. Because DAA blocking of m6A also altered host gene expression, which may indirectly impact RTA pre-mRNA splicing, we then used a mutagenesis approach to examine this mechanism in ways that did not affect host genes. Multiple m6A sites were found in RTA pre-mRNA in the intron and exon2. In particular, m6A modification of sites A, B, and F in the intron near the two splicing sites appears to be indispensable for RTA pre-mRNA splicing, as mutation of these sites drastically reduced the levels of pre-mRNA splicing and RTA protein expression. Mutation of site G in exon2 near the splicing site also decreased the levels of pre-mRNA splicing and RTA protein expression. RNA m6A has been shown to regulate cellular RNA splicing by interacting with RNA binding proteins involved in splicing. In particular, m6A-modified pre-mRNAs are bound by m6A nuclear reader protein YTHDC1, which preferentially recruits SRSF3 over SRSF10 to regulate splicing (29). Data from a co-IP experiment demonstrated that these proteins are indeed associated with each other in KSHV-infected BCBL1 cells. Interestingly, data from RIP–qRT-PCR analysis indicated that the m6A level at site A in RTA pre-mRNA increases significantly upon TPA stimulation. YTHDC1, SRSF3, and SRSF10 are all present in this region, and mutation of site A substantially reduced the levels of these proteins. YTHDC1, SRSF3, and SRSF10 are also present in the region of m6A site F, and mutation of this site reduced the levels of YTHDC1 and SRSF3 without significantly affecting the level of SRSF10. These results suggest that recruitment of YTHDC1, SRSF3, and SRSF10 to m6A sites A and F, which are located in the intron near the two splicing sites, is crucial for ORF50 (RTA) pre-mRNA splicing. In contrast to sites A and F, the presence of SRSF10 decreased substantially with increased m6A levels when cells were stimulated with TPA, and mutation of this site decreased the presence of YTHDC1 but did not change the level of SRSF10, suggesting that the dissociation of SRSF10 from site G depends on m6A modification and is important for ORF50 (RTA) pre-mRNA splicing. Given that SRSF10 is generally involved in exclusion splicing, its presence at sites A and F might be necessary for exclusion of the intron, while its dissociation from site G might be important for inclusion of exon2 during ORF50 (RTA) pre-mRNA splicing. Therefore, we have identified m6A sites A, B, F, and G to be crucial cis-elements that interact with YTHDC1, SRSF3, and SRSF10 to regulate ORF50 (RTA) pre-mRNA splicing.
Mutation of the other sites in ORF50 (RTA) pre-mRNA did not seem to significantly affect splicing. However, the other sites may contribute to RTA expression through additional mechanisms. Indeed, when sites D, E, and F were all mutated, the levels of both pre-mRNA and mRNA decreased substantially (data not shown). Since an equal amount of plasmid DNA was used in the transfection experiment, we speculate that m6A modification of sites D, E, and F increases ORF50 (RTA) pre-mRNA stability, possibly by preventing RNA from decay. Furthermore, the polycistronic ORF50 (RTA) pre-mRNA is known to undergo differential splicing to generate at least 19 different transcripts. It is highly possible that the other m6A sites interact with additional m6A nuclear reader proteins, such as hn-RNP-C1/2 and hn-RNP-A2B1, to regulate differential splicing. Further studies are required to thoroughly investigate these mechanisms.
Since expression of RTA suffices to induce KSHV lytic replication, m6A regulation of ORF50 (RTA) pre-mRNA splicing is likely the starting point in the control of KSHV lytic replication. Very interestingly, by using two different cell types and expression systems, we consistently demonstrated that the RTA protein itself strongly induces m6A and enhances its own pre-mRNA splicing. RTA induction of m6A may also contribute to methylation of its downstream lytic transcripts to ensure their expression and completion of the viral lytic cycle. Consistent with this notion, the levels of m6A-mRNAs of late transcripts remained high several days after TPA treatment. Collectively, these findings lead to the conclusion that KSHV not only utilizes m6A to regulate ORF50 (RTA) pre-mRNA splicing but also has evolved a mechanism to manipulate the host m6A machinery to its advantage in promoting lytic replication.
In summary, we have revealed a new mechanism that controls KSHV lytic gene expression at the posttranscriptional level through m6A-dependent regulation of ORF50 (RTA) pre-mRNA splicing. This process may also contribute to KSHV lytic gene expression through other mechanisms, such as RNA export and protein translation, which merit further investigation. These findings provide new insights into the development of strategies for the control of KSHV infection and treatment of its associated diseases.
MATERIALS AND METHODS
Cell culture, media, and reagents.
Telomerase-immortalized human umbilical vein endothelial cells (HUVECs) with KSHV infection (TIVE-KSHV cells) (77), KS tumor cells carrying the recombinant KSHV bacterial artificial chromosome 16 (BAC16) (iSLK-BAC16 cells) (76), and human embryonic kidney 293T cells were cultured in Dulbecco's modified Eagle medium (DMEM) plus 10% fetal bovine serum (FBS). KSHV-positive PEL cells (BCBL1 cells) (50) were grown in RPMI 1640 medium plus 10% FBS. Primary HUVECs were grown in endothelial growth basal medium (EBM-2) with growth factor supplements (Lonza, Allendale, NJ, USA).
All chemicals, including 12-O-tetradecanoyl-phorbol-13-acetate (TPA), sodium butyrate (NaB), hydrogen peroxide (H2O2), meclofenamic acid (MA), and 3-deazaadenosine (DAA), were purchased from Sigma-Aldrich (St. Louis, MO, USA). Stock solutions of all reagents were prepared in phosphate-buffered saline (PBS).
m6A-modified RIP (MeRIP) and qRT-PCR quantification of total mRNA and m6A-mRNA.
Total RNAs were isolated from BCBL1 or TIVE-KSHV cells treated with PBS or TPA using an RNeasy Plus minikit from Qiagen (Valencia, CA, USA), a process that began with the removal of contaminating genomic DNA. RNA immunoprecipitation (RIP) assays were carried out by using an RNA binding protein immunoprecipitation kit from EDM Millipore (Billerica, MA, USA) according to the instructions of the manufacturer. For each RNA sample, 5 μg of total RNAs with 2.5 μg of a rabbit polyclonal antibody to m6A from Cedarlane (Burlington, NC, USA) or control rabbit IgG was used per RIP reaction, and 5 μg of the same RNA was used as the input. The RIP products and the input RNA were then converted into cDNA by using SuperScript II reverse transcriptase from Invitrogen (Carlsbad, CA, USA) and a poly(T) oligonucleotide primer.
qRT-PCR was conducted to measure the amount of each of the KSHV-encoded transcripts from the input RNA and RIP products by using the primers described previously (68). The level of mRNA of the housekeeping gene β-actin was used as a reference for normalization, using the primers listed in Table 2. From the levels of the input RNAs, we measured the relative levels of total mRNA of each viral transcript. For a given viral transcript, the level of total mRNA, given as the threshold cycle (CT) value, for each sample was first normalized to the level of β-actin RNA given as the CT value, generating a change in CT (ΔCT) value. The level of total mRNA for the transcripts in cells treated with PBS was set as a reference and was equal to 1, and the relative level (fold change, referred to as “folds” throughout the figures) of total mRNA of the same transcript in cells treated with TPA was calculated by using the formula 1/2ΔΔCT, where ΔΔCT is the difference in the ΔCT values between cells treated with TPA and cells treated with PBS. From the MeRIP products, we measured the levels of m6A-mRNA. For a given viral transcript, the CT value in each MeRIP product was first normalized to that of β-actin mRNA of the corresponding sample, generating a ΔCT value. The level of m6A-mRNA for the transcript in cells treated with PBS was set as a reference and was equal to 1, and the relative level (fold change) of m6A-mRNA in cells treated with TPA was calculated by using the formula 1/2ΔΔCT, where ΔΔCT is the difference in ΔCT values between cells treated with TPA and cells treated with PBS. Finally, the amount of m6A-mRNA as a percentage of the total mRNA of β-actin was determined by using the formula 100 × 1/2ΔCT, where ΔCT is the difference in the CT values between the RIP product and the input of the same RNA sample. All qRT-PCRs were carried out in triplicate.
TABLE 2.
Primers used in the study
| Primer | Sequencea | Application |
|---|---|---|
| P1 | 5′-TTGAATTCTTACTCCGCAAGGGGTAGTCTGTTG-3′ | RTA exon1-intron-exon2, forward |
| P2 | 5′-TTAGATCTCCATTGGTGCAGCTGGTACAGTGTGCC-3′ | RTA exon1-intron-exon2, reverse |
| P3 | 5′-TTGGATCCGTGAGCAAGGGCGCCGAGCTGTTC-3′ | GFP ORF, forward |
| P4 | 5′-TCGCGGCCGCTCACTTGTACAGCTC-3′ | GFP ORF, reverse |
| P5 | 5′-TCAGGAGAGTTAGGGCCGTGCTGATTATG-3′ | m6A site A mutation |
| P6 | 5′-CGTGCTGATTATGTGGCCAAGCTTCTGCTCG-3′ | m6A site B mutation |
| P7 | 5′-GCGGAGACGGCCGGCCGCTCCCACAAAA-3′ | m6A site C mutation |
| P8 | 5′-TTGTCGGTGCTGGCCCAATATCTGAATGG-3′ | m6A site D mutation |
| P9 | 5′-GGGTGGCGACGGCCAGGGTATCTAAC-3′ | m6A site E mutation |
| P10 | 5′-TATCTGATCCCAGGCCGGTAATGATACC-3′ | m6A site F mutation |
| P11 | 5′-CTTCGTCGGCCTCTCGGCCGAACTGAAGGC-3′ | m6A site G mutation |
| P12 | 5′-CCTCTCGAATGAGGCCCAAAGGCGCGG-3′ | m6A site H mutation |
| P13 | 5′-GCAAGGTCACTGGCCTGTCCTATCCAGG-3′ | m6A site I mutation |
| P14 | 5′-TCCTGGAGCCAGGCCTGTTGCCGGCTTC-3′ | m6A site J mutation |
| P15 | 5′-AGGCACCACTCTGTGCAGTCCGC-3′ | RTA pre-mRNA, forward |
| P16 | 5′-TCCCTGCAGCAGTTGTACAAACTTG-3′ | RTA pre-mRNA, reverse |
| P17 | 5′-CCATTGGTGCAGCTGGTACAGTGTGCC-3′ | RTA pre-mRNA cDNA synthesis |
| P18 | 5′-GAACAGTCGGGTGTCAGGGCTC-3′ | CLIPb–qRT-PCR, site A, forward |
| P19 | 5′-GCGGTGCATTTACGAGCAGAAG-3′ | CLIP–qRT-PCR, site A, reverse |
| P20 | 5′-GGCAGTCTGGATTGAGGGTG-3′ | CLIP–qRT-PCR, site F, forward |
| P21 | 5′-GGAGAGAGTGGCGTGTCATAG-3′ | CLIP–qRT-PCR, site F, reverse |
| P22 | 5′-GCTTCGGCGGTCCTGTGTGG-3′ | CLIP–qRT-PCR, site G, forward |
| P23 | 5′-TTAGGTCACTGGGATCGTAG-3′ | CLIP–qRT-PCR, site G, reverse |
| P24 | 5′-GTTGTGATGGCTGACCCACCCTG-3′ | METTL3 mRNA, forward |
| P25 | 5′-GGTTCAACCAGTGACCTGTACGGC-3′ | METTL3 mRNA, reverse |
| P26 | 5′-TCTGACCCCCAAAGATGATG-3′ | FTO mRNA, forward |
| P27 | 5′-CTCGGAGAATTAGTTTAGGATATTTCA-3′ | FTO mRNA, reverse |
| P28 | 5′-ATTGCCGACAGGATGCAGA-3′ | β-Actin mRNA, forward |
| P29 | 5′-GAGTACTTGCGCTCAGGAGGA-3′ | β-Actin mRNA, reverse |
m6A sites with an A → C mutation are highlighted in bold.
CLIP, UV cross-linking and immunoprecipitation.
FTO and METTL3 knockdown (KD) and Western blot detection of viral proteins.
Two different sets of lentiviral particles expressing shRNA specific for human FTO or METTL3 or control shRNA were purchased from Santa Cruz Biotechnologies (Dallas, TX, USA) and Origene Technologies, Inc. (Rockville, MD, USA). shRNA for FTO or METTL3 from Santa Cruz Biotechnologies consists of a pool of shRNA from lentiviruses expressing three target-specific 19- to 25-nt shRNAs. The shRNA specific for FTO or METTL3 from Origene Technologies, Inc., consists of a pool of shRNA from lentiviruses expressing four unique 29-mer shRNAs. Two days after lentiviral transduction, BCBL1 cells stably expressing FTO-specific shRNA, METTL3-specific shRNA, or control shRNA were selected with puromycin at 5 g/ml. KD of FTO or METTL3 was verified by qRT-PCR measurement of their mRNAs and Western blot detection of their proteins using a sheep anti-FTO antibody from R&D Systems, Inc. (Minneapolis, MN, USA) and a mouse monoclonal antibody to METTL3 from Santa Cruz Biotechnologies, respectively. KSHV proteins were detected by Western blot using a mouse monoclonal antibody specific for KSHV lytic protein RTA (ORF50) (a gift from the Pasteur Research Institute, Shanghai, China), a rat antibody for KSHV latent nuclear antigen (LANA; ORF73) from Advanced Biotechnologies, Inc. (Columbia, MD, USA), two mouse monoclonal antibodies for KSHV lytic proteins ORF57 and ORF62 from Santa Cruz Biotechnologies, and a mouse monoclonal antibody for KSHV small capsid protein (ORF65) from Shoujiang Gao's lab at the University of Texas Health Science Center at San Antonio (San Antonio, TX, USA).
KSHV production and titration.
Identical numbers (6 × 10⁷) of BCBL1 cells carrying the recombinant KSHV (BAC36) were stimulated with PBS (placebo) or TPA (20 ng/ml) in the absence or presence of MA (1 μM) or DAA (25 μM) for 24 h. Upon replacement of the stimulation medium with fresh RPMI 1640 plus 10% FBS and continuous culture for 4 days, the supernatants were collected and centrifuged at low speed (4,000 × g, 15 min) to remove cellular debris. An identical amount (1 ml) of each supernatant was then used to infect HUVECs in 12-well plates. Cells from each well were collected at 72 h postinfection and counted with a hemocytometer under a fluorescence microscope. The numbers of GFP-positive cells and the total number of cells from 8 independent readings were used to calculate the average percentage of GFP-positive cells as the relative viral titer of the supernatant in question.
Mapping m6A sites by MeRIP-seq.
Total RNAs were isolated from BCBL1 cells that had been treated with TPA for 24 h by using an RNeasy Plus minikit from Qiagen. A total amount of 400 μg RNAs per RIP assay was fragmented to generate ∼100-base RNA fragments by using the NEBNext magnesium RNA fragmentation module from New England BioLabs (Ipswich, MA, USA). The fragmented RNAs were then used for MeRIP with the anti-m6A antibody (10 μg/reaction mixture), which was done in triplicate. RNAs from the RIP products were purified with a Qiagen miRNeasy minikit and subjected to deep sequencing by using an Illumina HiSeq 2500 instrument. The reads were trimmed with TrimGalore, a wrapper script for the FastQC and Cutadapt programs, and then aligned to the KSHV genome (GenBank accession number NC_009333.1) using the STARaligner RNA sequence aligner with default settings. Peaks in the alignments were determined using the MACS2 peak caller.
Plasmid construction and in vitro mutagenesis.
The 2.2-kpb ORF50 (RTA) exon1-intron-exon2 fragment with an EcoRI site at the 5′ end and a BglII site at the 3′ end was obtained by PCR amplification using the recombinant KSHV BAC16 as the template and the primers listed in Table 2. The 0.8-kbp GFP ORF with a BamHI site at the 5′ end and a NotI site at the 3′ end was obtained by PCR amplification using the pEGFP-C1 plasmid from TaKaRa Bio USA, Inc. (Mountain View, CA, USA), as the template. The two DNA fragments were digested with BglII and BamHI, respectively, and then used in a T4 DNA ligase reaction to generate an in-frame fusion between ORF50 (RTA) and GFP. Upon digestion with EcoRI and NotI, the resulting exon1-intron-exon2-GFP fragment was inserted into the pCMV-myc vector from TaKaRa Bio USA, Inc., giving rise to the plasmid pExon1-intron-exon2-GFP. Mutagenesis (GGAC → GGCC) of each m6A site in the ORF50 (RTA) fragment was carried out by using pExon1-intron-exon2-GFP as the template and a QuikChange site-directed mutagenesis kit from Agilent Technologies (Santa Clara, CA, USA). Successful mutation of each site was verified by DNA sequencing. The plasmid pRTA-3×FLAG was generated by in-frame cloning of full-length ORF50 into the C terminus of the p3×FLAG-CMV vector from Sigma-Aldrich. All plasmids were purified from Escherichia coli by using a Qiagen endotoxin-free plasmid purification kit.
RIP–qRT-PCR measurement of RNA bound by YTHDC1, SRSF3, and SRSF10.
Equal numbers (2 × 10⁷) of BCBL1 cells were treated with PBS or TPA for 24 h. In parallel, 293T cells seeded in a 6-well plate were transfected with equal amounts (4 μg) of wild-type pExon1-intron-exon2-GFP and mutant plasmids Mut-A, Mut-F, and Mut-G and collected at 48 h posttransfection. All cells were washed once with ice-cold PBS and resuspended in 5 ml ice-cold PBS. One-tenth (500 μl) of each sample was saved for RNA purification and used as the input before RNase A digestion. All cells were then subjected to three exposures of UV cross-linking (200 mJ/cm2, 1 min per exposure). The cells were collected by centrifugation, and the pellets were resuspended by sonication in 0.9 ml RIP lysis buffer containing 0.1% SDS, 1% Triton X-100, 20 mM Tris-HCl (pH 8.0), 150 mM NaCl, and DNase I (RNase-free, 2 U/ml) from New England BioLabs and a protease inhibitor cocktail (Sigma-Aldrich). Upon partial RNase A digestion at a low concentration (100 ng/ml; a 1:100,000 dilution of an RNase A stock solution) for 30 min at 37°C, 100 μl of each sample was saved as a control after RNase A digestion. For RIP, 100 μl of each sample and 50 μl protein G magnetic beads from Thermo Fisher Scientific (Waltham, MA, USA) that had been preincubated with 2.5 μg antibodies to YTHDC1 (Bethyl Laboratories, Inc., Montgomery, TX, USA), SRSF3 (Medical & Biological Laboratories, Co., Ltd., Japan), SRSF10 (Medical & Biological Laboratories, Co., Ltd.), or m6A or control IgG (Sigma-Aldrich) were added to and mixed with 900 μl RIP buffer from EDM Millipore. After incubation with rotation at 4°C for 12 h, the beads were washed six times with ice-cold RIP buffer. The beads were then resuspended in 500 μl elution buffer containing 20 mM Tris-HCl (pH 8.0), 250 mM NaCl, 50 mM EDTA, 0.1% SDS, 1% Triton X-100, and 3 mg/ml proteinase K, and the suspension was incubated at 37°C for 30 min. RNAs from the input and the RIP products were purified by using a Qiagen RNeasy Plus minikit. Equal amounts of RNAs from the input, the control, and the RIP products of each sample were converted into cDNAs using reverse transcriptase and random primers. The levels of RNA fragments bound by YTHDC1, SRSF3, or SRSF10 at a specific m6A site in each sample were measured by qRT-PCR with the primers listed in Table 2. For the comparison of different samples, the level of RIP product from each sample was first normalized to that of β-actin mRNA in the input. All qRT-PCRs were carried out in triplicate.
ACKNOWLEDGMENTS
This study was supported in part by grant R56DE023912 from the National Institute of Dental and Craniofacial Research of the National Institutes of Health and the CWRU/UH Center for AIDS Research through NIH grant P30 AI036219.
We declare no conflict of interest.
REFERENCES
- 1.Dominissini D, Moshitch-Moshkovitz S, Schwartz S, Salmon-Divon M, Ungar L, Osenberg S, Cesarkas K, Jacob-Hirsch J, Amariglio N, Kupiec M, Sorek R, Rechavi G. 2012. Topology of the human and mouse m6A RNA methylomes revealed by m6A-seq. Nature 485:201–206. doi: 10.1038/nature11112. [DOI] [PubMed] [Google Scholar]
- 2.Meyer KD, Saletore Y, Zumbo P, Elemento O, Mason CE, Jaffrey SR. 2012. Comprehensive analysis of mRNA methylation reveals enrichment in 3′ UTRs and near stop codons. Cell 149:1635–1646. doi: 10.1016/j.cell.2012.05.003. [DOI] [PMC free article] [PubMed] [Google Scholar]
- 3.Adams JM, Cory S. 1975. Modified nucleosides and bizarre 5′-termini in mouse myeloma mRNA. Nature 255:28–33. doi: 10.1038/255028a0. [DOI] [PubMed] [Google Scholar]
- 4.Desrosiers R, Friderici K, Rottman F. 1974. Identification of methylated nucleosides in messenger RNA from Novikoff hepatoma cells. Proc Natl Acad Sci U S A 71:3971–3975. doi: 10.1073/pnas.71.10.3971. [DOI] [PMC free article] [PubMed] [Google Scholar]
- 5.Furuichi Y, Morgan M, Shatkin AJ, Jeline W, Salditt-Georgieff M, Darnell JE. 1975. Methylated, blocked 5-termini in HeLa cell mRNA. Proc Natl Acad Sci U S A 72:1904–1908. doi: 10.1073/pnas.72.5.1904. [DOI] [PMC free article] [PubMed] [Google Scholar]
- 6.Furuichi Y, Shatkin AJ, Stavnezer E, Bishop JM. 1975. Blocked, methylated 5′-terminal sequence in avian sarcoma virus RNA. Nature 257:618–620. doi: 10.1038/257618a0. [DOI] [PubMed] [Google Scholar]
- 7.Wei CM, Gershowitz A, Moss B. 1975. Methylated nucleotides block 5′ terminus of HeLa cell messenger RNA. Cell 4:379–386. doi: 10.1016/0092-8674(75)90158-0. [DOI] [PubMed] [Google Scholar]
- 8.Cao G, Li HB, Yin Z, Flavell RA. 2016. Recent advances in dynamic m6A RNA modification. Open Biol 6:160003. doi: 10.1098/rsob.160003. [DOI] [PMC free article] [PubMed] [Google Scholar]
- 9.Meyer KD, Jaffrey SR. 2014. The dynamic epitranscriptome: N6-methyladenosine and gene expression control. Nat Rev Mol Cell Biol 15:313–326. doi: 10.1038/nrm3785. [DOI] [PMC free article] [PubMed] [Google Scholar]
- 10.Nilsen TW. 2014. Molecular biology. Internal mRNA methylation finally finds functions. Science 343:1207–1208. doi: 10.1126/science.1249340. [DOI] [PubMed] [Google Scholar]
- 11.Liu J, Yue Y, Han D, Wang X, Fu Y, Zhang L, Jia G, Yu M, Lu Z, Deng X, Dai Q, Chen W, He C. 2014. A METTL3-METTL14 complex mediates mammalian nuclear RNA N6-adenosine methylation. Nat Chem Biol 10:93–95. doi: 10.1038/nchembio.1432. [DOI] [PMC free article] [PubMed] [Google Scholar]
- 12.Ping XL, Sun BF, Wang L, Xiao W, Yang X, Wang WJ, Adhikari S, Shi Y, Lv Y, Chen YS, Zhao X, Li A, Yang Y, Dahal U, Lou XM, Liu X, Huang J, Yuan WP, Zhu F, Cheng T, Zhao YL, Wang X, Rendtlew Danielsen JM, Liu F, Yang YG. 2014. Mammalian WTAP is a regulatory subunit of the RNA N6-methyladenosine methyltransferase. Cell Res 24:177–189. doi: 10.1038/cr.2014.3. [DOI] [PMC free article] [PubMed] [Google Scholar]
- 13.Fu Y, Jia G, Pang X, Wang RN, Wang X, Li CJ, Smemo S, Dai Q, Bailey KA, Nobrega MA, Han KL, Cui Q, He C. 2013. FTO-mediated formation of N6-hydroxymethyladenosine and N6-formyladenosine in mammalian RNA. Nat Commun 4:1798. doi: 10.1038/ncomms2822. [DOI] [PMC free article] [PubMed] [Google Scholar]
- 14.Jia G, Fu Y, Zhao X, Dai Q, Zheng G, Yang Y, Yi C, Lindahl T, Pan T, Yang YG, He C. 2011. N6-methyladenosine in nuclear RNA is a major substrate of the obesity-associated FTO. Nat Chem Biol 7:885–887. doi: 10.1038/nchembio.687. [DOI] [PMC free article] [PubMed] [Google Scholar]
- 15.Niu Y, Zhao X, Wu YS, Li MM, Wang XJ, Yang YG. 2013. N6-methyl-adenosine (m6A) in RNA: an old modification with a novel epigenetic function. Genomics Proteomics Bioinformatics 11:8–17. doi: 10.1016/j.gpb.2012.12.002. [DOI] [PMC free article] [PubMed] [Google Scholar]
- 16.Zhao X, Yang Y, Sun BF, Shi Y, Yang X, Xiao W, Hao YJ, Ping XL, Chen YS, Wang WJ, Jin KX, Wang X, Huang CM, Fu Y, Ge XM, Song SH, Jeong HS, Yanagisawa H, Niu Y, Jia GF, Wu W, Tong WM, Okamoto A, He C, Rendtlew Danielsen JM, Wang XJ, Yang YG. 2014. FTO-dependent demethylation of N6-methyladenosine regulates mRNA splicing and is required for adipogenesis. Cell Res 24:1403–1419. doi: 10.1038/cr.2014.151. [DOI] [PMC free article] [PubMed] [Google Scholar]
- 17.Zheng G, Dahl JA, Niu Y, Fedorcsak P, Huang CM, Li CJ, Vagbo CB, Shi Y, Wang WL, Song SH, Lu Z, Bosmans RP, Dai Q, Hao YJ, Yang X, Zhao WM, Tong WWM, Wang XJ, Bogdan F, Furu K, Fu Y, Jia G, Zhao X, Liu J, Krokan HE, Klungland A, Yang YG, He C. 2013. ALKBH5 is a mammalian RNA demethylase that impacts RNA metabolism and mouse fertility. Mol Cell 49:18–29. doi: 10.1016/j.molcel.2012.10.015. [DOI] [PMC free article] [PubMed] [Google Scholar]
- 18.Ke S, Alemu EA, Mertens C, Gantman EC, Fak JJ, Mele A, Haripal B, Zucker-Scharff I, Moore MJ, Park CY, Vagbo CB, Kussnierczyk A, Klungland A, Darnell JE, Darnell RB. 2015. A majority of m6A residues are in the last exons, allowing the potential for 3′ UTR regulation. Genes Dev 29:2037–2053. doi: 10.1101/gad.269415.115. [DOI] [PMC free article] [PubMed] [Google Scholar]
- 19.Choi J, Ieong KW, Demirci H, Chen J, Petrov A, Prabhakar A, O'Leary SE, Dominissini D, Rechavi G, Soltis SM, Ehrenberg M, Puglisi JD. 2016. N(6)-methyladenosine in mRNA disrupts tRNA selection and translation-elongation dynamics. Nat Struct Mol Biol 23:110–115. doi: 10.1038/nsmb.3148. [DOI] [PMC free article] [PubMed] [Google Scholar]
- 20.Liu N, Dai Q, Zheng G, He C, Parisien M, Pan T. 2015. N(6)-methyladenosine-dependent RNA structural switches regulate RNA-protein interactions. Nature 518:560–564. doi: 10.1038/nature14234. [DOI] [PMC free article] [PubMed] [Google Scholar]
- 21.Sun Q, Huang S, Wang X, Zhu Y, Chen Z, Chen D. 2015. N6-methyladenine functions as a potential epigenetic mark in eukaryotes. Bioessays 37:1155–1162. doi: 10.1002/bies.201500076. [DOI] [PubMed] [Google Scholar]
- 22.Wang X, Lu Z, Gomez A, Hon GC, Yue Y, Han D, Fu Y, Parisien M, Dai Q, Jia G, Ren B, Pan T, He C. 2014. N6-methyladenosine-dependent regulation of messenger RNA stability. Nature 505:117–120. doi: 10.1038/nature12730. [DOI] [PMC free article] [PubMed] [Google Scholar]
- 23.Wang X, Zhao BS, Roundtree IA, Lu Z, Han D, Ma H, Weng X, Chen K, Shi H, He C. 2015. N(6)-methyladenosine modulates messenger RNA translation efficiency. Cell 161:1388–1399. doi: 10.1016/j.cell.2015.05.014. [DOI] [PMC free article] [PubMed] [Google Scholar]
- 24.Zhou J, Wan J, Gao X, Zhang X, Jaffrey SR, Qian SB. 2015. Dynamic m(6)A mRNA methylation directs translational control of heat shock response. Nature 526:591–594. doi: 10.1038/nature15377. [DOI] [PMC free article] [PubMed] [Google Scholar]
- 25.Alarcon CR, Goodarzi H, Lee H, Liu X, Tavazoie S, Tavazoie SF. 2015. HNRNPA2B1 is a mediator of m(6)A-dependent nuclear RNA processing events. Cell 162:1299–1308. doi: 10.1016/j.cell.2015.08.011. [DOI] [PMC free article] [PubMed] [Google Scholar]
- 26.Zhou KI, Parisien M, Dai Q, Liu N, Diatchenko L, Sachleben JR, Pan T. 2016. N(6)-methyladenosine modification in a long noncoding RNA hairpin predisposes its conformation to protein binding. J Mol Biol 428:822–833. doi: 10.1016/j.jmb.2015.08.021. [DOI] [PMC free article] [PubMed] [Google Scholar]
- 27.Adhikari S, Xiao W, Zhao YL, Yang YG. 2016. m(6)A: signaling for mRNA splicing. RNA Biol 13:756–759. doi: 10.1080/15476286.2016.1201628. [DOI] [PMC free article] [PubMed] [Google Scholar]
- 28.Patil DP, Chen CK, Pickering BF, Chow A, Jackson C, Guttman M, Jaffrey SR. 2016. m6A RNA methylation promotes XIST-mediated transcriptional repression. Nature 537:369–373. doi: 10.1038/nature19342. [DOI] [PMC free article] [PubMed] [Google Scholar]
- 29.Xiao W, Adhikari S, Dahal U, Chen YS, Hao YJ, Sun BF, Sun HY, Li A, Ping XL, Lai WY, Wang X, Ma HL, Huang CM, Yang Y, Huang N, Jiang GB, Wang HL, Zhou Q, Wang XJ, Zhao YL, Yang YG. 2016. Nuclear m(6)A reader YTHDC1 regulates mRNA splicing. Mol Cell 61:507–519. doi: 10.1016/j.molcel.2016.01.012. [DOI] [PubMed] [Google Scholar]
- 30.Sen S, Talukdar I, Webster NJ. 2009. SRp20 and CUG-BP1 modulate insulin receptor exon 11 alternative splicing. Mol Cell Biol 29:871–880. doi: 10.1128/MCB.01709-08. [DOI] [PMC free article] [PubMed] [Google Scholar]
- 31.Zhou X, Wu W, Li H, Cheng Y, Wei N, Zong J, Feng X, Xie Z, Chen D, Manley JL, Wang H, Feng Y. 2014. Transcriptome analysis of alternative splicing events regulated by SRSF10 reveals position-dependent splicing modulation. Nucleic Acids Res 42:4019–4030. doi: 10.1093/nar/gkt1387. [DOI] [PMC free article] [PubMed] [Google Scholar]
- 32.Zhou X, Wu W, Wei N, Cheng Y, Xie Z, Feng Y. 2014. Genome-wide analysis of SRSF10-regulated alternative splicing by deep sequencing of chicken transcriptome. Genomics Data 2:20–23. doi: 10.1016/j.gdata.2014.02.001. [DOI] [PMC free article] [PubMed] [Google Scholar]
- 33.Meyer KD, Patil DP, Zhou J, Zinoviev A, Skabkin MA, Elemento O, Pestova TV, Qian SB, Jaffrey SR. 2015. 5′ UTR m(6)A promotes cap-independent translation. Cell 163:999–1010. doi: 10.1016/j.cell.2015.10.012. [DOI] [PMC free article] [PubMed] [Google Scholar]
- 34.Ben-Haim MS, Moshitch-Moshkovitz S, Rechavi G. 2015. FTO: linking m6A demethylation to adipogenesis. Cell Res 25:3–4. doi: 10.1038/cr.2014.162. [DOI] [PMC free article] [PubMed] [Google Scholar]
- 35.Geula S, Moshitch-Moshkovitz S, Dominissini D, Mansour AA, Kol N, Salmon-Divon M, Hershkovitz V, Peer E, Mor N, Manor YS, Ben-Haim MS, Eyal E, Yunger S, Pinto Y, Jaitin DA, Viukov S, Rais Y, Krupalnik V, Chomsky E, Zerbib M, Maza I, Rechavi Y, Massarwa R, Hanna S, Amit I, Levanon EY, Amariglio N, Stern-Ginossar N, Novershtern N, Rechavi G, Hanna JH. 2015. Stem cells. m6A mRNA methylation facilitates resolution of naive pluripotency toward differentiation. Science 347:1002–1006. doi: 10.1126/science.1261417. [DOI] [PubMed] [Google Scholar]
- 36.Kwok CT, Marshall AD, Rasko JE, Wong JJ. 2017. Genetic alterations of m6A regulators predict poorer survival in acute myeloid leukemia. J Hematol Oncol 10:39. doi: 10.1186/s13045-017-0410-6. [DOI] [PMC free article] [PubMed] [Google Scholar]
- 37.Zhang Y, Guo F, Zhao R. 2016. Hepatic expression of FTO and fatty acid metabolic genes changes in response to lipopolysaccharide with alterations in m6A modification of relevant mRNAs in the chicken. Br Poult Sci 57:628–635. doi: 10.1080/00071668.2016.1201199. [DOI] [PubMed] [Google Scholar]
- 38.Zhao BS, He C. 2015. Fate by RNA methylation: m6A steers stem cell pluripotency. Genome Biol 16:43. doi: 10.1186/s13059-015-0609-1. [DOI] [PMC free article] [PubMed] [Google Scholar]
- 39.Li Z, Weng H, Su R, Weng X, Zuo Z, Li C, Huang H, Nachtergaele S, Dong L, Hu C, Qin X, Tang L, Wang Y, Hong GM, Wang X, Chen P, Gurbuxani S, Arnovitz S, Li Y, Li S, Strong J, Neilly MB, Larson RA, Jiang X, Zhang P, Jin J, He C, Chen J. 2017. FTO plays an oncogenic role in acute myeloid leukemia as a N6-methyladenosine RNA demethylase. Cancer Cell 31:127–141. doi: 10.1016/j.ccell.2016.11.017. [DOI] [PMC free article] [PubMed] [Google Scholar]
- 40.Canaani D, Kahana C, Lavi S, Groner Y. 1979. Identification and mapping of N6-methyladenosine containing sequences in simian virus 40 RNA. Nucleic Acids Res 6:2879–2899. doi: 10.1093/nar/6.8.2879. [DOI] [PMC free article] [PubMed] [Google Scholar]
- 41.Finkel D, Groner Y. 1983. Methylations of adenosine residues (m6A) in pre-mRNA are important for formation of late simian virus 40 mRNAs. Virology 131:409–425. doi: 10.1016/0042-6822(83)90508-1. [DOI] [PubMed] [Google Scholar]
- 42.Hashimoto SI, Green M. 1976. Multiple methylated cap sequences in adenovirus type 2 early mRNA. J Virol 20:425–435. [DOI] [PMC free article] [PubMed] [Google Scholar]
- 43.Krug RM, Morgan MA, Shatkin AJ. 1976. Influenza viral mRNA contains internal N6-methyladenosine and 5′-terminal 7-methylguanosine in cap structures. J Virol 20:45–53. [DOI] [PMC free article] [PubMed] [Google Scholar]
- 44.Sommer S, Salditt-Georgieff M, Bachenheimer S, Darnell JE, Furuichi Y, Morgan M, Shatkin AJ. 1976. The methylation of adenovirus-specific nuclear and cytoplasmic RNA. Nucleic Acids Res 3:749–765. doi: 10.1093/nar/3.3.749. [DOI] [PMC free article] [PubMed] [Google Scholar]
- 45.Kennedy EM, Bogerd HP, Kornepati AV, Kang D, Ghoshal D, Marshall JB, Poling BC, Tsai K, Gokhale NS, Horner SM, Cullen BR. 2016. Posttranscriptional m(6)A editing of HIV-1 mRNAs enhances viral gene expression. Cell Host Microbe 19:675–685. doi: 10.1016/j.chom.2016.04.002. [DOI] [PMC free article] [PubMed] [Google Scholar]
- 46.Lichinchi G, Gao S, Saletore Y, Gonzalez GM, Bansal V, Wang Y, Mason CE, Rana TM. 2016. Dynamics of the human and viral m(6)A RNA methylomes during HIV-1 infection of T cells. Nat Microbiol 1:16011. doi: 10.1038/nmicrobiol.2016.11. [DOI] [PMC free article] [PubMed] [Google Scholar]
- 47.Tirumuru N, Zhao BS, Lu W, Lu Z, He C, Wu L. 2016. N(6)-methyladenosine of HIV-1 RNA regulates viral infection and HIV-1 Gag protein expression. eLife 5:e15528. doi: 10.7554/eLife.15528. [DOI] [PMC free article] [PubMed] [Google Scholar]
- 48.Toro-Ascuy D, Rojas-Araya B, Valiente-Echeverria F, Soto-Rifo R. 2016. Interactions between the HIV-1 unspliced mRNA and host mRNA decay machineries. Viruses 8:E320. [DOI] [PMC free article] [PubMed] [Google Scholar]
- 49.Ye F, Karn J. 2016. Viruses, mark thy message well. Cell Host Microbe 19:568–570. doi: 10.1016/j.chom.2016.04.018. [DOI] [PubMed] [Google Scholar]
- 50.Cesarman E, Nador RG, Aozasa K, Delsol G, Said JW, Knowles DM. 1996. Kaposi's sarcoma-associated herpesvirus in non-AIDS related lymphomas occurring in body cavities. Am J Pathol 149:53–57. [PMC free article] [PubMed] [Google Scholar]
- 51.Chang Y, Cesarman E, Pessin MS, Lee F, Culpepper J, Knowles DM, Moore PS. 1994. Identification of herpesvirus-like DNA sequences in AIDS-associated Kaposi's sarcoma. Science 266:1865–1869. doi: 10.1126/science.7997879. [DOI] [PubMed] [Google Scholar]
- 52.Gessain A, Sudaka A, Briere J, Fouchard N, Nicola MA, Rio B, Arborio M, Troussard X, Audouin J, Diebold J, De The G. 1996. Kaposi sarcoma-associated herpes-like virus (human herpesvirus type 8) DNA sequences in multicentric Castleman's disease: is there any relevant association in non-human immunodeficiency virus-infected patients? Blood 87:414–416. [PubMed] [Google Scholar]
- 53.Said JW, Tasaka T, Takeuchi S, Asou H, de Vos S, Cesarman E, Knowles DM, Koeffler HP. 1996. Primary effusion lymphoma in women: report of two cases of Kaposi's sarcoma herpes virus-associated effusion-based lymphoma in human immunodeficiency virus-negative women. Blood 88:3124–3128. [PubMed] [Google Scholar]
- 54.Dissinger NJ, Damania B. 2016. Recent advances in understanding Kaposi's sarcoma-associated herpesvirus. F1000Res 5:740. doi: 10.12688/f1000research.7612.1. [DOI] [PMC free article] [PubMed] [Google Scholar]
- 55.Laney AS, Cannon MJ, Jaffe HW, Offermann MK, Ou CY, Radford KW, Patel MM, Spira TJ, Gunthel CJ, Pellett PE, Dollard SC. 2007. Human herpesvirus 8 presence and viral load are associated with the progression of AIDS-associated Kaposi's sarcoma. AIDS 21:1541–1545. doi: 10.1097/QAD.0b013e3282202b7d. [DOI] [PubMed] [Google Scholar]
- 56.Latini A, Bonadies A, Trento E, Bultrini S, Cota C, Solivetti FM, Ferraro C, Ardigo M, Amorosi B, Palamara G, Bucher S, Giuliani M, Cordiali-Fei P, Ensoli F, Di Carlo A. 2012. Effective treatment of Kaposi's sarcoma by electrochemotherapy and intravenous bleomycin administration. Dermatol Ther 25:214–218. doi: 10.1111/j.1529-8019.2012.01437.x. [DOI] [PubMed] [Google Scholar]
- 57.Robles R, Lugo D, Gee L, Jacobson MA. 1999. Effect of antiviral drugs used to treat cytomegalovirus end-organ disease on subsequent course of previously diagnosed Kaposi's sarcoma in patients with AIDS. J Acquir Immune Defic Syndr Hum Retrovirol 20:34–38. doi: 10.1097/00042560-199901010-00005. [DOI] [PubMed] [Google Scholar]
- 58.Chen J, Ueda K, Sakakibara S, Okuno T, Parravicini C, Corbellino M, Yamanishi K. 2001. Activation of latent Kaposi's sarcoma-associated herpesvirus by demethylation of the promoter of the lytic transactivator. Proc Natl Acad Sci U S A 98:4119–4124. doi: 10.1073/pnas.051004198. [DOI] [PMC free article] [PubMed] [Google Scholar]
- 59.Gunther T, Grundhoff A. 2010. The epigenetic landscape of latent Kaposi sarcoma-associated herpesvirus genomes. PLoS Pathog 6:e1000935. doi: 10.1371/journal.ppat.1000935. [DOI] [PMC free article] [PubMed] [Google Scholar]
- 60.Lu F, Stedman W, Yousef M, Renne R, Lieberman PM. 2010. Epigenetic regulation of Kaposi's sarcoma-associated herpesvirus latency by virus-encoded microRNAs that target Rta and the cellular Rbl2-DNMT pathway. J Virol 84:2697–2706. doi: 10.1128/JVI.01997-09. [DOI] [PMC free article] [PubMed] [Google Scholar]
- 61.Lu F, Zhou J, Wiedmer A, Madden K, Yuan Y, Lieberman PM. 2003. Chromatin remodeling of the Kaposi's sarcoma-associated herpesvirus ORF50 promoter correlates with reactivation from latency. J Virol 77:11425–11435. doi: 10.1128/JVI.77.21.11425-11435.2003. [DOI] [PMC free article] [PubMed] [Google Scholar]
- 62.Pantry SN, Medveczky PG. 2009. Epigenetic regulation of Kaposi's sarcoma-associated herpesvirus replication. Semin Cancer Biol 19:153–157. doi: 10.1016/j.semcancer.2009.02.010. [DOI] [PMC free article] [PubMed] [Google Scholar]
- 63.Purushothaman P, Uppal T, Verma SC. 2015. Molecular biology of KSHV lytic reactivation. Viruses 7:116–153. doi: 10.3390/v7010116. [DOI] [PMC free article] [PubMed] [Google Scholar]
- 64.Ye F, Zeng Y, Sha J, Jones T, Kuhne K, Wood C, Gao SJ. 2016. High glucose induces reactivation of latent Kaposi's sarcoma-associated herpesvirus. J Virol 90:9654–9663. doi: 10.1128/JVI.01049-16. [DOI] [PMC free article] [PubMed] [Google Scholar]
- 65.Yu X, Shahir AM, Sha J, Feng Z, Eapen B, Nithianantham S, Das B, Karn J, Weinberg A, Bissada NF, Ye F. 2014. Short-chain fatty acids from periodontal pathogens suppress histone deacetylases, EZH2, and SUV39H1 to promote Kaposi's sarcoma-associated herpesvirus replication. J Virol 88:4466–4479. doi: 10.1128/JVI.03326-13. [DOI] [PMC free article] [PubMed] [Google Scholar]
- 66.Duerre JA, Buttz HR, Ackerman JJ. 1992. Effect of methylation inhibitors on gene expression in HL-60 cells. Biochem Cell Biol 70:703–711. doi: 10.1139/o92-107. [DOI] [PubMed] [Google Scholar]
- 67.Sun R, Lin SF, Gradoville L, Yuan Y, Zhu F, Miller G. 1998. A viral gene that activates lytic cycle expression of Kaposi's sarcoma-associated herpesvirus. Proc Natl Acad Sci U S A 95:10866–10871. doi: 10.1073/pnas.95.18.10866. [DOI] [PMC free article] [PubMed] [Google Scholar]
- 68.Yoo SM, Zhou FC, Ye FC, Pan HY, Gao SJ. 2005. Early and sustained expression of latent and host modulating genes in coordinated transcriptional program of KSHV productive primary infection of human primary endothelial cells. Virology 343:47–64. doi: 10.1016/j.virol.2005.08.018. [DOI] [PMC free article] [PubMed] [Google Scholar]
- 69.Ye F, Zhou F, Bedolla RG, Jones T, Lei X, Kang T, Guadalupe M, Gao SJ. 2011. Reactive oxygen species hydrogen peroxide mediates Kaposi's sarcoma-associated herpesvirus reactivation from latency. PLoS Pathog 7:e1002054. doi: 10.1371/journal.ppat.1002054. [DOI] [PMC free article] [PubMed] [Google Scholar]
- 70.Huang Y, Yan J, Li Q, Li J, Gong S, Zhou H, Gan J, Jiang H, Jia GF, Luo C, Yang CG. 2015. Meclofenamic acid selectively inhibits FTO demethylation of m6A over ALKBH5. Nucleic Acids Res 43:373–384. doi: 10.1093/nar/gku1276. [DOI] [PMC free article] [PubMed] [Google Scholar]
- 71.Zhou FC, Zhang YJ, Deng JH, Wang XP, Pan HY, Hettler E, Gao SJ. 2002. Efficient infection by a recombinant Kaposi's sarcoma-associated herpesvirus cloned in a bacterial artificial chromosome: application for genetic analysis. J Virol 76:6185–6196. doi: 10.1128/JVI.76.12.6185-6196.2002. [DOI] [PMC free article] [PubMed] [Google Scholar]
- 72.Zheng ZM. 2003. Split genes and their expression in Kaposi's sarcoma-associated herpesvirus. Rev Med Virol 13:173–184. doi: 10.1002/rmv.387. [DOI] [PMC free article] [PubMed] [Google Scholar]
- 73.Gradoville L, Gerlach J, Grogan E, Shedd D, Nikiforow S, Metroka C, Miller G. 2000. Kaposi's sarcoma-associated herpesvirus open reading frame 50/Rta protein activates the entire viral lytic cycle in the HH-B2 primary effusion lymphoma cell line. J Virol 74:6207–6212. doi: 10.1128/JVI.74.13.6207-6212.2000. [DOI] [PMC free article] [PubMed] [Google Scholar]
- 74.Deng H, Young A, Sun R. 2000. Auto-activation of the rta gene of human herpesvirus-8/Kaposi's sarcoma-associated herpesvirus. J Gen Virol 81:3043–3048. doi: 10.1099/0022-1317-81-12-3043. [DOI] [PubMed] [Google Scholar]
- 75.Sakakibara S, Ueda K, Chen J, Okuno T, Yamanishi K. 2001. Octamer-binding sequence is a key element for the autoregulation of Kaposi's sarcoma-associated herpesvirus ORF50/Lyta gene expression. J Virol 75:6894–6900. doi: 10.1128/JVI.75.15.6894-6900.2001. [DOI] [PMC free article] [PubMed] [Google Scholar]
- 76.Brulois KF, Chang H, Lee AS, Ensser A, Wong LY, Toth Z, Lee SH, Lee HR, Myoung J, Ganem D, Oh TK, Kim JF, Gao SJ, Jung JU. 2012. Construction and manipulation of a new Kaposi's sarcoma-associated herpesvirus bacterial artificial chromosome clone. J Virol 86:9708–9720. doi: 10.1128/JVI.01019-12. [DOI] [PMC free article] [PubMed] [Google Scholar]
- 77.An FQ, Folarin HM, Compitello N, Roth J, Gerson SL, McCrae KR, Fakhari FD, Dittmer DP, Renne R. 2006. Long-term-infected telomerase-immortalized endothelial cells: a model for Kaposi's sarcoma-associated herpesvirus latency in vitro and in vivo. J Virol 80:4833–4846. doi: 10.1128/JVI.80.10.4833-4846.2006. [DOI] [PMC free article] [PubMed] [Google Scholar]