Abstract
Hyperhomocysteinemia (HHcy) is a characteristic metabolic abnormality in several pathological conditions, including hypertension, diabetes and alcoholic liver disease. Emerging evidence indicates that adipose tissue contributes to HHcy and homocysteine (Hcy) conversely affects adipose tissue function. However, the specific effect of Hcyon adipogenesis is poorly understood. In the present study, we investigated the effects and mechanisms of Hcy on adipogenic process using 3T3-L1 preadipocytes, a well-established in vitro model for the study of adipogenesis. Confluent mouse embryo 3T3-L1 preadipocytes (D0) were exposed to differentiation cocktail for three days (D3). Then, cells were transferred to insulin-containing medium and re-fed every two days. Maturation of adipocytes was confirmed by Oil Red O staining of lipid droplets on day 7. Exogenous Hcy was added to the culture medium on either D0 or D3. At day 7, adipogenesis indices were measured. Our data indicated that both Hcy addition protocols suppressed adipogenic process, evidenced by decreased lipid accumulation and downregulated gene expressions of adipocyte protein 2 and peroxisome proliferator-activated receptor gamma (PPAR-gamma), implying that Hcy exerted inhibitory effects on both mitotic clonal expansion (MCE) stage and differentiation stage. Further study showed that Hcy suppresses MCE via decreasing retinoblastoma protein phosphorylation and E2F-1 protein expression. To delineate the critical involvement of PPAR-gamma in Hcy-induced suppression on adipogenesis, we employed rosiglitazone, a specific PPAR-gamma agonist, to replace insulin for the inductive stimulus of adipogenesis. Our results showed that Hcy suppressed rosiglitazone-induced adipogenesis in a similar fashion as this by insulin, suggesting that inhibition of PPAR-gamma transactivation was critically involved in the Hcy-induced inhibitory effect on adipogenesis. Taken together, our data indicate that Hcy suppressed adipogenesis in 3T3-L1 preadipocytes and the inhibition of PPAR-gamma transactivity may, at least partially, contribute to the suppressive effect.
Keywords: homocysteine, adipogenesis, glutathione, PPAR-gamma, MCE
Introduction
Adipose tissue plays a central role in the regulation of energy homeostasis. Excessive energy intake causes adipose tissue expansion, eventually leading to obesity, a major culprit of metabolic syndrome. Adipose tissue expansion is determined by adipocyte hypertrophy, characterized by enlarged cell volume due to excess triglyceride accumulation, and hyperplasia, featured by proliferation and differentiation of preadipocytes into mature adipocytes, a process called adipogenesis. The promotion of adipogenesis leads to the increase in the number of new small adipocytes, which are usually more insulin sensitive. Therefore, in comparison to adipocyte hypertrophy, adipogenesis is relative beneficial in response to energy overconsumption. Adipogenesis is characterized by two temporally distinct processes: (1) proliferation, also called mitotic clonal expansion (MCE), during which preadipocytes replicate and increase in cell number; and (2) differentiation, during which preadipocytes undergo cell-cycle arrest, morphological change and lipid droplet accumulation.1,2 The regulation of the adipogenic process is complex and involves various transcription factors. PPAR-gamma (peroxisome proliferator-activated receptor gamma) plays an essential role in the regulation of the adipogenic process. Knockout of PPAR-gamma gene caused drastic suppression of the process.3 The synthetic ligands for PPAR-gamma have thus been widely used as effective drugs for the treatment of obesity-related metabolic abnormalities, whereas factors/agents which interfere with PPAR-gamma activation will exert detrimental effects on adipose tissue function.
Homocysteine (Hcy) is a sulfur-containing amino acid formed during the metabolism of methionine. Abnormal methionine/Hcy metabolism is associated with a variety of pathological states. The association of altered Hcy metabolism with both coronary and peripheral atherothrombosis has been well-documented.4–8 Hyperhomocysteinemia (HHcy) is considered to be an independent risk factor for cardiovascular disease.4 Higher plasma Hcy concentrations were found in type 2 diabetic patients than in healthy subjects and also, among type 2 diabetic patients, in obese than in non-obese individuals.9 Moreover, increased plasma and liver Hcy concentrations are associated with chronic alcohol exposure in both experimental animals and humans and postulated to play a pathological role in the development of alcoholic liver disease.5,8
The association between Hcy and adipose tissue dysfunction has been reported in several epidemiological investigations.7,10,11 We initially reported that elevated Hcy concentration in adipose tissue contributes to reduced adiponectin production in alcohol-fed mice.8 Moreover, we showed that supplementation of betaine, a Hcy-reducing drug, improved adipose tissue functions in mice challenged with a high-fat diet.12 The study by Li et al.13 demonstrated that dietary Hcy supplementation led to insulin resistance due to upregulation of resistin production from adipocytes. Furthermore, our very recent study found that Hcy exerted antilipolytic function in adipocytes via activating AMPK activity.14 Although the available evidence supports that abnormal Hcy metabolism is associated with malfunction of adipose tissue, the effect of Hcy on the adipogenic process has received very little investigative attention. In the current study, we set out to examine the effect of Hcy on adipogenesis using 3T3-L1 preadipocytes.
Methods and materials
Cell culture and induction of differentiation in 3T3-L1 cells
Mouse embryo fibroblast 3T3-L1 cells were obtained from American Type Culture Collection (Manassas, VA, USA) and grown in Dulbecco’s modified Eagle’s medium (DMEM) containing 10% calf serum and 1% antibiotics (Cellgro, Manassas, VA, USA) until confluence and induced to differentiation. Briefly, two days’ postconfluence (day 0), cells were exposed to differentiation medium containing 0.5 mmol/L isobutylmethylxanthine, 1 μmol/L dexamethasone, 1.67 μmol/L insulin (MDI; Sigma, St Louis, MO, USA) and 10% fetal bovine serum (FBS) for three days. Then, cells were transferred to DMEM with 1.67 μmol/L insulin and 10% FBS and re-fed every two days. Maturation of adipocytes was confirmed by Oil Red O staining of lipid droplets on day 7.
Oil Red O staining
Lipid droplets in mature adipocytes were stained with Oil Red O. Briefly, cells were fixed with 10% formalin and incubated with 60% (wt/wt) filtered Oil Red O (Sigma) in 100% isopropanol for one hour at 60°C. Then, the cells were washed twice with distilled water to remove excess dye and photographed under microscopy.
Measurement of intracellular triglyceride content
To determine the intracellular triglyceride (TG) content, fully differentiated 3T3-L1 adipocytes seeded in 24-well plates were washed twice with phosphate-buffered saline (PBS) and cellular lipids were extracted by 1 mL hexane:isopropanol (3:2) mixture. TG content was measured using a TG assay kit (Infinity, Thermo Electron, Melbourne, Australia). Cells undergoing the same treatment conditions were lysed in RIPA buffer for protein concentration determination and data normalization.
Hoechst staining and cell counting
The fully differentiated 3T3-L1 adipocytes were stained with 1 μL of Hoechst 33342 (5 mg/mL; Sigma) in 1 mL basal medium and incubated for 30 min Stained cells were washed twice with warm PBS (pH 7.4) and imaged under a fluorescent microscope by using 350 nm stimulation and 460 nm emission. For cell counting, the cells were washed with warm PBS and dissociated with PBS solution containing 0.25% trypsin and 100 mg/L ethylenediaminetetraacetic acid by incubation at 37°C for five minutes. The cells were then counted on a hemocytometer.
Determination of intracellular glutathione and glutathione disulfide content
Glutathione (GSH) and glutathione disulfide (GSSG) concentrations in 3T3-L1 preadipocytes were determined using the OxiSelectTM Total Glutathione (GSH/GSSG) Assay kit (Cell Biolabs, San Diego, CA, USA). Briefly, treated 3T3-L1 preadipocytes were deproteinized with 10% metaphosphoric acid, centrifuged and the supernatant was analyzed for GSH and GSSG concentrations using a spectrophotometer at 405 nm over three minutes according to the manufacturer’s instructions. Concentrations were calculated by comparison to GSSG standards and normalized to protein content. The concentrations of GSH and GSSG were expressed as nmol/mg protein.
Quantitative realtime reverse transcription polymerase chain reaction
Total RNA, from either 3T3-L1 adipocytes or adipose tissue, was isolated with a phenol–chloroform extraction. For each sample, 1.0 μg total RNA was reverse transcribed using a high-capacity cDNA reverse transcription kit (Applied Biosystems, Foster City, CA, USA). The cDNA was amplified in MicroAmp Optical 96-well reaction plates with a SYBR Green PCR Master Mix (Applied Biosystems) on an Applied Biosystems Prism 7000 sequence detection system. Relative gene expression was calculated after nomalization by a housekeeping gene (mouse or human 18S rRNA).
Western blotting
Treated 3T3-L1 preadipocytes were lysed in RIPA buffer and isolated proteins were separated by sodium dodecyl sulfate polyacrylamide gel electrophoresis and transferred onto 0.45-μm polyvinylidenedifluoride membranes. After transfer, membranes were blocked in 5% bovine serum albumin in PBS with 0.1% Tween 20 and probed with anti-phospho-retinoblastoma protein (Rb) (Cell Signaling Technology, Danvers, MA, USA) or anti-E2F-1 (FabGennix, Frisco, TX, USA) antibodies. Horseradish peroxidase-conjugated secondary antibodies and an enhanced chemiluminescence substrate kit were used in the detection of specific proteins.
Statistical analysis
All data were expressed as means ± SD. Statistical analysis was performed using a one-way analysis of variance and was analyzed further by Newman–Keuls test for statistical difference. Differences between treatments were considered to be statistically significant at P < 0.05.
Results
Hcy inhibited adipogenesis in 3T3-L1 preadipocytes
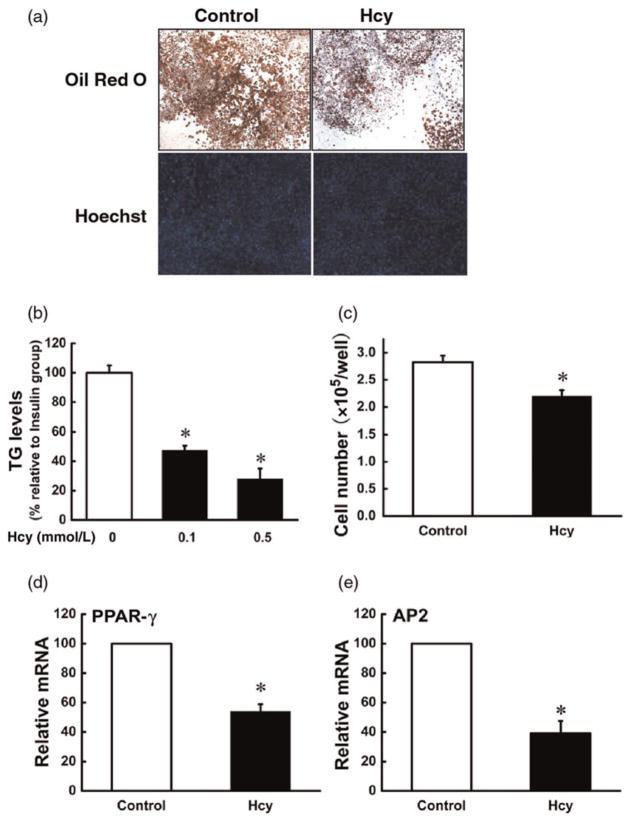
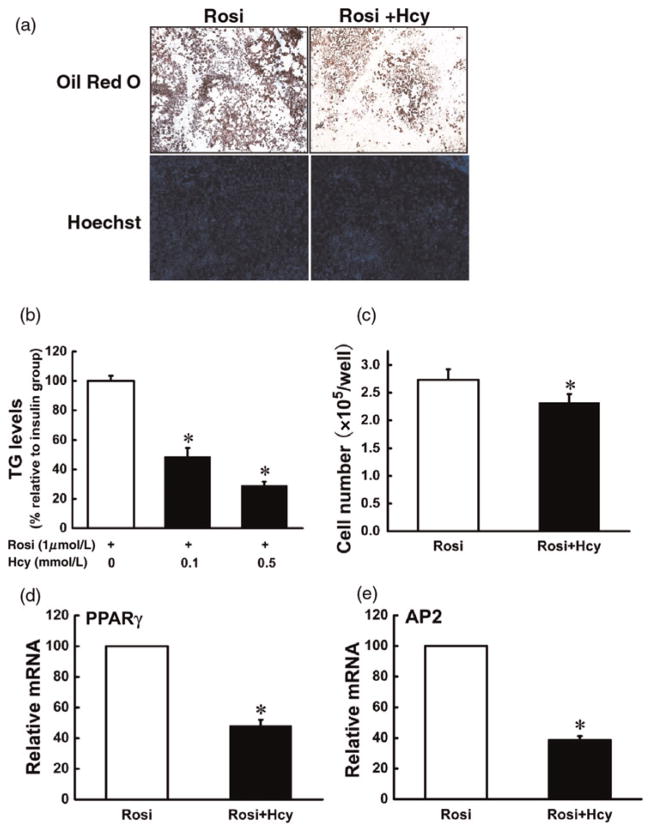
Postconfluent 3T3-L1 preadipocytes were exposed to differentiation medium in the presence or absence of Hcy. Adipocyte formation, lipid accumulation and adipocyte gene expressions were evaluated on day 7. As shown in Figure 1, inclusion of Hcy in the media remarkably inhibited fat accumulation, evidenced by both Oil Red O staining and biochemical measurement of intracellular TG concentrations. The adipocyte cell number was also significantly decreased by Hcy addition. Moreover, Hcy inclusion suppressed the expressions of two critical adipogenic genes: PPAR-gamma and adipocyte protein 2 (AP2).
Figure 1.
Homocysteine (Hcy) inhibited adipogenesis in 3T3-L1 preadipocytes. Two days after plating (D0), 3T3-L1 preadipocytes were exposed to differentiation medium containing isobutylmethylxanthine, dexamethasone and insulin (MDI) for three days (D3). Then, cells were transferred to Dulbecco’s modified Eagle’s medium with insulin and re-fed every two days. Hcy (0, 0.05, 0.1 mmol/L) was added from D0 and refreshed with the medium. Maturation of 3T3-L1 adipocytes was determined by Oil Red O staining and the intracellular triglyceride (TG) assay on day 7. Fully differentiated cells were stained with Hoechest 33342 and counted with a hemocytometer. The total mRNA was isolated to determine the gene expression of peroxisome proliferator-activated receptor gamma (PPAR-gamma) and adipocyte protein 2 (AP2) via realtime reverse transcription polymerase chain reaction. (a, b) Hcy reduced intracellular TG concentrations, and (a, c) Hcy reduced cell number. Furthermore, Hcy inclusion suppressed the gene expressions of PPAR-gamma (d) and AP2 (e). Data are means ± SD (n = 3). *P < 0.05 compared with the MDI-induced Group (Control). (A color version of this figure is available in the online journal)
Hcy inhibited differentiation of 3T3-L1 preadipocytes
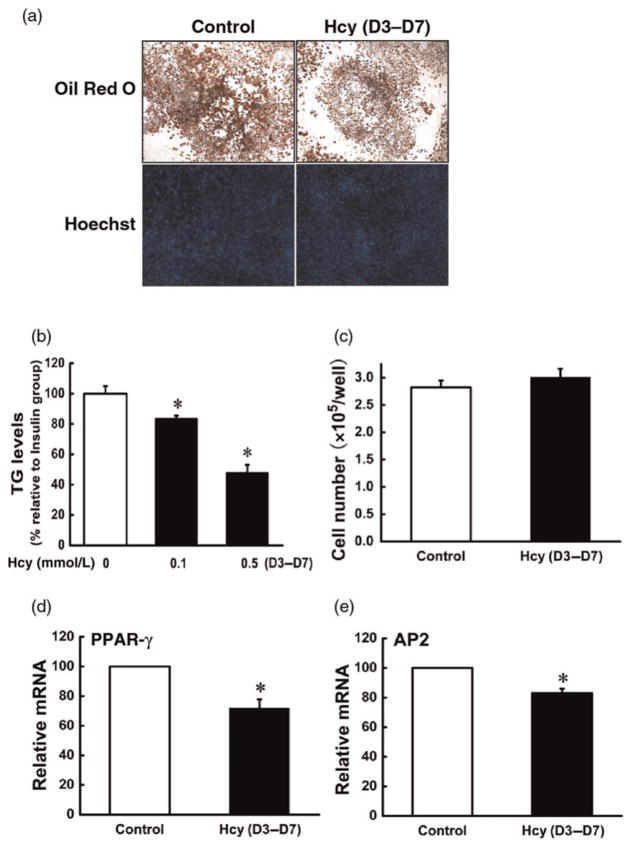
To determine whether Hcy has an effect on terminal adipocyte differentiation, we added Hcy into differentiating cells on day 3, and adipocyte formation, lipid accumulation and adipocyte gene expressions were evaluated on day 7. As shown in Figure 2, Hcy addition at day 3 led to decreased intracellular fat accumulation and the gene expressions of PPAR-gamma and AP2; however, the cell number was not significantly affected by this adding protocol.
Figure 2.
Homocysteine (Hcy) inhibited differentiation of 3T3-L1 preadipocytes. 3T3-L1 preadipocytes were treated as indicated in Figure 1 except that Hcy (0, 0.05, 0.1 mmol/L) was added on D3. (a, b) Hcy reduced intracellular triglyceride (TG) concentrations; (a, c) Hcy addition had no effect on cell number. Exposure to Hcy suppressed the gene expression of peroxisome proliferator-activated receptor gamma (PPAR-gamma; d) and adipocyte protein 2 (AP2; e). Data are means ± SD (n = 3). *P < 0.05 compared with the methylisobutylxanthine-dexamethasone-insulin (MDI)-induced Group (Control). (A color version of this figure is available in the online journal)
Hcy inhibited MCE of 3T3-L1 preadipocytes
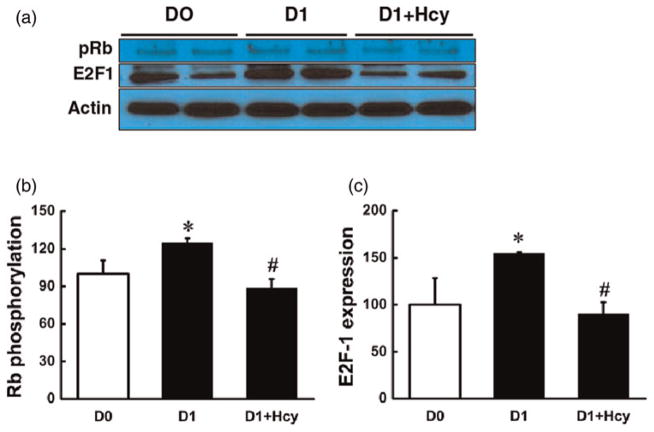
After hormone stimulation, the growth-arrested 3T3-L1 pre-adipocytes synchronously re-enter the cell cycle and undergo two to three cycles of mitosis, also called MCE. MCE is essential for expression of key adipogenic genes, including PPAR-gamma, and for terminal differentiation in 3T3-L1 cells. The phosphorylation of Rb protein plays a central role in controlling MCE, during which Rb undergoes phosphorylation, leading to the release of transcription factors E2F-1 to promote adipogenic gene expression. Although Hcy addition to the media on both day 0 and day 3 resulted in a suppressed adipogenic process, our data revealed that the addition on day 0 led to more potent suppression, indicating that Hcy may inhibit MCE. Thus, we examined the effect of Hcy on MCE by measuring Rb phosphorylation and E2F-1 protein abundance. As shown in Figure 3, exposure to Hcy (0.1 mmol/L) for 24 h abolished hormone-stimulated Rb phosphorylation and E2F-1 increase in 3T3-L1 preadipocytes.
Figure 3.
Homocysteine (Hcy) decreased retinoblastoma protein (Rb) phosphorylation and E2F-1 protein expression. Two days after plating (D0), 3T3-L1 cells were treated with Hcy (0.1 mmol/L) in the differentiation medium for 24 h and the protein was isolated for Western blotting to determine the expression of E2F-1 and the phosphorylation of Rb. Hcy addition (0.1 mmol/L) significantly decreased Rb phosphorylation (a, c) and E2F-1 protein expression (a, b). Data are means ± SD (n = 3). *P < 0.05 compared with the 3T3-L1 cells on D0. #P < 0.05 compared with methylisobutylxanthine-dexamethasone-insulin (MDI)-induced 3T3-L1 cells for one day (D1). (A color version of this figure is available in the online journal)
Hcy-induced MCE suppression is independent of oxidative stress in 3T3-L1 preadipocytes
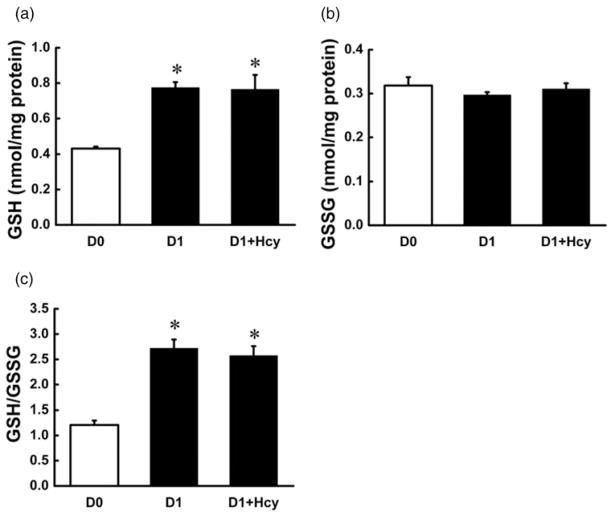
Emerging evidence suggests that oxidative stress, specifically intracellular GSH status, can modulate MCE process.15,16 Thus, we examined the effects of Hcy addition on intracellular GSH concentrations. As shown in Figure 4, intracellular GSH concentrations, as well as the ratio of GSH/GSSG, were remarkably increased during the first day after hormone stimulation. However, the increases were not affected by Hcy addition.
Figure 4.
Homocysteine (Hcy) had no effect on intracellular glutathione (GSH) concentrations in early stage of 3T3-L1 preadipocyte adipogenesis. Two days after plating (D0), 3T3-L1 cells were treated with Hcy (0.1 mmol/L) in the differentiation medium for 24 h and the adherent cells were collected and deproteinized with 10% metaphosphoric acid to determine the intracellular GSH and glutathione disulfide (GSSG) concentration. Hormone stimulation for 24 h elevated intracellular GSH concentrations and GSH/GSSG ratio in 3T3-L1 preadipocytes (a, c); however, intracellular GSSG concentrations were not affected (b). Hcy addition did not change the elevation of hormone-induced increase in intracellular GSH status. Data are means ± SD (n = 3). *P < 0.05 compared with the 3T3-L1 cells on D0
Hcy suppressed rosiglitazone-induced adipogenesis in 3T3-L1 preadipocytes
PPAR-gamma is a predominant transcription factor driving the adipogenic process. Our data showed that Hcy addition to the media suppressed gene expression of PPAR-gamma. To test if PPAR-gamma inhibition is critically involved in Hcy-induced suppression in adipogenesis, we replaced insulin with rosiglitazone, a potent PPAR-gamma agonist, to induce adipogenesis in 3T3-L1 preadipocytes. Hcy was added to the media on day 0, and adipocyte formation, lipid accumulation and adipogenic gene expressions were evaluated on day 7. As shown in Figure 5, rosiglitazone successfully induced 3T3-L1 preadipocytes into mature adipocytes on day 7. Similar to the observations with insulin, rosiglitazone-induced adipogenesis was significantly suppressed by Hcy inclusion in the media.
Figure 5.
Homocysteine (Hcy) suppressed rosiglitazone-induced adipogenesis in 3T3-L1 preadipocytes. Two days after plating (D0), 3T3-L1 preadipocytes were exposed to differentiation medium containing isobutylmethylxanthine, dexamethasone and rosiglitazone (MDR) for three days (D3). Then, cells were transferred to Dulbecco’s modified Eagle’s medium with rosiglitazone and re-fed every two days. Hcy (0, 0.05, 0.1 mmol/L) were added from D0 and refreshed with the medium. Mutation of 3T3-L1 adipocytes was determined by Oil Red O staining and the intracellular triglyceride (TG) assay on day 7. Fully differentiated cells were stained with Hoechest 33342 and counted with a hemocytometer. The total mRNA was isolated to determine the gene expression of peroxisome proliferator-activated receptor gamma (PPAR-gamma) and adipocyte protein 2 (AP2) via realtime reverse transcription polymerase chain reaction. (a, b) Hcy reduced intracellular TG concentrations; (a, c) Hcy reduced cell number. Gene expressions of both PPAR-gamma (d) and AP2 (e) were suppressed. Data are means ± SD (n = 3). *P < 0.05 compared with the MDR-induced Group (Rosi). Rosi, rosiglitazone. (A color version of this figure is available in the online journal)
Hcy inhibited rosiglitazone-induced differentiation of 3T3-L1 preadipocytes
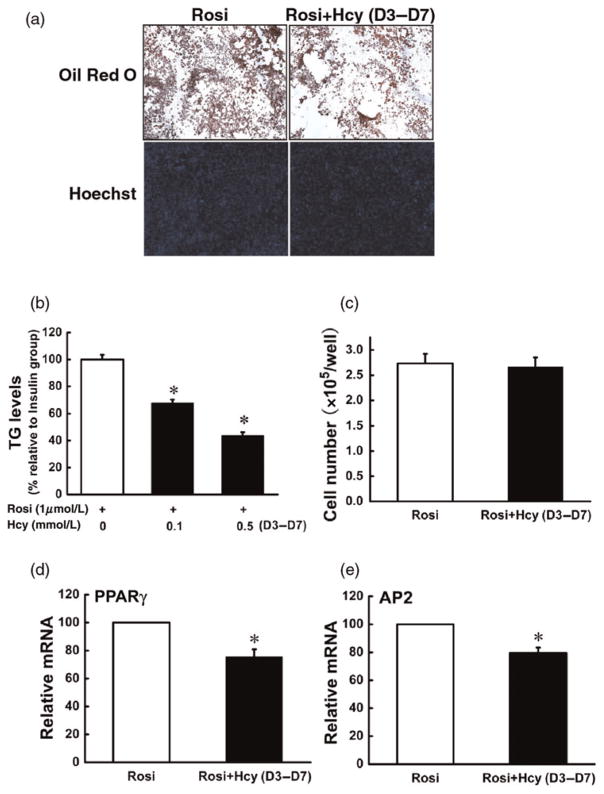
To determine whether Hcy has an effect on terminal adipocyte differentiation induced by rosiglitazone, we added Hcy into differentiating cells on day 3, and examined adipocyte formation, lipid accumulation and adipocyte gene expressions on day 7. As shown in Figure 6, Hcy addition at day 3 led to decreased intracellular fat accumulation and the gene expressions of PPAR-gamma and AP2; however, the cell number was not significantly affected.
Figure 6.
Homocysteine (Hcy) inhibited rosiglitazone-induced differentiation of 3T3-L1 preadipocytes. 3T3-L1 preadipocytes were treated as indicated in Figure 5 except that Hcy (0, 0.05, 0.1 mmol/L) was added on D3. Hcy addition inhibited rosiglitazone-induced fat accumulation (a, b). However, with this protocol, the cell number was not affected by Hcy addition (a, c). Gene expressions of both peroxisome proliferator-activated receptor gamma (d) and adipocyte protein 2 (e) were inhibited. Data are means ± SD (n = 3). *P < 0.05 compared with the methylisobutylxanthine-dexamethasone-rosiglitazone (MDR)-induced Group (Rosi). Rosi, rosiglitazone. (A color version of this figure is available in the online journal)
Discussion
Adipose tissue plays a central role in the regulation of energy homeostasis, storing excess energy in the form of triglycerides and releasing free fatty acids in response to energy requirement such as fasting. In healthy individuals, excess fat is mainly stored in adipocytes. In response to energy overconsumption, the expansion of adipose tissue mass ensues to accommodate excess lipid so as to avoid ectopic lipid accumulation and lipotoxicity in other non-adipose tissues, such as muscle, liver and pancreas. In this sense, the maintenance of the normal adipogenic process is critical in controlling energy distribution. Hcy is a metabolite of methionine metabolism. HHcy is a pathological condition characterized by an increase in plasma concentration of total Hcy. Numerous clinical and epidemiological studies have indicated that HHcy is an independent risk factor for atherothrombotic disease.17,18 Clinically, up to 40% of patients diagnosed with premature coronary artery disease, peripheral vascular disease or recurrent venous thrombosis, present with HHcy.17 Experimental studies demonstrated that Hcy causes endothelial cell dysfunction and induces apoptotic cell death in cell types relevant to atherothrombotic disease, including endothelial cells, smooth muscle cells and hepatocytes.19 Although the liver is the major organ for methionine metabolism and a main contributor to the plasma Hcy pool, the recent evidence supports that adipose tissue represents another major source for the generation of Hcy via nicotinamide N-methyltransferase-regulated reactions, whose expression is upregulated during adipogenesis.20 Given the critical role of adipose tissue in the development of various metabolic disorders, it is of great interest to examine the effects of Hcy on adipocyte function. In this study, we demonstrated for the first time that the Hcy-induced inhibitory effect on adipogenesis in 3T3-L1 preadipocytes involved inhibitions of both MCE and differentiation of 3T3-L1 preadipocytes. Our data further demonstrated that the interference with PPAR-gamma transactivation may, at least partly, contribute to the inhibitory effect of Hcy on adipogenesis.
Adipogenesis can be temporally separated into two stages: MCE (the first two days after hormonal stimulation) and differentiation. To dissect the effects of Hcy on adipogenic process, we conducted experiments by starting Hcy treatments on either day 0 or day 3, the time point when MCE was already complete. Our results demonstrated that, although both protocols led to adipogenesis inhibition, the inhibitory effect was less potent when Hcy was added on day 3, suggesting that Hcy exerted inhibitory effects on both stages. MCE is critical and necessary for the differentiation of 3T3-L1 preadipocytes into mature adipocytes.21 At the growth-arrested stage of G0, hypophosphorylated Rb binds to transcription factor E2F-1, thereby preventing access to their transcriptional target genes.22 During MCE, Rb phosphorylation causes it to release E2F-1, allowing upregulation of their target genes that drive the adipogenic program to the completion.23,24 In our study, Hcy-induced decrease in 3T3-L1 cell proliferation during the initial stage (D0–D3) was associated with attenuated Rb phosphorylation and E2F-1 expression in the first day of hormone stimulation. These data suggest that the mechanism by which Hcy inhibited MCE in 3T3-L1 cells involved inhibition of cell cycle progression at the G1 → S phase transition. This result is consistent with the observation in human umbilical vein endothelial cells, which showed that Hcy inhibited the expression of cyclin A, an upstream protein for Rb phosphorylation, in endothelial cells in a dose- and time-dependent manner.25 The detailed mechanisms responsible for the suppressive effect of Hcy on Rb phosphorylation in 3T3-L1 preadipocytes remain elusive. However, considering the well-established endoplasmic reticulum (ER) stress-inducing property of Hcy in a variety of cell types26,27 and a previous report that ER stress could directly cause cell cycle arrest in the G1 phase by a global inhibition of protein synthesis,28 it is rational to postulate that Hcy may suppress adipogenesis via inducing ER stress in preadipocytes. Indeed, Hcy-induced ER stress in both fully differentiated 3T3-L1 and primary mouse adipocytes were already observed in our laboratory (unpublished data). Therefore, future studies are warranted to elucidate if ER stress and/or the cyclin A/CDK/Rb pathway are also critically involved in Hcy-induced adipogenesis inhibition in 3T3-L1 preadipocytes.
Emerging evidence suggests that oxidative stress in adipose tissue plays a critical role in the regulation of adipogenic process. For example, it has been reported that aging-related increase in oxidative stress in adipose tissue inhibits adipogenesis via reducing cell proliferation during the initial MCE.15 It has been suggested that the deleterious effects of Hcy was, at least partially, mediated by the induction of oxidative stress and could be prevented by increasing antioxidant system function.29,30 To test if the observed anti-adipogenic effect of Hcy in our study is due to increased oxidative stress, we measured intracellular GSH and GSSG concentrations. Consistent with a previous report, both intracellular GSH concentration and the ratio of GSH/GSSG were remarkably increased during the first day of 3T3-L1 preadipocyte adipogenesis;16 however, Hcy addition had no effect on these increases, suggesting that Hcy-induced inhibition on MCE in adipogenesis is independent of oxidative stress.
PPAR-gamma is expressed at the highest levels in adipose tissue, where it regulates numerous genes and improves insulin sensitivity, increases fatty acid uptake, and decreases lipolysis.31 PPAR-gamma is also a master regulator and adipogenic indicator for adipogenesis. PPAR-gamma knockout mice fail to generate adipose tissue when fed a high-fat diet.3 In the differentiation of 3T3-L1 preadipocytes, PPAR-gamma is quickly induced after induction of differentiation.1,2 The inter-regulation between Hcy and PPAR-gamma agonist has been reported in different cell types. For example, it was reported that Hcy competes with the PPAR-gamma agonist for binding to PPAR-gamma, thereby suppressing its transactivity in primarily isolated microvessel endocardial endothelial cells.32 Conversely, the PPAR-gamma agonist reduces renal Hcy concentrations and ameliorates Hcy-induced deleterious vascular effects in diabetes.33,34 In our study, both Hcy adding protocols (D0 and D3) suppressed gene expressions of PPAR-gamma and its downstream target AP2 in 3T3-L1 preadipocytes, implying that suppression of PPAR-gamma transactivation may critically be involved in the suppressive effect of Hcy on adipogenesis. To test this hypothesis, we employed rosiglita-zone, a potent selective agonist for PPAR-gamma, to replace insulin as an adipogenesis inducer. As expected, rosiglitazone induced adipogenesis. Similar to these in insulin-stimulated experiments, Hcy inhibited adipogenic responses at both MCE and differentiation stages. Insulin signaling helps to regulate adipogenesis and PPAR-gamma transactivation is a downstream event of insulin signal cascade.35 Although the deleterious effect of Hcy on insulin signaling pathway has been reported in several cell types, including adipocytes,13 the results obtained in this study suggest that Hcy suppresses adipogenesis mainly through inhibiting PPAR-gamma transactivation.
In summary, the present study demonstrated that elevated Hcy concentrations were associated with an inhibited adipogenic process. Mechanistic investigations revealed that Hcy exposure prevented both MCE and late-stage differentiation. Inhibition of PPAR-gamma transactivation is critically involved in Hcy-induced adipogenesis suppression.
Acknowledgments
We thank Dr Alan Diamond from the Department of Pathology for his technical support and scientific advice.
This work was supported by the National Institutes of Health grants K01 AA015344 and R01 AA017442 (ZS).
Footnotes
Author contributions: All authors participated in the design, interpretation of the studies and analysis of the data and review of the manuscript. ZW, XD and TY participated in the acquisition and analysis of the data and drafting the manuscript. ZS participated in study design, analysis and interpretation of the data, and editing the manuscript.
References
- 1.Ntambi JM, Young-Cheul K. Adipocyte differentiation and gene expression. J Nutr. 2000;130:3122S–6S. doi: 10.1093/jn/130.12.3122S. [DOI] [PubMed] [Google Scholar]
- 2.Gregoire FM, Smas CM, Sul HS. Understanding adipocyte differentiation. Physiol Rev. 1998;78:783–809. doi: 10.1152/physrev.1998.78.3.783. [DOI] [PubMed] [Google Scholar]
- 3.Jones JR, Barrick C, Kim KA, Lindner J, Blondeau B, Fujimoto Y, Shiota M, Kesterson RA, Kahn BB, Magnuson MA. Deletion of PPAR gamma in adipose tissues of mice protects against high fat diet-induced obesity and insulin resistance. Proc Natl Acad Sci USA. 2005;102:6207–12. doi: 10.1073/pnas.0306743102. [DOI] [PMC free article] [PubMed] [Google Scholar]
- 4.Clarke R, Daly L, Robinson K, Naughten E, Cahalane S, Fowler B, Graham I. Hyperhomocysteinemia: an independent risk factor for vascular disease. N Engl J Med. 1991;324:1149–55. doi: 10.1056/NEJM199104253241701. [DOI] [PubMed] [Google Scholar]
- 5.Medici V, Peerson JM, Stabler SP, French SW, Gregory JF, Virata MC, Albanese A, Bowlus CL, Devaraj S, Panacek EA, Rahim N, Richards JR, Rossaro L, Halsted CH. Impaired homocysteine transsulfuration is an indicator of alcoholic liver disease. J Hepatol. 2010;53:551–7. doi: 10.1016/j.jhep.2010.03.029. [DOI] [PMC free article] [PubMed] [Google Scholar]
- 6.Sen U, Tyagi SC. Homocysteine and hypertension in diabetes: does PPAR gamma have a regulatory role? PPAR Res. 2010;2010:806538. doi: 10.1155/2010/806538. [DOI] [PMC free article] [PubMed] [Google Scholar]
- 7.Meigs JB, Jacques PF, Selhub J, Singer DE, Nathan DM, Rifai N, D’Agostino RB, Sr, Wilson PW. Fasting plasma homocysteine levels in the insulin resistance syndrome: the Framingham offspring study. Diabetes Care. 2001;24:1403–10. doi: 10.2337/diacare.24.8.1403. [DOI] [PubMed] [Google Scholar]
- 8.Song Z, Zhou Z, Deaciuc I, Chen T, McClain CJ. Inhibition of adiponectin production by homocysteine: a potential mechanism for alcoholic liver disease. Hepatology. 2008;47:867–79. doi: 10.1002/hep.22074. [DOI] [PubMed] [Google Scholar]
- 9.Audelin MC, Genest J., Jr Homocysteine and cardiovascular disease in diabetes mellitus. Atherosclerosis. 2001;159:497–511. doi: 10.1016/s0021-9150(01)00531-7. [DOI] [PubMed] [Google Scholar]
- 10.Fonseca VA, Fink LM, Kern PA. Insulin sensitivity and plasma homocysteine concentrations in non-diabetic obese and normal weight subjects. Atherosclerosis. 2003;167:105–9. doi: 10.1016/s0021-9150(02)00386-6. [DOI] [PubMed] [Google Scholar]
- 11.Oron-Herman M, Rosenthal T, Sela BA. Hyperhomocysteinemia as a component of syndrome X. Metabolism. 2003;52:1491–5. doi: 10.1016/s0026-0495(03)00262-2. [DOI] [PubMed] [Google Scholar]
- 12.Wang Z, Yao T, Pini M, Zhou Z, Fantuzzi G, Song Z. Betaine improved adipose tissue function in mice fed a high-fat diet: a mechanism for hepatoprotective effect of betaine in nonalcoholic fatty liver disease. Am J Physiol Gastrointest Liver Physiol. 2010;298:G634–42. doi: 10.1152/ajpgi.00249.2009. [DOI] [PMC free article] [PubMed] [Google Scholar]
- 13.Li Y, Jiang C, Xu G, Wang N, Zhu Y, Tang C, Wang X. Homocysteine upregulates resistin production from adipocytes in vivo and in vitro. Diabetes. 2008;57:817–27. doi: 10.2337/db07-0617. [DOI] [PubMed] [Google Scholar]
- 14.Wang Z, Pini M, Yao T, Zhou Z, Sun C, Fantuzzi G, Song Z. Homocysteine suppresses lipolysis in adipocytes by activating the AMPK pathway. Am J Physiol Endocrinol Metab. 2011;301:E703–12. doi: 10.1152/ajpendo.00050.2011. [DOI] [PMC free article] [PubMed] [Google Scholar]
- 15.Findeisen HM, Pearson KJ, Gizard F, Zhao Y, Qing H, Jones KL, Cohn D, Heywood EB, de Cabo R, Bruemmer D. Oxidative stress accumulates in adipose tissue during aging and inhibits adipogenesis. PLoS One. 2011;6:e18532. doi: 10.1371/journal.pone.0018532. [DOI] [PMC free article] [PubMed] [Google Scholar]
- 16.Vigilanza P, Aquilano K, Baldelli S, Rotilio G, Ciriolo MR. Modulation of intracellular glutathione affects adipogenesis in 3T3-L1 cells. J Cell Physiol. 2011;226:2016–24. doi: 10.1002/jcp.22542. [DOI] [PubMed] [Google Scholar]
- 17.de Jong SC, Stehouwer CD, van den Berg M, Kostense PJ, Alders D, Jakobs C, Pals G, Rauwerda JA. Determinants of fasting and post-methionine homocysteine levels in families predisposed to hyperhomocysteinemia and premature vascular disease. Arterioscler Thromb Vasc Biol. 1999;19:1316–24. doi: 10.1161/01.atv.19.5.1316. [DOI] [PubMed] [Google Scholar]
- 18.de Jong SC, van den Berg M, Rauwerda JA, Stehouwer CD. Hyperhomocysteinemia and atherothrombotic disease. Semin Thromb Hemost. 1998;24:381–5. doi: 10.1055/s-2007-996026. [DOI] [PubMed] [Google Scholar]
- 19.Austin RC, Lentz SR, Werstuck GH. Role of hyperhomocysteinemia in endothelial dysfunction and atherothrombotic disease. Cell Death Differ. 2004;11(Suppl 1):S56–64. doi: 10.1038/sj.cdd.4401451. [DOI] [PubMed] [Google Scholar]
- 20.Riederer M, Erwa W, Zimmermann R, Frank S, Zechner R. Adipose tissue as a source of nicotinamide N-methyltransferase and homocysteine. Atherosclerosis. 2009;204:412–7. doi: 10.1016/j.atherosclerosis.2008.09.015. [DOI] [PubMed] [Google Scholar]
- 21.Tang QQ, Otto TC, Lane MD. Mitotic clonal expansion: a synchronous process required for adipogenesis. Proc Natl Acad Sci USA. 2003;100:44–9. doi: 10.1073/pnas.0137044100. [DOI] [PMC free article] [PubMed] [Google Scholar]
- 22.Harbour JW, Dean DC. Rb function in cell-cycle regulation and apoptosis. Nat Cell Biol. 2000;2:E65–7. doi: 10.1038/35008695. [DOI] [PubMed] [Google Scholar]
- 23.Cole KA, Harmon AW, Harp JB, Patel YM. Rb regulates C/EBPbeta-DNA-binding activity during 3T3-L1 adipogenesis. Am J Physiol Cell Physiol. 2004;286:C349–54. doi: 10.1152/ajpcell.00255.2003. [DOI] [PubMed] [Google Scholar]
- 24.Fajas L, Landsberg RL, Huss-Garcia Y, Sardet C, Lees JA, Auwerx J. E2Fs regulate adipocyte differentiation. Dev Cell. 2002;3:39–49. doi: 10.1016/s1534-5807(02)00190-9. [DOI] [PubMed] [Google Scholar]
- 25.Wang H, Jiang X, Yang F, Chapman GB, Durante W, Sibinga NE, Schafer AI. Cyclin A transcriptional suppression is the major mechanism mediating homocysteine-induced endothelial cell growth inhibition. Blood. 2002;99:939–45. [PMC free article] [PubMed] [Google Scholar]
- 26.Dickhout JG, Sood SK, Austin RC. Role of endoplasmic reticulum calcium disequilibria in the mechanism of homocysteine-induced ERstress. Antioxid Redox Signal. 2007;9:1863–73. doi: 10.1089/ars.2007.1780. [DOI] [PubMed] [Google Scholar]
- 27.Ji C, Deng Q, Kaplowitz N. Role of TNF-alpha in ethanol-induced hyperhomocysteinemia and murine alcoholic liver injury. Hepatology. 2004;40:442–51. doi: 10.1002/hep.20309. [DOI] [PubMed] [Google Scholar]
- 28.Outinen PA, Sood SK, Pfeifer SI, Pamidi S, Podor TJ, Li J, Weitz JI, Austin RC. Homocysteine-induced endoplasmic reticulum stress and growth arrest leads to specific changes in gene expression in human vascular endothelial cells. Blood. 1999;94:959–67. [PubMed] [Google Scholar]
- 29.Eberhardt RT, Forgione MA, Cap A, Leopold JA, Rudd MA, Trolliet M, Heydrick S, Stark R, Klings ES, Moldovon NI, Yaghoubi M, Goldschmidt-Clermont PJ, Farber HW, Cohen R, Loscalzo J. Endothelial dysfunction in a murine model of mild hyperhomocysteinemia. J Clin Invest. 2000;106:483–91. doi: 10.1172/JCI8342. [DOI] [PMC free article] [PubMed] [Google Scholar]
- 30.Starkebaum G, Harlan JM. Endothelial cell injury due to copper-catalyzed hydrogen peroxide generation from homocysteine. J Clin Invest. 1986;77:1370–76. doi: 10.1172/JCI112442. [DOI] [PMC free article] [PubMed] [Google Scholar]
- 31.Mishra PK, Tyagi N, Sen U, Joshua IG, Tyagi SC. Synergism in hyperhomocysteinemia and diabetes: role of PPAR gamma and tempol. Cardiovasc Diabetol. 2010;9:49. doi: 10.1186/1475-2840-9-49. [DOI] [PMC free article] [PubMed] [Google Scholar]
- 32.Hunt MJ, Tyagi SC. Peroxisome proliferators compete and ameliorate Hcy-mediated endocardial endothelial cell activation. Am J Physiol Cell Physiol. 2002;283:C1073–9. doi: 10.1152/ajpcell.00152.2002. [DOI] [PubMed] [Google Scholar]
- 33.Rodriguez WE, Sen U, Tyagi N, Kumar M, Carneal G, Aggrawal D, Newsome J, Tyagi SC. PPAR gamma agonist normalizes glomerular filtration rate, tissue levels of homocysteine, and attenuates endothelial-myocyte uncoupling in alloxan induced diabetic mice. Int J Biol Sci. 2008;4:236–44. doi: 10.7150/ijbs.4.236. [DOI] [PMC free article] [PubMed] [Google Scholar]
- 34.Sen U, Rodriguez WE, Tyagi N, Kumar M, Kundu S, Tyagi SC. Ciglitazone, a PPAR gamma agonist, ameliorates diabetic nephropathy in part through homocysteine clearance. Am J Physiol Endocrinol Metab. 2008;295:E1205–12. doi: 10.1152/ajpendo.90534.2008. [DOI] [PMC free article] [PubMed] [Google Scholar]
- 35.Nakae J, Kitamura T, Kitamura Y, Biggs WH, III, Arden KC, Accili D. The forkhead transcription factor Foxo1 regulates adipocyte differentiation. Dev Cell. 2003;4:119–29. doi: 10.1016/s1534-5807(02)00401-x. [DOI] [PubMed] [Google Scholar]


