

Abstract
Background
Understanding brain function requires knowledge of how one brain region causally influences another. This information is difficult to obtain directly in the human brain, and is instead typically inferred from resting-state fMRI.
New method
Here, we demonstrate the safety and scientific promise of a novel and complementary approach: concurrent electrical stimulation and fMRI (es-fMRI) at 3 Tesla in awake neurosurgical patients with implanted depth electrodes.
Results
We document the results of safety testing, actual experimental setup, and stimulation parameters, that safely and reliably evoke activation in distal structures through stimulation of amygdala, cingulate, or prefrontal cortex. We compare connectivity inferred from the evoked patterns of activation with that estimated from standard resting-state fMRI in the same patients: while connectivity patterns obtained with each approach are correlated, each method produces unique results. Response patterns were stable over the course of 11 minutes of es-fMRI runs.
Comparison with existing method
es-fMRI in awake humans yields unique information about effective connectivity, complementing resting-state fMRI. Although our stimulations were below the level of inducing any apparent behavioral or perceptual effects, a next step would be to use es-fMRI to modulate task performances. This would reveal the acute network-level changes induced by the stimulation that mediate the behavioral and cognitive effects seen with brain stimulation.
Conclusions
es-fMRI provides a novel and safe approach for mapping effective connectivity in the human brain in a clinical setting, and will inform treatments for psychiatric and neurodegenerative disorders that use deep brain stimulation.
Keywords: effective connectivity, human, electrical stimulation, functional MRI, DBS, amygdala
1, Introduction
Large-scale brain connectivity is a key aspect of brain function, providing important insights into cognition and behavior, in both health and disease. Large databases such as those from the Human Connectome Project are providing detailed maps of structural and functional connectivity in the human brain (Van Essen and Barch, 2015). Structural connectivity is estimated from diffusion-weighted MRI, but is limited to relatively macroscopic white matter connections, has fundamental limitations in resolution (Thomas et al., 2014), and of course ignores function. The distributed functional networks of the human brain, typically obtained from resting-state-fMRI, show reliable large-scale organization that is thought to subserve aspects of emotion, attention, and cognition (Andrews-Hanna et al., 2010; Buckner et al., 2008; Simmons and Martin, 2012; Yeo et al., 2011), and that are altered in many psychiatric and neurodegenerative diseases (Fox et al., 2014; Greicius, 2008; Greicius and Kimmel, 2012; Greicius et al., 2004; Zhang and Raichle, 2010). Such functional networks reveal a complex structure, often featuring anatomical hubs that can serve to organize communication within the network (van den Heuvel and Sporns, 2013), showing dynamic shifts over time (Allen et al., 2014), and opening the possibility of finding functional variations that correlate with individual differences, including psychopathology (Smith et al., 2013).
Functional brain connectivity is typically estimated from fMRI data in two ways (Friston, 2011). By far the most common depends on covariance in resting-state fluctuations of BOLD time series that are not induced by an experimental stimulus (Biswal et al., 2010). This type of functional connectivity analysis (resting-state fMRI connectivity) has revealed reliable large-scale brain networks, but cannot distinguish true causal coupling from common drivers. For instance, disparate brain regions may be correlated due to interaction with the external environment, as well as somatic signals such as respiration or heart rate. Another source of network-level correlation may arise from complex large-scale dynamics that are not well reflected in direct anatomical connections (Honey et al., 2009). Effective connectivity, by contrast, does aim to estimate actual causal relationships. One way of approaching such an estimation is by temporal precedence. Granger causality capitalizes on this feature, but unfortunately it is insufficient to establish true causality, since temporal precedence is still possible with more complex common drivers. Dynamic causal modeling (Daunizeau et al., 2011; Penny, 2012) does yield evidence for causal models but depends on specifying models in the first place, requires task-driven fMRI to manipulate activation at nodes in those models, does not scale well to large-scale connectivity, and rests on a number of assumptions.
Unambiguous isolation of the causal influence that one region has on another can be achieved by applying focal external perturbation (such as direct electrical stimulation) at a specific node (or multiple nodes) while concurrently recording responses from rest of the brain. Clinically, electrical stimulation has been successfully used to treat movement disorders, and has more recently been applied also to treat psychiatric disorders, such as depression. However, the mediating effects of such stimulation on the rest of the brain are at present poorly understood, making the rational development of such interventions challenging. Combining these clinical applications of deep-brain stimulation with the wide field-of-view of fMRI would yield important new information on the acute effects that local brain stimulation has on the rest of the brain.
Application of concurrent electrical stimulation and BOLD fMRI (es-fMRI) in humans requires a unique setting and careful safety testing. In this paper, we report on the safety, feasibility, experimental setup and scientific promise of es-fMRI as applied in a series of epilepsy patients with depth electrodes.
2. Materials and Methods
2.1. Safety testing with a gel phantom
Our approach poses poorly understood risks to research participants. We therefore first characterized in detail the safety of concurrent electrical stimulation and fMRI, which allowed us to converge on a range of physiologically feasible parameters to use in our research protocol. Safety concerns derive from three effects: (1) induction of currents in the electrode from time-varying magnetic field gradients produced by the scanner; (2) heating of the electrodes due to RF energy deposition from the RF transmit head coil or whole-body coil; (3) mechanical forces causing movement of the electrode in the magnetic field. All safety studies were conducted in a Siemens Trio 3T scanner, using a range of pulse sequences and both head- and whole-body transmit coils.
2.1.1. MRI tissue phantom
We used a commercially available spherical phantom (Phantom Laboratory, Salem, NY, USA, 20cm inner diameter) filled with PAA (Polyacrylic acid) saline-gel. PAA-gel filled phantoms are fabricated as described in ASTM (American Society for Testing and Materials) standards section F2182 (Committee F04 on Medical and Surgical Materials and Devices, 2011). This gel has similar physical, thermal and electrical properties as human brain tissue and is used routinely by research groups to study safety issues related to MRI scanning (Carmichael et al., 2007; Luca et al., 1987). Electrodes were placed on the phantom surface and within the gel substance of the phantom in a wide range of geometric orientations.
2.1.2. Intracranial electrodes
The electrodes tested consisted of subdural surface strip and grid electrodes and penetrating depth electrodes (fine wire or cylindrical macro-contacts positioned along the shaft of a linear array placed in the brain; Ad-Tech (Racine, WI, USA). Contacts were a platinum-iridium alloy (Pt-Ir, 80 % Platinum and 20 % Iridium) and leads were made of a 44 gauge nickel-chromium alloy. Depth electrodes had 14 micro-wire contacts (0.0015 inches = 38 micron in diameter) and 6 macro-cylindrical contacts (diameter 1.3 mm and length 1.57 mm); we stimulated only through the macro contacts. Grid and strip electrodes had flat disc-shaped 4 mm diameter Pt-Ir contacts embedded within a silicone backing with 2.3 mm diameter exposed surfaces. Surface areas of the contacts are 0.0641 cm2 and 0.0416 cm2 for depth and surface contacts, respectively, necessitating the current amplitudes we report here in order to achieve a sufficient charge density per phase to produce reliable BOLD-fMRI responses. Inter-contact distances for the strip and grid electrodes were either 5 or 10 mm. The connector pins were fabricated from hard brass 360 with 30 micro-inch plating (99 % gold and 1 % nickel). Typical inter-contact impedance at 100 Hz in the human brain was 1–5 kΩ.
2.1.3. Temperature Sensors
Fiber-optic fluorescent temperature sensors (FTX-300 optic signal conditioner and PRBMR1 optical fiber probes, OSENSA innovations, BC, Canada) were used to measure local temperature changes during MRI test sessions. Temperature measurements were obtained from 3 sensors simultaneously at a 2 Hz sampling rate, and computer recorded with accompanying time stamps. The temperature sensing probes were mechanically attached to maintain direct physical contact with the metallic electrode contacts, perpendicular to the electrode contact being studied, as consistent with the manufacturer’s recommendation. The sensor cables were secured to the electrode by using medical tape and collodion. We placed the sensors at the first macro-contact from the tip of the depth electrodes. For the grid electrode, we placed the sensors in the middle of the grids in phantom 1 and 2, and at edge contacts in phantom 3 and 4. In some tests, we conducted multiple temperature measurements on exactly the same phantom (with intracranial electrodes) rotated with respect to the scanner’s B0 field, since the relative angle of magnetic fields and electrodes can influence heating at the contacts.
2.1.4. MR scanner and scanning protocols
A Siemens TIM Trio 3 T scanner was used with a transmit-receive head coil (circularly polarized quadrature coil; USA instruments, Aurora, OH). The scanner’s whole-body RF transmit coil and head matrix (receive only) were also used for some experiments. The whole-body RF transmit coil generates larger amplitude RF pulses within a much wider volume compared to the head coil, and thus could generate more heating, consequently we did not use the whole-body coil for any of our human es-fMRI studies. The sequences tested included turbo spin echo (TSE) T2 weighted 2-dimensional structural image acquisition, magnetization prepared rapid acquisition gradient-echo (MPRAGE) sequence for structural T1 volume acquisition, and gradient-echo echo-planar imaging (GRE-EPI) sequence for the T2* weighted functional MRI. Details of the scanning parameters are as follows:
MPRAGE: 3D acquisition, TR = 2530 ms, TE = 3.12 ms, TI = 1100 ms, FOV read = 256 mm, Flip angle = 10 deg, 1 × 1 × 1 mm voxel size, 224 slices, Bandwidth = 190 Hz/Px, Echo spacing = 8.3 ms, Whole body averaged SAR (specific absorption rate) = 0.038 W/Kg, Head averaged SAR = 0.595 W/Kg, Scan time = 10 min 48 sec.
GRE-EPI: Single-shot gradient-echo echo-planar imaging. 2D acquisition, TR = 3000 ms, Delay-in-TR = 100 ms, TE = 30 ms, FOV read = 205 mm, Flip angle = 90 deg, Slice thickness = 3 mm, Bandwidth = 1934 Hz/Px, Echo spacing = 0.58 ms, 270~330 measurements, Whole body averaged SAR = 0.040 W/Kg, Head averaged SAR = 0.761 W/Kg, Scan time = 13 min 36 sec ~ 16 min 21 sec.
TSE: 2D acquisition, T2 weighted, FOV read = 220 mm, TR = 10000 ms, TE = 94 ms, NEX = 2, Echo train = 24, Slice thickness = 4 mm, 14 slices, Echo spacing = 8.53 ms, Bandwidth = 220 Hz/Px, Whole body averaged SAR = 0.176 W/Kg, Head averaged SAR = 3.042 W/Kg, Scan time = 8 min 12 sec.
Patient data: BW = 80 kg, Height = 170 cm, Age = 25 years old and Sex = Male were entered for the calculation in the MR system. The MR system monitors the SAR by measuring the transmit power during the scanning.
2.1.5. Electrical stimulation device
Electrical stimuli were delivered through the intracranial electrodes using a battery-driven isolated constant current stimulator (IZ-2H stimulator, Tucker-Davis technology’s, Alachua, FL, USA, and Model 2200 isolator, A-M systems, WA, U.S.A.). The stimulus waveforms were designed using OpenEx software in the Tucker-Davis RZ2 processing base station (sampling rate of 48 kHz) and sent to the stimulator for generation of the actual electrical stimulus. Hardware RF filters (Mini-Circuit, Brooklyn, NY, BLP-1.9+, passband: DC - 1.9 MHz) were installed on the patch-panel of the scanner room and inserted between electrodes and the stimulator in order to avoid noise contamination of the MR images. The stimulator, battery and stimulus controlling equipment were all in the control room adjacent to the MR scanner. Electrode tail leads were kept parallel to the scanner’s B0 field orientation. The experimental setup is shown in Fig. 1A.
Figure 1.
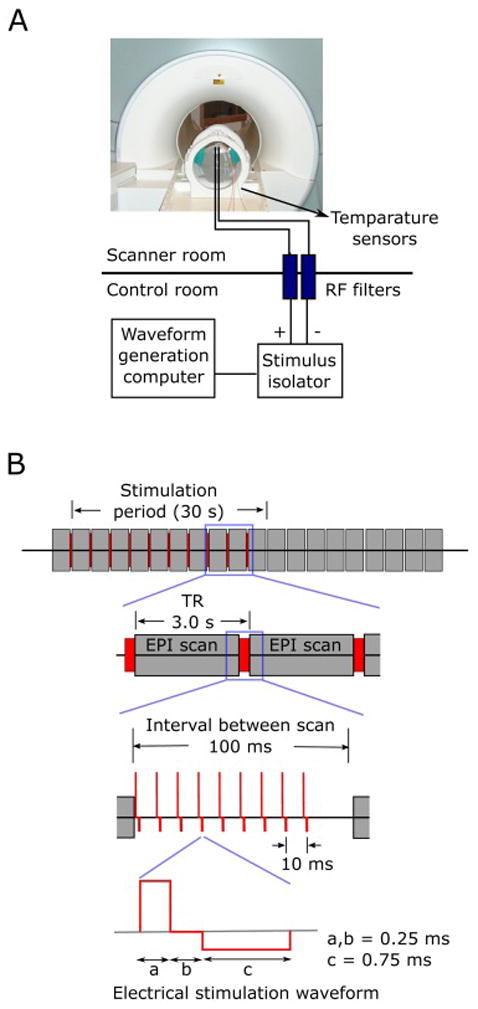
Experimental set-up and electrical stimulation paradigm used for phantom tests and experiments in patients. (A) Setup for tests using gel phantom. All research equipment was in the shielded control room next to the scanner. The stimulator was connected to the electrodes through RF filters installed on the patch panel of the scanner room. Fiber optic temperature sensors were attached directly to the electrode contacts. Stimulus waveforms were generated in the waveform generation computer (TDT workstation and processor) at 48 kHz sampling rate and fed into the constant current stimulus isolator. The scanner’s volume trigger pulses were received by the TDT processing unit to control the timing of the stimulus delivery. (B) Electrical stimulation paradigm used for the testing and actual human experiments. Electrical stimuli were delivered to the subjects between EPI volume acquisition, during a 100 ms blank period, ensuring no temporal overlap with RF transmission nor with gradient switching. Modified charge-balanced constant current bi-phasic pulses were used.
2.1.6. Stimulus waveforms
We used bi-phasic charge-balanced square pulses (Fig. 1B; 50 – 90 ms, 5 – 9 pulses at 100 Hz repetition rate). For testing purposes in the phantom only, we also used mono-phasic square pulses with variable magnitudes and durations. The pulse repetition rates tested were 50, 100 and 200 Hz. We also varied pulse width for the leading positive phase from 0.2 ms to 2 ms during tests designed to examine imaging-induced electrode deflections. Charge density per phase at 12 mA with pulse duration of 0.25 ms was 46.8 μC/cm2 and 41.6 μC/cm2 for surface disk contacts and cylindrical depth contacts, respectively.
2.1.7. Assessment of electrode deflection during electrical stimulation
Current flow across electrodes in the magnetic field generates force and may deflect the electrode contacts. To assess this effect, we used video monitoring with a 4 contact strip electrode (Ad-tech, catalog # TS04R-SP10X) suspended in normal saline. The beaker was placed in the center of the scanner bore and the electrode contacts were connected to the stimulator. The electrode was orientated along the scanner’s z-axis so that when current was flowing between two adjacent contacts, the force would be in a direction perpendicular to the viewing axis of the camera. Video images of the electrode were then obtained as different electrical stimulation parameters were tested. Movement was visually assessed using these video images. The resolution of the images was such that electrode deflection of as small as 1 mm was easily visualized using this method. For this test, we used continuous electrical stimulations (not the short duration stimulus pulse train shown in Fig. 1) to clearly observe the induced movement.
2.1.8. Induced voltage measurements
During image acquisition, RF transmission and magnetic gradient switching within the MR scanner could induce voltage changes within intracranial electrode leads. We measured the induced voltages across pairs of electrode contacts. The voltage measurements were obtained during GE-EPI scanning using oscilloscopes (Techtronics TDS2022 200MHz scope and Agilent 54642D 500 MHz) with a balanced coaxial cable (Lemieux et al., 1997) and a coaxial cable internally terminated in 50 Ω.
2.2. Human es-fMRI experiments
2.2.1. Subjects
Our human subjects were neurosurgical patients who required chronic invasive intracranial monitoring for the treatment of medically intractable epilepsy (Table 1). An electrocorticography (ECoG) monitoring plan was generated by the University of Iowa comprehensive epilepsy program after considering each patient’s clinical requirements. All experimental procedures were approved by the University of Iowa Institutional Review Board, who had available our gel phantom safety experiments for their evaluation prior to any human experiments. Written informed consent was obtained from all subjects.
Table 1.
Subject’s demographics and stimulation parameters
| ID | Scanner | Age | Sex | Handedness | Stimulation parameters |
|---|---|---|---|---|---|
| 289 | 1.5 T Avanto | 24 | F | R | 9 mA, 100 Hz, 5 pulses |
| 292 | 3 T Trio | 50 | M | R | 9 mA, 100 Hz, 5 pulses |
| 294 | 3 T Trio | 34 | M | R | 9 mA, 100 Hz, 5 pulses |
| 302 | 3 T Skyra | 46 | F | L | 9 mA, 100 Hz, 5 pulses |
| 303 | 3 T Skyra | 34 | F | R | 9 mA, 100 Hz, 5 pulses |
| 307 | 3 T Skyra | 29 | M | R | 12 mA, 100 Hz, 7 pulses |
| 314 | 3 T Skyra | 31 | F | R | 12 mA, 100 Hz, 9 pulses |
| 316 | 3 T Skyra | 31 | F | R | 9 mA, 100 Hz, 7 pulses |
| 320 | 3 T Skyra | 51 | F | R | 12 mA, 100 Hz, 9 pulses |
| 322 | 3 T Skyra | 28 | F | R | 15 mA, 100 Hz, 7 pulses |
| 329 | 3 T Skyra | 21 | M | R | 8 mA, 100 Hz, 9 pulses |
| 330 | 3 T Skyra | 43 | M | L | 12 mA, 100 Hz, 9 pulses |
| 331 | 3 T Skyra | 35 | M | R | 12 mA, 100 Hz, 9 pulses |
| 334 | 3 T Skyra | 39 | M | L | 12 mA, 100 Hz, 9 pulses |
| 335 | 3 T Skyra | 31 | M | R | 12 mA, 100 Hz, 9 pulses |
| 339 | 3 T Skyra | 45 | M | R | 12 mA, 100 Hz, 9 pulses |
2.2.2. Experimental schedule
Patients remained in an electrically shielded special monitoring room in the University of Iowa’s Clinical Research Unit for approximately 7–14 days after implantation of intracranial electrodes. es-fMRI experiments were performed after the final surgical treatment plan was agreed upon between the clinical team and the patient, and it was justified to move the patient to the MRI scanner (usually within 16 hours prior to the electrode removal surgery). A T1 weighted structural MPRAGE volume was also obtained in the same experimental session from all subjects (1 mm isotropic resolution, TI 100ms, Flip angle 10 deg, TE 3.52 ms, TR 2530 ms). Baseline high-resolution pre-operative anatomical brain MRIs were obtained routinely from every patient (Multi-echo MPRAGE. 1 mm isotropic resolution. 4 echos at 1.74, 3.6, 5.46 and 7.32 ms. TI 1260 ms. Flip angle 7.0 deg. Bandwidth 651 Hz/Px). As well, resting-state fMRI, together with various task-fMRI sessions, were typically carried out both pre- and post-implantation.
2.2.3. es-fMRI design
We used a block design with 10 whole-brain EPI volumes acquired interleaved with electrical stimulation (resulting in a 30 s block of stimulation ON), and 11 volumes in the absence of electrical stimulation (resulting in a 33 s block of stimulation OFF), permitting a simple contrast between the two types of blocks to visualize activated voxels using a general linear model. We acquired a total of 220–242 volumes in ca. 11–12 minutes of scanning time per session. To minimize stimulation-induced artifacts in the MRI and reduce the possibility of interactions between the external electrical stimulations and RF or gradient switching-induced potentials in the electrodes, we introduced a 100 ms epoch into a standard fMRI protocol in which the scanner was effectively switched off except for the B0 field (Figure 1B). Stimulated contacts were adjacent two macro-electrode contacts. Two stimulus isolators were connected in parallel to prevent isolator overload, and biphasic charge-balanced constant current stimulus waveforms of +3 ~ 12 mA/-1 ~ -4 mA were delivered at 100 Hz repetition rate (Fig. 1B). Mean in-situ electrode impedance measured at the time of the experiments was 4.08 (sd = 1.65) and 2.06 (sd = 0.94) kΩ, for 100 and 1 kHz, respectively (n = 29).
2.2.4. Electrode localization
Localization of the electrodes was done as follows. We routinely obtain two baseline (pre-implantation) structural MRI volumes (averaged), two post-electrode implantation structural MRI volumes obtained right after implantation, another two structural MRI volumes at the time of the es-fMRI session, and a volumetric thin-sliced CT scan (1 mm slice thickness) obtained on post-operative day one. Electrode contacts were identified on the post-implantation MRI/CT volumes and transferred onto the pre-implantation baseline MRI volumes. Great attention was paid to possible post-surgical brain shift, which was corrected with a 3D thin-plate spline warping procedure. For the delineation of the sub-nuclei of the amygdala, we utilized a nonlinear warping applied to the atlas of the human brain to draw borders of the sub-nuclei of the amygdala on the subject’s brain.
2.2.5. es-fMRI EPI data analysis
Electrical stimulation-induced BOLD responses were analyzed with a General Linear Model (GLM). Each patient’s EPI images were subjected to the following pre-processing steps. (1) The first two EPI volumes were discarded to account for T1-equilibration effects; (2) Slice-timing differences were compensated by Fourier interpolation using the center slice acquisition as a reference time point; (3) Motion correction was performed and, within each run, EPI volumes were registered to the 10th EPI volume of the run. Each es-fMRI run’s framewise displacement (FD) was also calculated with backward differences of motion parameters; (4) Retrospective denoising was applied using FIACH (Tierney et al., 2016) on the motion corrected (but unsmoothed) EPI data sets. Further, principal component noise regressors (n=6) were calculated and used for regressing-out the effect of noise; (5) The patient’s T1 structural volume was co-registered to that patient’s mean EPI volume; (6) Spatial smoothing with a Gaussian kernel of FWHM (full-width at half-maximum) = 6 mm was applied. (7) EPI time series were detrended by least squares fit of Legendre polynomials of order 5; (8) Frame censoring was applied for TRs with framewise displacement > 0.5 mm (Siegel et al., 2014). The hemodynamic response was modeled using a boxcar function of duration 50 – 90 ms (depending on the actual duration of the stimulus) convolved with a single parameter gamma function (peak at 5 s, the amplitude of the basis function was normalized to peak values of 1). These analyses were performed in the patient’s original space. Registration between the functional EPI volume and the subject’s anatomical volume was performed with a 12 parameter affine transformation while masking out the region that has large signal dropout due to subdural surface electrodes. Statistical maps were thresholded using a clusterwise alpha probability at P = 0.05. We set a voxel-wise cluster-defining threshold at P = 0.001. The spatial auto-correlation function was estimated from a mixed Gaussian plus exponential model, and these model parameters were then used to estimate cluster extent threshold by Monte Carlo simulations with AFNI’s updated version of 3dClustSim (compiled date; June-16-2016). These analyses were performed using AFNI, Matlab and R.
2.2.6 Resting-state fMRI data analysis
We compared our es-fMRI results with resting-state fMRI data (rs-fMRI) obtained pre-surgically from the same subject. Resting-state data were acquired with the Siemens Trio 3T MR scanner within 2 weeks before electrode implantation (eyes open with fixation cross presented on the display through a projector). Due to time constraints, we did not collect rs-fMRI data also in the same scanning session as the es-fMRI, but this will be an important future protocol to adopt, in order to ensure that rs-fMRI and es-fMRI data derive from patients in the same cognitive state.
Scanning parameters
Parameters for the rs-fMRI were: TE = 30 ms, TR = 2260 ms, Slice thickness = 4 mm, no gap, Matrix = 64×64, Flip angle = 80 deg., Bandwidth = 2003 Hz/Px, 3.43 × 3.43 mm pixel size, FOV = 220 mm. The number of resting state EPI volume measurements were 180 (1 run), 520 (4 runs) and 650 (5 runs). For each patient, rs-fMRI runs were acquired in a same session but non-contiguously (dispersed within an imaging session to avoid habituation). Standard preprocessing was applied, including despiking and slice timing correction, and spatial alignment. White matter and ventricles were masked using Freesurfer parcellation. Nuisance regressors were extracted from the masks and detrended with second order polynomials. Temporal bandpass filtering was 0.009–0.1 Hz. Regression was performed using the time series calculated above as well as motion parameters and their derivatives. Spatial smoothing was applied with a 8 mm FWHM Gaussian kernel. The first 2 scans from each run were always discarded. Frame censoring was also applied when the Euclidean norm of derivatives of motion parameters exceeded 0.3. As with the es-fMRI censoring, we always censored a contiguous series of three volumes, at three TRs centered at the one where displacement was detected.
Resting-state connectivity maps were generated by placing seeds at the site of the subsequent electrical stimulation (note there were no electrodes in the brain yet when rs-fMRI was acquired) and the mean time series extracted from a sphere around the seed voxel (2.5 mm radius) was used for the correlation calculation. Seed-based functional connectivity maps were created by calculating Pearson’s correlation coefficients between this time series and all other voxels in the brain masks. For the comparison between the rs-fMRI connectivity and es-fMRI informed connectivity, we also used es-fMRI datasets processed with a 8 mm Gaussian smoothing kernel and 6 motion regressors and their temporal derivatives, but without FIACH.
3. Results
3.1 Phantom testing
3.1.1. Heating of the electrodes
Results of temperature measurement of the electrodes during MRI scanning at 3 Tesla are presented in Fig. 2A for three different scanning sequences (GE-EPI, MPRAGE and TSE). For GE-EPI with head transmit coil, fifty-six temperature measurements were obtained. The maximum temperature rise was 0.78 °C. The median value of maximum temperature rise was 0.17 °C with inter-quartile range of 0.13 °C. For MPRAGE with head transmit coil, nine temperature measurements were obtained. The maximum temperature rise was 0.58 °C with inter-quartile range of 0.12 °C. GE-EPI and MPRAGE sequences are considered Low-SAR sequences. With head-transmit RF coil, the temperature rise was well below 1°C. For the TSE sequence with body-RF coil transmission, sixty-five temperature measurements were obtained. The maximum temperature rise was 1.61 °C. The median value of maximum temperature rise was 0.46 °C with inter-quartile range of 0.47 °C. The heating effect with a TSE sequence was significantly higher than with the GE-EPI (rank-sum test, P < 10−10) and could exceed 1 °C. Because electrode placement can vary patient-by-patient, we also examined the temperature changes at multiple orientations of the phantom in the scanner’s bore. Fig. 2C shows this orientation effect in two different scanning sequences using the same phantom (with the same electrode placement). The results confirm that our scanning parameters would induce temperature changes well below safety limits.
Figure 2.
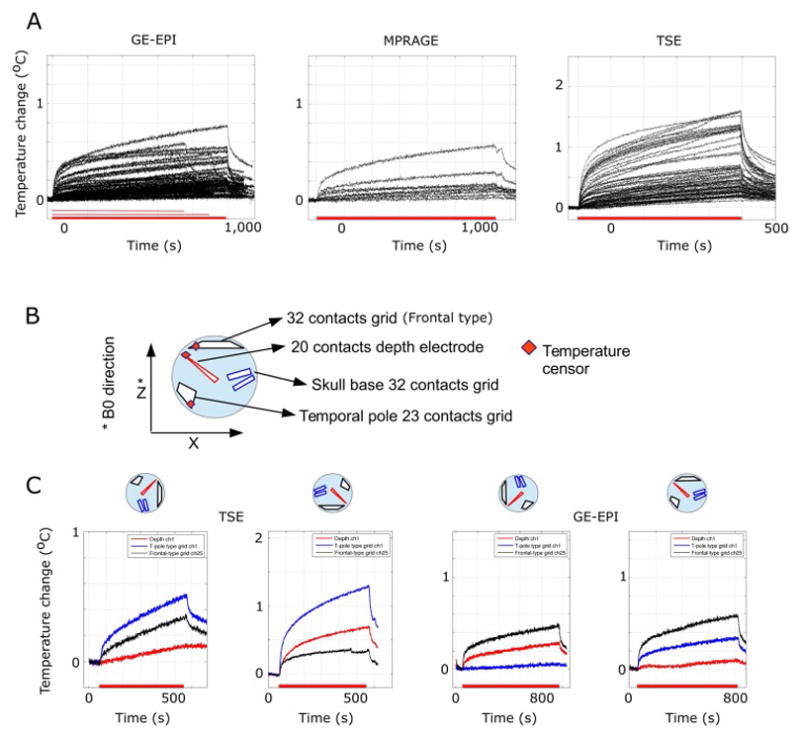
Heating of the electrode contacts in a gel phantom. (A) Temperature changes on macro-contacts of the depth electrodes induced by different MR scanning protocols. A transmit-receive head coil was used at 3 Tesla. Shown are, from left to right, results obtained with MPRAGE (the sequence we used in the patients for structural scans), GE-EPI (the sequence we used in the patients for functional scans), MPRAGE and turbo spin-echo (TSE, not used with patients and included only for comparison). Each trace plots the results from different experiments. Red bars on the x-axis denote different length of the experimental MRI session. (B) Orientation of the electrode placement in a phantom. Three temperature sensors were attached to the contacts, shown by red squares. (C) Effect of phantom orientation in the scanner’s bore. The phantom was rotated along y-axis as shown. Right 2 panels show orientation dependencies in TSE scanning and the left 2 panels show the results from GE-EPI scanning. There were marked orientation dependencies for heating, but in no case did the electrode heating exceed 1 °C during GE-EPI scanning. During TSE scanning, on the other hand, the temperature changes sometimes exceeded 1 °C.
3.1.2. Induced voltage measurements during GE-EPI
As anticipated, we observed that RF excitation pulses and gradient switching induced voltage changes across electrode contacts (Fig. 3A). There were 3 main components visible (1,2,3 in Figure 3A), generated, respectively, by the fat-saturation pulse, excitation RF pulse, and gradient switching. The frequency range for the voltage change induced by the RF pulse was over 100 MHz, reflecting the Larmor frequency at 3 Tesla. RF pulse-induced voltage oscillations at such high frequencies are not effective in inducing neuronal activation. The frequency range for the voltage change induced by the gradient switching was approximately 1 – 2 kHz with an amplitude of +− 30 mV. At these lower frequency ranges the currents/voltages induced by the gradient-switching are much lower amplitude and there is negligible energy absorption. Charge densities calculated from the voltage and impedance of the electrode were 0.29 μC/cm2 and 0.18 μC/cm2 for grid and depth-electrode contacts, respectively. Taken together, these induced voltage changes are either at too high a frequency (component 1 and 2), or too low an amplitude (component 3) to present safety concerns for depolarizing neurons in the brain.
Figure 3.
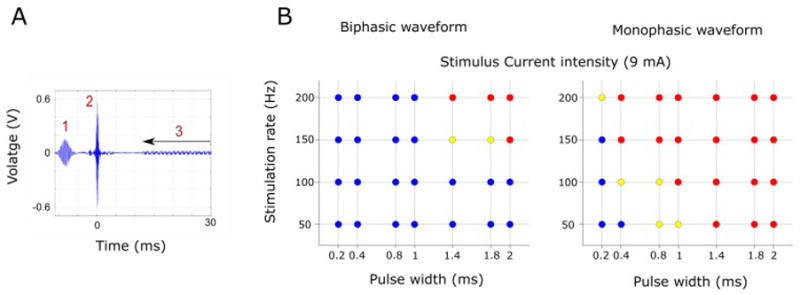
Induced voltage and electrode deflection during current flow in the scanner. (A) Measured induced voltage between two adjacent depth electrode contacts. Fat saturation (1) and RF pulse (90 deg. flip angle, 2 in the figure) pick-up are shown. Gradient switching induced voltage (3) is also seen during EPI data acquisition. (B) Results of electrode deflection test during constant current delivery between two adjacent electrode contacts. Blue circles indicate there was no observable movement, yellow circles indicate there was questionable movement and red circles indicate there was clearly observable movement. Tested using both bi- and mono-phasic waveforms with different frequencies and pulse widths.
3.1.3. Movement caused by electrical stimulation
Current flow between two adjacent contacts in the magnetic field generates force on the electrode and this was quantified with video imaging. We tested the effect using bi-phasic and mono-phasic stimuli with different pulse widths and repetition rates up to 200 Hz. The results are presented in Fig. 3B. Using bi-phasic short pulse-width stimulus waveforms (pulse width equal or less than 1 ms), no displacement was observed. On the other hand, using mono-phasic waveforms caused observable deflection of the electrode in both a frequency- and pulse-width-dependent manner. We consequently used only biphasic waveforms for all our human studies.
3.2 Human es-fMRI experiment
3.2.2. Human subjects
16 patients (age 21 – 51, 7 males and 9 females, 13 right handed and 3 left handed; Table 1) participated in the es-fMRI research protocol. The total number of es-fMRI runs performed over 16 subjects was 90. No complications occurred clinically or radiologically. The only adverse effect we observed was a transient headache associated with the electrical stimulation at 12 mA in subject 329, possibly from current spread to the frontal skull base. The headache disappeared by reducing the stimulus current to 8 mA and there were no long-term consequences.
3.2.3. Subject head motion during es-fMRI
Subject head motion during scanning is a well-known issue for quality assessment in fMRI. The overall distribution of median framewise displacement (FD) for each run, and broken down by individual subject, are presented in Fig 4. The median FD values ranged from 0.04 – 0.75 mm with the majority of values within 0.4 mm. As explained in the Methods section 2.2.5, we applied retrospective noise control by applying FIACH with 6 PC noise regressors and frame censoring according to an individual FD threshold at 0.5 mm (Siegel et al., 2014; Tierney et al., 2016).
Figure 4.
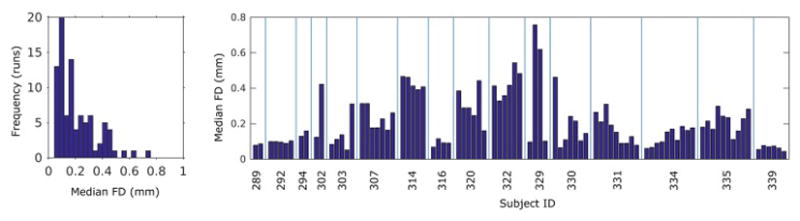
Subjects’ head motion during es-fMRI experiments. Subjects’ head motion was accessed with framewise displacement (FD) calculated from 6 motion parameters. Left panel shows overall distribution of the FD values. Total number of runs over 16 patients are 90. Right panel shows break-up of the FD values according to the patients. There are low-motion as well as higher-motion patients. es-fMRI runs per patient ranged from 2 to 10.
3.2.4. es-fMRI activation: Prefrontal cortex electrical stimulation
Depth and subdural surface grid electrodes were implanted to monitor activity in the dorsolateral prefrontal as well as ventromedial prefrontal cortex; cingulate gyrus was implanted with depth electrodes. An example of focal BOLD activation induced by stimulation of the ventromedial prefrontal cortex (VMPFC) is shown in Fig. 5. Our 11-min block design stimulation (100Hz, 12 mA, 9 pulses every 3 s; Figure 1) reliably induced activation. We observed a positive BOLD response in right basal forebrain and amygdala (Fig. 5B) which was clearly seen in the BOLD time series extracted from the activated cluster in the right amygdala (Figure 5C) time locked to the electrical stimulation of the VMPFC. Reliability of the BOLD response is shown in Fig. 5D, demonstrating an evoked response typically of about 1% signal change.
Figure 5.
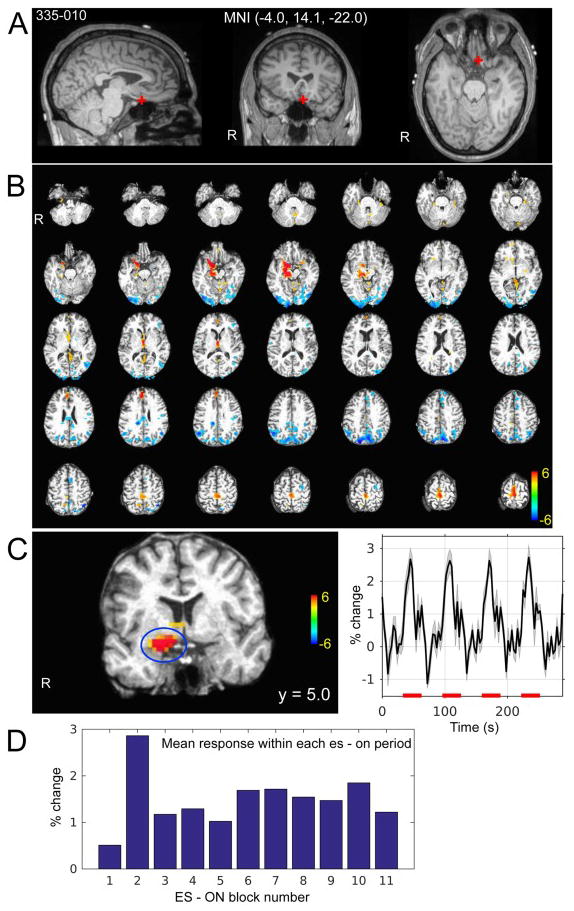
Ventromedial prefrontal cortex stimulation es-fMRI in one subject (335). (A) Stimulated site is shown with the red cross on the subject’s pre-electrode implantation structural MRI. Site of stimulation was left posterior ventromedial prefrontal cortex within the left gyrus rectus. MNI coordinates are shown. (B) Whole brain activation map. Colorscale indicates t-value. Thresholded at cluster-wise alpha = 0.05 with cluster defined threshold at P < 0.001 (see methods section 2.2.5). (C) Enlarged view of a coronal slice that shows activation at basal forebrain and amygdala on the left. Averaged time course of detrended BOLD time series (not GLM model fitted response) within the cluster shown on the left panel (blue circle). Error bands represent s.e.m. Red bars on the x-axis indicate electrical stimuli ON period. (D) Stability of the activation of the cluster shown in (C). x-axis indicates ON period (the first to 11-th ON period in this case) and bars indicate mean BOLD response within the ON period.
3.2.5. es-fMRI activation: Amygdala electrical stimulation
The amygdala is one of the most common sites for depth electrode implantation in epilepsy patients, since medial temporal lobe epilepsy is the most commonly encountered. An example is shown in Fig 6. Electrical stimulation at the border of the left lateral nucleus and basal nucleus evoked robust activations in sectors of anterior prefrontal and cingulate cortex, as well as higher-order visual cortex in the temporal lobe (Fig. 6B), consistent with the known connectivity of the amygdala. Notable also was a prominent negative BOLD response, especially in posteromedial cortex (PMC) (posterior cingulate cortex, precuneus and retrosplenial cortex) and superior temporal sulcus (STS) (Fig. 6C and D). The pattern of BOLD response in the PMC and STS were clearly time-locked to our stimulation, but the detailed time course profile differed. es-fMRI BOLD activation maps and summary table from other subjects are shown in supplementary figures and table.
Figure 6.
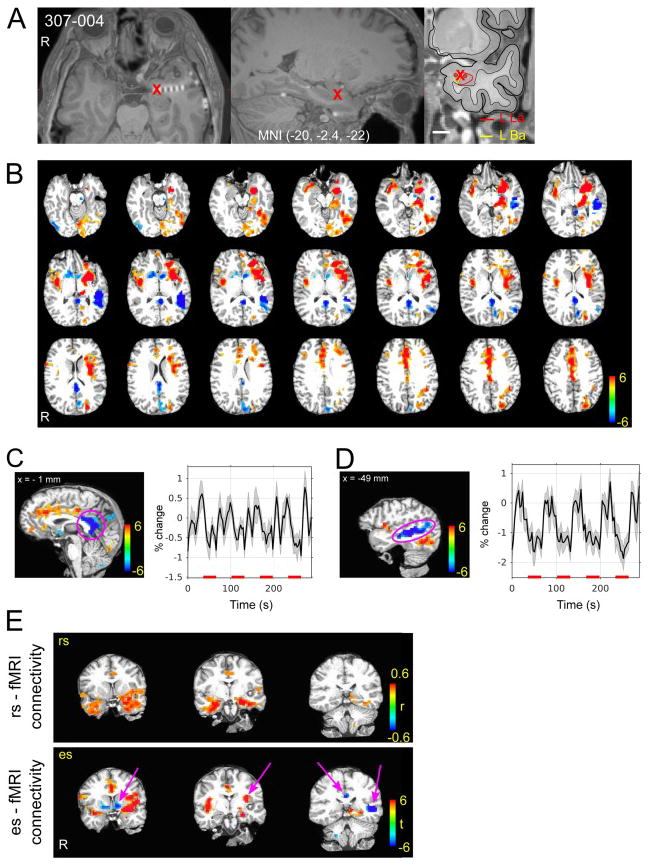
Amygdala stimulation es-fMRI in one subject (307). (A) Stimulated site is shown with the red cross. Right panel shows subnuclear delineation of the amygdala shown on the subject’s pre-electrode implantation surgery. (B) BOLD activation map. Colorscale indicates t-value. Thresholded at cluster-wise alpha = 0.05 with cluster defined threshold at P < 0.001. Note strong negative response in posterior medial cortex and left STS. (C) Averaged time course of detrended BOLD time series (not GLM model fitted response) within the cluster shown on the left panel (pink circle on posterior medial cortex). Red bars on the x-axis indicate electrical stimuli ON period. Error bands represent s.e.m. (D) Averaged time course of detrended BOLD time series (not GLM fitted response) within the cluster shown on the left panel (pink circle on STS). Red bars on the x-axis indicate electrical stimuli ON period. (E) Comparison of es-fMRI connectivity (FIACH processed with 6 mm smoothing, t-map) and rs-fMRI correlation values in the same subject. For rs-fMRI connectivity, a seed was put at the site of electrical stimulation. Averaged time course within 2.5 mm radius around the seed point was used for the correlation coefficient calculation. Left panels show comparison between es- (lower panels) and rs- (upper panels) fMRI connectivity in three identical coronal slices. Note some areas of es-fMRI responses were not shown in the rs-fMRI correlation maps (pink arrows) rs-fMRI correlation maps were thresholded at r > 0.4.
3.2.5. Comparison with resting-state fMRI
The typical approach to estimate functional connectivity in the human brain uses correlations between the BOLD time series from fMRI obtained at rest (resting-state fMRI; rs-fMRI). To probe the fit between the patterns of activation observed with our direct electrical stimulation in the above patient, and that estimated using resting-state BOLD correlations, we compared the two approaches in the same patient. Placing a seed within the site that was later stimulated produced resting-state BOLD correlations with adjacent temporal cortices and sectors of prefrontal cortex, just like we had observed with direct electrical stimulation at the same amygdala site (Fig. 6E). Overall, there was a small but statistically significant spatial correlation over the entire brain (voxelwise) between resting-state correlation patterns, and the activation patterns evoked by direct electrical stimulation. The es- vs rs- connectivity comparisons in three subjects are shown in Fig. 7. Correlation coefficients are r = 0.13, 0.14 and 0.14 for PT 292, PT303 and PT307, respectively (Pearson’s r, all Ps < 10−3). As expected, these correlations increased substantially when considering mean BOLD responses only within those regions that showed a statistically significant BOLD response in each of the two conditions in the first place (colored regions in anatomical cuts of Fig. 7: r = 0.51, r = 0.31, r = 0.27, all Ps < 10−3). On the other hand, it is also clear that there are aspects of causal connectivity suggested by the es-fMRI that are not reflected in functional connectivity seen with resting-state BOLD time series correlation. The two approaches are clearly far from redundant (Fig. 6E).
Figure 7.
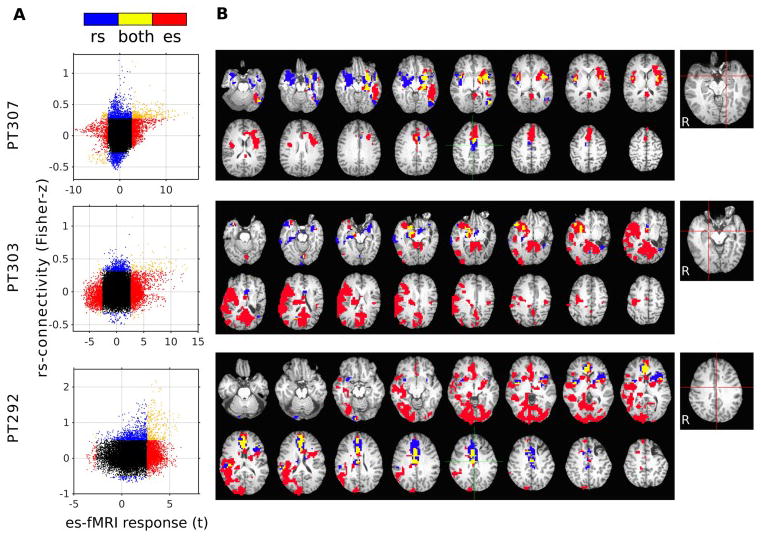
Comparison between es-fMRI-informed connectivity and resting-state (rs-) fMRI connectivity obtained from the same subjects. Functional connectivity maps were constructed from the rs-fMRI session by inflating a 5 mm diameter sphere around the center of the site of electrical stimulation. Results from three patients who had standard rs-fMRI in addition to the es-fMRI session. es-fMRI data were processed without FIACH, smoothed with an 8 mm Gaussian kernel. A. Association between the strength of the rs-fMRI correlation value, and the es-fMRI t-value at the whole-brain level (each point represents data from one unsmoothed voxel within all brain regions that had sufficient signal, masked for susceptibility dropout). Significant connectivity (thresholded as below) is denoted by color (red only in es-fMRI, blue only in rs-fMRI, yellow in both, black in neither). B. Significant connectivity mapped onto the brain. All results were thresholded at cluster-defined threshold at P < 0.005 with cluster size > 20 voxels (es-fMRI) or at P < 10−5 uncorrected (rs-fMRI). Right-most panels indicate stimulation site for the es-fMRI runs and the seed points for rs-fMRI runs (red lines).
4. Discussion
In this report, we document the results of safety testing and initial observation of BOLD activity induced by direct electrical stimulation of the brain through depth electrodes in humans.
We established the safety and feasibility of es-fMRI through extensive studies in a gel phantom followed by in vivo studies in sixteen neurosurgical patients. No complications were encountered in any case. We converged on a protocol using a bi-phasic charge-balanced pulse of peak amplitude of 12 mA at 100 Hz, 9 pulses for each TR. GE-EPI acquisition in a 3T scanner was used, with a standard pulse sequence but a special 100ms delay in the TR to interleave the electrical stimulation. Given the extra RF energy from a whole-body coil, a transmit head coil only should be used. In our pilot studies we initially used much weaker current stimulations (0.08 ~ 0.75 mA), which failed to induce statistically significant BOLD activation. Consequently we recommend the parameters in this paper as both sufficient to induce BOLD activations, and as within the safety considerations of the protocol. A single 11-minute block-design fMRI session was sufficient to produce robust patterns of effective connectivity. This is an efficient protocol that could easily be piggybacked onto extant research studies in patients with depth electrodes.
It is noteworthy that none of the patients in our study reported any subjective sensation during the electrical stimulation, ruling out any blatant confounds arising from indirect behavioral effects. Furthermore, the tight temporal coupling between stimulation and evoked signal reassured us that our activation map reflects direct effects due to the stimulation, rather than indirect effects that could be cognitively or somatically mediated, although future studies will be required to establish this with certainty.
The initial results we obtained are encouraging in their overall consistency with the known connectivity of the primate brain. Tracer studies in monkeys show that amygdala and parts of prefrontal cortex are intimately connected with one another (Ghashghaei et al., 2007; Timbie and Barbas, 2014), as also borne out by findings in humans that lesions in one structure alter BOLD-fMRI signal in the other (Hampton et al., 2007; Motzkin et al., 2015). The effective connectivity we observed between amygdala and prefrontal cortex corroborates this prior work.
In nonhuman animals, several studies have combined the power of focal causal perturbation and the whole-brain field-of-view of fMRI, using optogenetic (Desai et al., 2011; Ferenczi et al., 2016) or electrical stimulation (Moeller et al., 2008; Petkov et al., 2015; Premereur et al., 2015; Tehovnik et al., 2006; Tolias et al., 2005). While stimulation currents in monkey studies using es-fMRI have generally been at least an order of magnitude lower than those we used here, they have confirmed both local activation at the site of stimulation that appears to extend beyond mere current spread as well as long-distance activation due to projections from the excited region. While confirming the potential that es-fMRI has to reveal effective connectivity patterns, these animal studies have generally focused on relatively specific networks rather than whole-brain connectivity (e.g., specific connectivity between patches of temporal cortex involved in face processing), and have not made comparisons with resting-state-derived functional connectivity.
The application of es-fMRI in epilepsy patients faces additional constraints, since electrodes are not implanted for the purpose of electrical stimulation, but rather to record seizure activity for a few days. Nonetheless, it is possible to pass current through the electrodes, and to combine such stimulation with fMRI, first demonstrated at the Cleveland Clinic (Jones et al., 2014a; Jones et al., 2014b). In that study, the clinical purpose of es-fMRI was to stimulate the putative epileptogenic zone and use fMRI as a measure of increased excitability of pathological tissue. Indeed, the study found that resection of those regions that had higher BOLD signal was correlated with better outcome after the surgery. As the purpose was clinical, the studies were performed in an intra-operative MRI suite while patients were under anesthesia, and all electrodes were first removed from the brain with the exception of the electrode closest to the hypothesized epileptogenic zone.
Conducting such studies in awake humans, as we did here, also suggests further experiments capitalizing on concurrent subjective reports and simultaneous recording of physiological responses. For instance, all our studies thus far were conducted at electrical current strengths that did not evoke any subjective percepts; but it is well known that such percepts can be induced, provided sufficient current thresholds are used (Selimbeyoglu and Parvizi, 2010). What changes in the pattern of effective connectivity when the stimulation surpasses this threshold? Answers to such questions would inform our knowledge of differences between conscious and nonconscious brain states. Indeed, since deep brain stimulation is being explored to alter the level of consciousness in patients with minimally conscious or persistent vegetative state (Shah and Schiff, 2010), it could be possible directly to visualize the network-level effects of such stimulation that underlie changes in conscious awareness.
There are obvious limitations with the technique so far, the main one being the spatial extent of current spread. Fibers of passage may be stimulated, especially when depth electrode contacts are located near white matter tracts. It will be important in future studies to combine anatomical MRI that defines the location of stimulation contacts, with detailed white matter maps or diffusion MRI, to better estimate proximity of white matter tracts. On the other hand, stimulating such tracts will be highly informative as well and may help to constrain estimates obtained with tractography. As with all studies of connectivity, functional or structural, the present results should be considered an informative adjunct to results obtained with other methods, such as rs-fMRI or tractography. Also, if the number of implanted contacts is large, the BOLD signal dropout in the vicinity of the metal of the electrodes (especially for surface grids) limits the possible extent of a brain mask within which analyses can be conducted.
Another consideration is the extent to which findings from clinical populations (the only ethically feasible populations for conducting es-fMRI studies) would inform conclusions about connectivity in the healthy human brain. Our method has obvious clinical value within patients with epilepsy (as indeed confirmed in the studies by Jones et al., 2014a and b), but the very nature of the epilepsy raises the concern that findings about brain connectivity in this population may not generalize to healthy individuals. We suggest two approaches to this issue. First, as is commonly done in intracranial recording studies from epilepsy patients, papers should report, and possible exclude, results that were obtained from stimulating locations subsequently determined to be seizure foci. Given the many locations that can be stimulated through depth electrodes in typical cases, it will almost always be possible to stimulate regions that are not the seizure focus. Second, as we have done in the present report, it will be important to obtain an independent measure of connectivity in the same patients that can be compared with results from healthy brains: resting-state fMRI is the obvious candidate. rs-fMRI results from a patient can then be compared to normative rs-fMRI connectivity results (for instance, those available from the Human Connectome Project), and criteria for excluding data that appear too atypical can be applied.
Taken together, our findings argue for the value in a systematic adoption of protocols such as the one we present here, also by the many other groups conducting intracranial recordings in human neurosurgical patients. This would hold out promise to reveal new patterns of connectivity and individual differences in the human brain, as well as network modulations in psychopathology.
Supplementary Material
HIGHLIGHTS.
We developed safe and reliable protocol for concurrent intracranial electrical stimulation and functional MRI (es-fMRI) in awake human subjects at 3 Tesla.
No adverse effect was observed in our series of 16 subjects who underwent es-fMRI experiment.
We compared the es-fMRI effective connectivity with functional connectivity informed by resting-state fMRI and showed both are not redundant and may carries complimentary information about the brain’s connectivity.
Acknowledgments
Support for this work was provided by the National Institute on Deafness and Other Communication Disorders (R01-DC04290), National Center for Research Resources (UL1RR024979), and an NIMH Conte Center (P50MH094258). We thank Haiming Chen, Phillip Gander, Rick Reale for assistance with conducting the experiments, and Jeremy Greenlee, Goldie Boone, Julien Dubois, Swaloop Guntapalli and Tim Tierney for helpful discussion. We thank our patients for their contribution.
Footnotes
Publisher's Disclaimer: This is a PDF file of an unedited manuscript that has been accepted for publication. As a service to our customers we are providing this early version of the manuscript. The manuscript will undergo copyediting, typesetting, and review of the resulting proof before it is published in its final citable form. Please note that during the production process errors may be discovered which could affect the content, and all legal disclaimers that apply to the journal pertain.
References
- Allen EA, Damaraju E, Plis SM, Erhardt EB, Eichele T, Calhoun VD. Tracking whole-brain connectivity dynamics in the resting state. Cereb Cortex. 2014;24:663–76. doi: 10.1093/cercor/bhs352. [DOI] [PMC free article] [PubMed] [Google Scholar]
- Andrews-Hanna JR, Reidler JS, Sepulcre J, Poulin R, Buckner RL. Functional-Anatomic Fractionation of the Brain’s Default Network. Neuron. 2010;65:550–62. doi: 10.1016/j.neuron.2010.02.005. [DOI] [PMC free article] [PubMed] [Google Scholar]
- Biswal BB, Mennes M, Zuo XN, Gohel S, Kelly C, Smith SM, Beckmann CF, Adelstein JS, Buckner RL, Colcombe S, Dogonowski AM, Ernst M, Fair D, Hampson M, Hoptman MJ, Hyde JS, Kiviniemi VJ, Kotter R, Li SJ, Lin CP, Lowe MJ, Mackay C, Madden DJ, Madsen KH, Margulies DS, Mayberg HS, McMahon K, Monk CS, Mostofsky SH, Nagel BJ, Pekar JJ, Peltier SJ, Petersen SE, Riedl V, Rombouts SA, Rypma B, Schlaggar BL, Schmidt S, Seidler RD, Siegle GJ, Sorg C, Teng GJ, Veijola J, Villringer A, Walter M, Wang L, Weng XC, Whitfield-Gabrieli S, Williamson P, Windischberger C, Zang YF, Zhang HY, Castellanos FX, Milham MP. Toward discovery science of human brain function. Proc Natl Acad Sci U S A. 2010;107:4734–9. doi: 10.1073/pnas.0911855107. [DOI] [PMC free article] [PubMed] [Google Scholar]
- Buckner RL, Andrews-Hanna JR, Schacter DL. The brain’s default network: anatomy, function, and relevance to disease. Ann N Y Acad Sci. 2008;1124:1–38. doi: 10.1196/annals.1440.011. [DOI] [PubMed] [Google Scholar]
- Carmichael DW, Pinto S, Limousin-Dowsey P, Thobois S, Allen PJ, Lemieux L, Yousry T, Thornton JS. Functional MRI with active, fully implanted, deep brain stimulation systems: safety and experimental confounds. Neuroimage. 2007;37:508–17. doi: 10.1016/j.neuroimage.2007.04.058. [DOI] [PubMed] [Google Scholar]
- Daunizeau J, David O, Stephan KE. Dynamic causal modelling: a critical review of the biophysical and statistical foundations. Neuroimage. 2011;58:312–22. doi: 10.1016/j.neuroimage.2009.11.062. [DOI] [PubMed] [Google Scholar]
- Desai M, Kahn I, Knoblich U, Bernstein J, Atallah H, Yang A, Kopell N, Buckner RL, Graybiel AM, Moore CI, Boyden ES. Mapping brain networks in awake mice using combined optical neural control and fMRI. J Neurophysiol. 2011;105:1393–405. doi: 10.1152/jn.00828.2010. [DOI] [PMC free article] [PubMed] [Google Scholar]
- Ferenczi EA, Zalocusky KA, Liston C, Grosenick L, Warden MR, Amatya D, Katovich K, Mehta H, Patenaude B, Ramakrishnan C, Kalanithi P, Etkin A, Knutson B, Glover GH, Deisseroth K. Prefrontal cortical regulation of brainwide circuit dynamics and reward-related behavior. Science. 2016;351:aac9698. doi: 10.1126/science.aac9698. [DOI] [PMC free article] [PubMed] [Google Scholar]
- Fox MD, Buckner RL, Liu H, Chakravarty MM, Lozano AM, Pascual-Leone A. Resting-state networks link invasive and noninvasive brain stimulation across diverse psychiatric and neurological diseases. Proc Natl Acad Sci U S A. 2014;111:E4367–75. doi: 10.1073/pnas.1405003111. [DOI] [PMC free article] [PubMed] [Google Scholar]
- Friston KJ. Functional and effective connectivity: a review. Brain Connect. 2011;1:13–36. doi: 10.1089/brain.2011.0008. [DOI] [PubMed] [Google Scholar]
- Ghashghaei HT, Hilgetag CC, Barbas H. Sequence of information processing for emotions based on the anatomic dialogue between prefrontal cortex and amygdala. Neuroimage. 2007;34:905–23. doi: 10.1016/j.neuroimage.2006.09.046. [DOI] [PMC free article] [PubMed] [Google Scholar]
- Greicius M. Resting-state functional connectivity in neuropsychiatric disorders. Current Opinion in Neurology. 2008;21:424–30. doi: 10.1097/WCO.0b013e328306f2c5. [DOI] [PubMed] [Google Scholar]
- Greicius MD, Kimmel DL. Neuroimaging insights into network-based neurodegeneration. Curr Opin Neurol. 2012;25:727–34. doi: 10.1097/WCO.0b013e32835a26b3. [DOI] [PubMed] [Google Scholar]
- Greicius MD, Srivastava G, Reiss AL, Menon V. Default-mode network activity distinguishes Alzheimer’s disease from healthy aging: evidence from functional MRI. Proc Natl Acad Sci U S A. 2004;101:4637–42. doi: 10.1073/pnas.0308627101. [DOI] [PMC free article] [PubMed] [Google Scholar]
- Hampton AN, Adolphs R, Tyszka MJ, O’Doherty JP. Contributions of the amygdala to reward expectancy and choice signals in human prefrontal cortex. Neuron. 2007;55:545–55. doi: 10.1016/j.neuron.2007.07.022. [DOI] [PubMed] [Google Scholar]
- Honey CJ, Sporns O, Cammoun L, Gigandet X, Thiran JP, Meuli R, Hagmann P. Predicting human resting-state functional connectivity from structural connectivity. Proc Natl Acad Sci U S A. 2009;106:2035–40. doi: 10.1073/pnas.0811168106. [DOI] [PMC free article] [PubMed] [Google Scholar]
- Jones SE, Beall EB, Najm I, Sakaie KE, Phillips MD, Zhang M, Gonzalez-Martinez JA. Low consistency of four brain connectivity measures derived from intracranial electrode measurements. Front Neurol. 2014a;5:272. doi: 10.3389/fneur.2014.00272. [DOI] [PMC free article] [PubMed] [Google Scholar]
- Jones SE, Zhang M, Avitsian R, Bhattacharyya P, Bulacio J, Cendes F, Enatsu R, Lowe M, Najm I, Nair D, Phillips M, Gonzalez-Martinez J. Functional magnetic resonance imaging networks induced by intracranial stimulation may help defining the epileptogenic zone. Brain Connect. 2014b;4:286–98. doi: 10.1089/brain.2014.0225. [DOI] [PMC free article] [PubMed] [Google Scholar]
- Lemieux L, Allen PJ, Franconi F, Symms MR, Fish DR. Recording of EEG during fMRI experiments: Patient safety. Magnetic Resonance in Medicine. 1997;38:943–52. doi: 10.1002/mrm.1910380614. [DOI] [PubMed] [Google Scholar]
- Luca FD, Maraviglia B, Mercurio A. Biological tissue simulation and standard testing material for MRI. Magnetic Resonance in Medicine. 1987;4:189–92. doi: 10.1002/mrm.1910040213. [DOI] [PubMed] [Google Scholar]
- Moeller S, Freiwald WA, Tsao DY. Patches with links: a unified system for processing faces in the macaque temporal lobe. Science. 2008;320:1355–9. doi: 10.1126/science.1157436. [DOI] [PMC free article] [PubMed] [Google Scholar]
- Motzkin JC, Philippi CL, Wolf RC, Baskaya MK, Koenigs M. Ventromedial prefrontal cortex is critical for the regulation of amygdala activity in humans. Biol Psychiatry. 2015;77:276–84. doi: 10.1016/j.biopsych.2014.02.014. [DOI] [PMC free article] [PubMed] [Google Scholar]
- Penny WD. Comparing dynamic causal models using AIC, BIC and free energy. Neuroimage. 2012;59:319–30. doi: 10.1016/j.neuroimage.2011.07.039. [DOI] [PMC free article] [PubMed] [Google Scholar]
- Petkov CI, Kikuchi Y, Milne AE, Mishkin M, Rauschecker JP, Logothetis NK. Different forms of effective connectivity in primate frontotemporal pathways. Nat Commun. 2015;6:6000. doi: 10.1038/ncomms7000. [DOI] [PMC free article] [PubMed] [Google Scholar]
- Premereur E, Van Dromme IC, Romero MC, Vanduffel W, Janssen P. Effective connectivity of depth-structure-selective patches in the lateral bank of the macaque intraparietal sulcus. PLoS Biol. 2015;13:e1002072. doi: 10.1371/journal.pbio.1002072. [DOI] [PMC free article] [PubMed] [Google Scholar]
- Selimbeyoglu A, Parvizi J. Electrical stimulation of the human brain: perceptual and behavioral phenomena reported in the old and new literature. Front Hum Neurosci. 2010;4:46. doi: 10.3389/fnhum.2010.00046. [DOI] [PMC free article] [PubMed] [Google Scholar]
- Shah SA, Schiff ND. Central thalamic deep brain stimulation for cognitive neuromodulation - a review of proposed mechanisms and investigational studies. Eur J Neurosci. 2010;32:1135–44. doi: 10.1111/j.1460-9568.2010.07420.x. [DOI] [PMC free article] [PubMed] [Google Scholar]
- Siegel JS, Power JD, Dubis JW, Vogel AC, Church JA, Schlaggar BL, Petersen SE. Statistical improvements in functional magnetic resonance imaging analyses produced by censoring high-motion data points. Hum Brain Mapp. 2014;35:1981–96. doi: 10.1002/hbm.22307. [DOI] [PMC free article] [PubMed] [Google Scholar]
- Simmons WK, Martin A. Spontaneous resting-state BOLD fluctuations reveal persistent domain-specific neural networks. Soc Cogn Affect Neurosci. 2012;7:467–75. doi: 10.1093/scan/nsr018. [DOI] [PMC free article] [PubMed] [Google Scholar]
- Smith SM, Vidaurre D, Beckmann CF, Glasser MF, Jenkinson M, Miller KL, Nichols TE, Robinson EC, Salimi-Khorshidi G, Woolrich MW, Barch DM, Ugurbil K, Van Essen DC. Functional connectomics from resting-state fMRI. Trends Cogn Sci. 2013;17:666–82. doi: 10.1016/j.tics.2013.09.016. [DOI] [PMC free article] [PubMed] [Google Scholar]
- Tehovnik EJ, Tolias AS, Sultan F, Slocum WM, Logothetis NK. Direct and indirect activation of cortical neurons by electrical microstimulation. J Neurophysiol. 2006;96:512–21. doi: 10.1152/jn.00126.2006. [DOI] [PubMed] [Google Scholar]
- Thomas C, Ye FQ, Irfanoglu MO, Modi P, Saleem KS, Leopold DA, Pierpaoli C. Anatomical accuracy of brain connections derived from diffusion MRI tractography is inherently limited. Proc Natl Acad Sci U S A. 2014;111:16574–9. doi: 10.1073/pnas.1405672111. [DOI] [PMC free article] [PubMed] [Google Scholar]
- Tierney TM, Weiss-Croft LJ, Centeno M, Shamshiri EA, Perani S, Baldeweg T, Clark CA, Carmichael DW. FIACH: A biophysical model for automatic retrospective noise control in fMRI. Neuroimage. 2016;124:1009–20. doi: 10.1016/j.neuroimage.2015.09.034. [DOI] [PubMed] [Google Scholar]
- Timbie C, Barbas H. Specialized pathways from the primate amygdala to posterior orbitofrontal cortex. J Neurosci. 2014;34:8106–18. doi: 10.1523/JNEUROSCI.5014-13.2014. [DOI] [PMC free article] [PubMed] [Google Scholar]
- Tolias AS, Sultan F, Augath M, Oeltermann A, Tehovnik EJ, Schiller PH, Logothetis NK. Mapping cortical activity elicited with electrical microstimulation using FMRI in the macaque. Neuron. 2005;48:901–11. doi: 10.1016/j.neuron.2005.11.034. [DOI] [PubMed] [Google Scholar]
- van den Heuvel MP, Sporns O. Network hubs in the human brain. Trends Cogn Sci. 2013;17:683–96. doi: 10.1016/j.tics.2013.09.012. [DOI] [PubMed] [Google Scholar]
- Van Essen DC, Barch DM. The human connectome in health and psychopathology. World Psychiatry. 2015;14:154–7. doi: 10.1002/wps.20228. [DOI] [PMC free article] [PubMed] [Google Scholar]
- Yeo BT, Krienen FM, Sepulcre J, Sabuncu MR, Lashkari D, Hollinshead M, Roffman JL, Smoller JW, Zollei L, Polimeni JR, Fischl B, Liu H, Buckner RL. The organization of the human cerebral cortex estimated by intrinsic functional connectivity. J Neurophysiol. 2011;106:1125–65. doi: 10.1152/jn.00338.2011. [DOI] [PMC free article] [PubMed] [Google Scholar]
- Zhang D, Raichle ME. Disease and the brain’s dark energy. Nature Reviews Neurology. 2010;6:15–28. doi: 10.1038/nrneurol.2009.198. [DOI] [PubMed] [Google Scholar]
Associated Data
This section collects any data citations, data availability statements, or supplementary materials included in this article.