Abstract
Age-related macular degeneration (AMD) is a leading cause of visual loss among older adults. Two variants in the complement factor H (CFH) gene, Y402H and I62V, are strongly associated with risk of AMD. CFH is encoded in Regulator of Complement Activation gene cluster in chromosome 1q32, which includes complement factor-related (CFHR) proteins, CFHR1 to CFHR5, with high amino acid sequence homology to CFH. Our goal was to build a selected reaction monitoring (SRM) assay to measure plasma concentrations of CFH variants Y402, H402, I62, and V62, and CFHR1–5. The final assay consisted of 24 peptides and 72 interference-free SRM transition ion pairs. Most peptides showed good linearity over 0.3–200 fmol/µL concentration range. Plasma concentrations of CFH variants and CFHR1–5 were measured using the SRM assay in 344 adults. Plasma CFH concentrations (mean, SE in µg/mL) by inferred genotype were: YY402, II62 (170.1, 31.4), YY402, VV62 (188.8, 38.5), HH402, VV62 (144.0, 37.0), HY402, VV62 (164.2, 42.3), YY402, IV62 (194.8, 36.8), HY402, IV62 (181.3, 44.7). Mean (SE) plasma concentrations of CFHR1–5 were 1.63 (0.04), 3.64 (1.20), 0.020 (0.001), 2.42 (0.18), and 5.49 (1.55) µg/mL, respectively. This SRM assay should facilitate the study of the role of systemic complement and risk of AMD.
Keywords: age-related macular degeneration, complement factor H, complement factor H-related proteins, mass spectrometry, selected reaction monitoring
1 Introduction
Age-related macular degeneration (AMD) is the leading cause of visual loss among adults aged 65 years or older in developed countries [1]. Genetic factors, smoking, and diet account for most of the risk of AMD [1]. The complement factor H gene, CFH, is strongly associated with AMD [2–5]. The complement system plays an important role in cellular integrity, microbial killing, immune surveillance, tissue homeostasis, and mediation of inflammatory responses [6]. Complement is involved in the recognition of diseased or damaged host cells, regulation of cellular immune responses, and interaction with the coagulation cascade. Complement discriminates between foreign, altered, and healthy surfaces. Excessive activation or insufficient control of the complement system appears to increase the risk of AMD, but the biological mechanisms remain unknown.
There are four common variants in CFH, of which two are strongly associated with risk of AMD: tyrosine 402 to histidine (Y402H) and isoleucine 62 to valine (I62V). CFH is encoded in the Regulator of Complement Activation gene cluster in chromosome 1q32, which also includes five complement factor-related (CFHR) proteins, CFHR1 to CFHR5, with high amino acid sequence homology to CFH. A common haplotype, with deletion of CFHR1 and CFHR3 (CNP147 deletion), is associated with a decreased risk of AMD [7,8]. The protective effects associated with the CNP147 deletion are independent of the CFH Y402H polymorphism [9]. Variants in CFHR2, CFHR4, and CFHR5 have also been associated with risk of AMD [10,11]. The substitution of histidine for tyrosine at residue 402 alters the binding of CFH and impairs the function of CFH in limiting inflammation [12–17]. CFH binding and function are also compromised by the substitution of valine for isoleucine at residue 62 [18–20].
AMD is characterized by localized inflammation and the presence of multiple proteins associated with complement, complement activation and regulation, and inflammatory proteins in drusen and the retinal pigment epithelium, Bruch’s membrane, and choriocapillaris [21,22]. The relative roles of systemic versus local production of CFH in the pathogenesis of AMD remain unclear. Whether plasma concentrations of CFH Y402H and I62V variants and plasma CFHR1–5 concentrations are related to the risk of AMD has not been established. Currently available antibody and aptamer-based approaches are limited in distinguishing and quantifying highly homologous sequence variants of CFH and CFHR1–5. SRM, however, overcomes the shortcomings of current immunoassays by providing a highly sensitive and specific targeted mass spectrometric methodology for precise and accurate quantification of proteins and variants. Because of the high sequence homology among CFH variants and CFHR1–5, the optimal approach for characterization of these proteoforms in plasma is through use of SRM assay (Supporting Information Fig. 1). In this paper, we describe a novel SRM assay that can accurately measure plasma CFH variants and CFHR proteins. The assays were processed through the PeptideAtlas SRM Experiment Library (PASSEL) and made available at http://www.peptideatlas.org/PASS/PASS00914.
2 Materials and methods
2.1 Selection of proteotypic peptides
For SRM assay development, tryptic peptides were selected following the guidelines of Kuzyk and colleagues [23]. Tryptic peptides unique to each protein were identified using PeptideCutter (ExPASy, Swiss Institute of Bioinformatics), NCBI BLAST and UniProt/BLAST searches, with further support for selection of peptides and optimization of transitions through Skyline (Seattle Proteome Center) using the ProteoWizard libraries (Table 1).
Table 1.
Selection of proteotypic peptides in SRM assay
| Protein name | Targeted peptide sequence in SRM | Length | Molecular weight (Da) |
Charge status |
|---|---|---|---|---|
| CFH variant V62 | SLGNVIMV(Cam)R | 10 | 1149.8 | 2 |
| SLGNVIMV(Cam)R^ | 10 | 1159.8 | 2 | |
| CFH variant I62 | SLGNIIMV(Cam)R | 10 | 1164.0 | 2 |
| SLGNIIMV(Cam)R^ | 10 | 1174.0 | 2 | |
| CFH variant H402 | (Cam)YFPYLENGYNQNHGR | 16 | 2034.6 | 3 |
| (Cam)YFPYLENGYNQNHGR^ | 16 | 2044.5 | 3 | |
| CFH variant Y402 | (Cam)YFPYLENGYNQNYGR | 16 | 2059.8 | 3 |
| (Cam)YFPYLENGYNQNYGR^ | 16 | 2070.0 | 3 | |
| CFH | LSYT(Cam)EGGFR | 10 | 1190.8 | 2 |
| LSYT(Cam)EGGFR^ | 10 | 1200.8 | 2 | |
| (Cam)FEGFGIDGPAIAK | 14 | 1483.0 | 2 | |
| (Cam)FEGFGIDGPAIAK^ | 14 | 1491.0 | 2 | |
| WSSPPQ(Cam)EGLP(Cam)K | 12 | 1547.0 | 2 | |
| WSSPPQ(Cam)EGLP(Cam)K^ | 12 | 1555.0 | 2 | |
| CFHR1 | ISSVGGEATF(Cam)DFPK | 14 | 1616.0 | 2 |
| ISSVGGEATF(Cam)DFPK^ | 14 | 1624.2 | 2 | |
| CFHR2 | STISAEK | 7 | 736.4 | 2 |
| STISAEK^ | 7 | 743.6 | 2 | |
| CFHR3 | LGYNANTSILSFQAV(Cam)R | 17 | 1915.0 | 2 |
| LGYNANTSILSFQAV(Cam)R^ | 17 | 1925.0 | 2 | |
| CFHR4 | YVT(Cam)SNGDWSEPPR | 14 | 1669.0 | 2 |
| YVT(Cam)SNGDWSEPPR^ | 14 | 1679.0 | 2 | |
| CFHR5 | GWSTPPI(Cam)SFTK | 12 | 1382.0 | 2 |
| GWSTPPI(Cam)SFTK^ | 12 | 1388.8 | 2 |
Note:
= stable-isotope-labeled peptides; Cam=cysteine carbamidomethylation; CFH=Complement factor H; CFHR=complement factor H-related proteins
2.2 Synthesis and purification of peptides
Peptides were obtained from New England Peptide (Gardner, MA). Tryptic fragment peptides were prepared by Fmoc-based solid-phase peptide synthesis using per-15N, 13C-labeled (>99% isotopic purity) Arg or Lys as the C-terminal residue attached to the resin. Cysteine side-chain residues were blocked as the carboxyacetamidomethyl thioether. Peptides were cleaved from the resin with ~90% trifluoroacetic acid (TFA) containing appropriate scavengers and isolated by precipitation from ether or by drying of the cleavage cocktail. Peptides were purified by reversed phase chromatography (C18 stationary phase using water-acetonitrile gradients, ion-pairing agent ~0.1% TFA). Peptide purity was confirmed by analytical HPLC. MALDI-MS was used to confirm peptide identity. Purified peptide solutions were prepared and the concentration of the solution was determined by amino acid analysis.
2.3 Optimization of the assay
Selection of optimal charge state and collision energy, confirmation of co-elution of endogenous and SIS peptides, and interference detection was conducted as detailed elsewhere [23]. Three interference-free SRM ion pairs constituted the final SRM assay for the respective proteotypic peptides. The SIS peptide spiking concentration was optimized, and calibration curves, linear range of quantification, and lower limit of quantification are shown in Supporting Information Tables 1 and 2.
2.4 Study samples
Plasma samples were obtained from 344 adult who were participants in the Age, Gene/Environment Susceptibility-Reykjavik (AGES-Reykjavik) Study, a population-based study aimed at identifying factors that contribute to disease in older adults. The design and assessment of the cohort are described in detail elsewhere [24]. In 2002, when the AGES-Reykjavik Study began, 11,549 previously-examined members of the Reykjavik study cohort (1967–1996) were still alive. A random sample of 5,764 individuals was examined for the AGES-Reykjavik Study in 2002–2006 (known as the AGES I study visit) [24]. This protocol was approved by the Johns Hopkins School of Medicine Institutional Review Board.
2.5 SRM assay development
SRM assays were run on a 5500 triple quadrupole (QTrap) mass spectrometer (Sciex, Framingham, MA) with an instrument run time of 20 min/sample including the 5 min column regeneration step. Samples were run in a randomized manner in blocks of 30 with strict attention to QC. Each block of 30 contained 27 study samples and 3 internal plasma standards in order to monitor QC of each block run. At the beginning and end of each large sample run consisting of ten blocks of 30 samples, a series of SIS peptide standards (13 point standard curve) are run first, followed by a block of 30 samples. Between each block of 30 samples, a mini series of SIS peptide standards (3 QC samples) was run. After completion of ten blocks, the series of SIS peptide standards (13 points) was repeated. Standards and samples were run with three technical replicates for calculation of mean and CVs. Any sample block with CV >20% was re-run with the same standard curves and QC arrangement. The target variants and protein concentrations were calculated and normalized by the linear equation of their respective transitions in a plasma matrix, which was aliquoted from 200 adult participants.
2.6 Statistical analysis
We estimated the mean concentrations of CFHR1–5 and of CFH stratified by genotype. Presence of an allele (I or V at residue 62; Y or H at residue 402) was defined for each participant as detection of at least one variant-specific transition (precursor/fragment ion pair) in two or more technical replicates. For example, if the same I-specific transition was detected in at least two technical replicates, but no V-specific transition was detected in at least two technical replicates, then the participant was inferred to have genotype II62. We used analogous logic to infer genotype VV62. If both an I-specific and V-specific transition were detected in at least two technical replicates, then the participant was inferred to have genotype IV62. We used analogous logic to infer YY402, HH402, and YH402 genotypes. Separately by genotype, we used a linear mixed-effects model framework to estimate mean CFH concentrations. For double homozygotes (e.g., VV62, HH402), we fit an intercept-only model with two random effects: one for participant nested within plate, within transition, and within peptide; and another for participant nested within plate. The first random effect addressed peptide- and transition-specific heterogeneity between plates and participants whereas the second random effect addressed overall heterogeneity between plates and participants. For heterozygotes, we fit a mixed-effects model with intercept and variant-specific indicator fixed effects. Next, we estimated the sum of mean variant-specific peptides at the heterozygous location and used an inverse-variance weighted analysis to compute the overall CFH mean and a first-order Taylor-series expansion to compute the standard error. For example, the model for IV62, YY402 participants included fixed effects for the intercept, I-specific transitions, and V-specific transitions. The mean peptide at residue 62 was computed as the sum of mean I-specific peptide and V-specific peptide. Mean CFH was computed as the mean of residue 62 peptide and all other CFH peptides (the intercept) using inverse-variance weighting. For CFHR1–5, we fit an intercept-only mixed-effects model for each protein with a random effect for participant nested in plate. All analyses were performed using R software version 3.2.0 [27]. Mixed effects models were fit using the lmer() function from the lme4 package [28].
3 Results
The first step in assay development was to identify the best responding peptides of unique sequence (the signature peptides). For quantifying proteins, we had designed and synthesized 40 peptides involved in three CFH, four SNP variants of V62, I62, H402 and Y402, and five CFHR1–5 proteins, including natural and stable-isotope-labeled peptides.
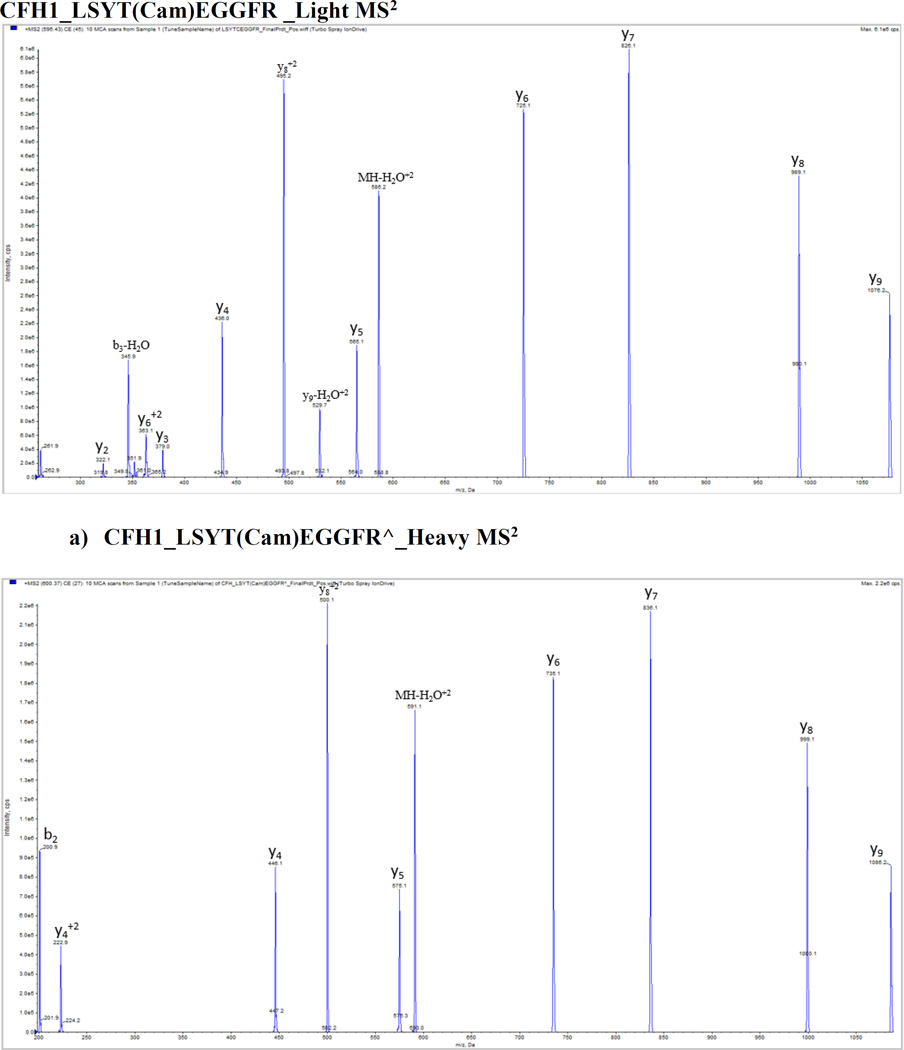
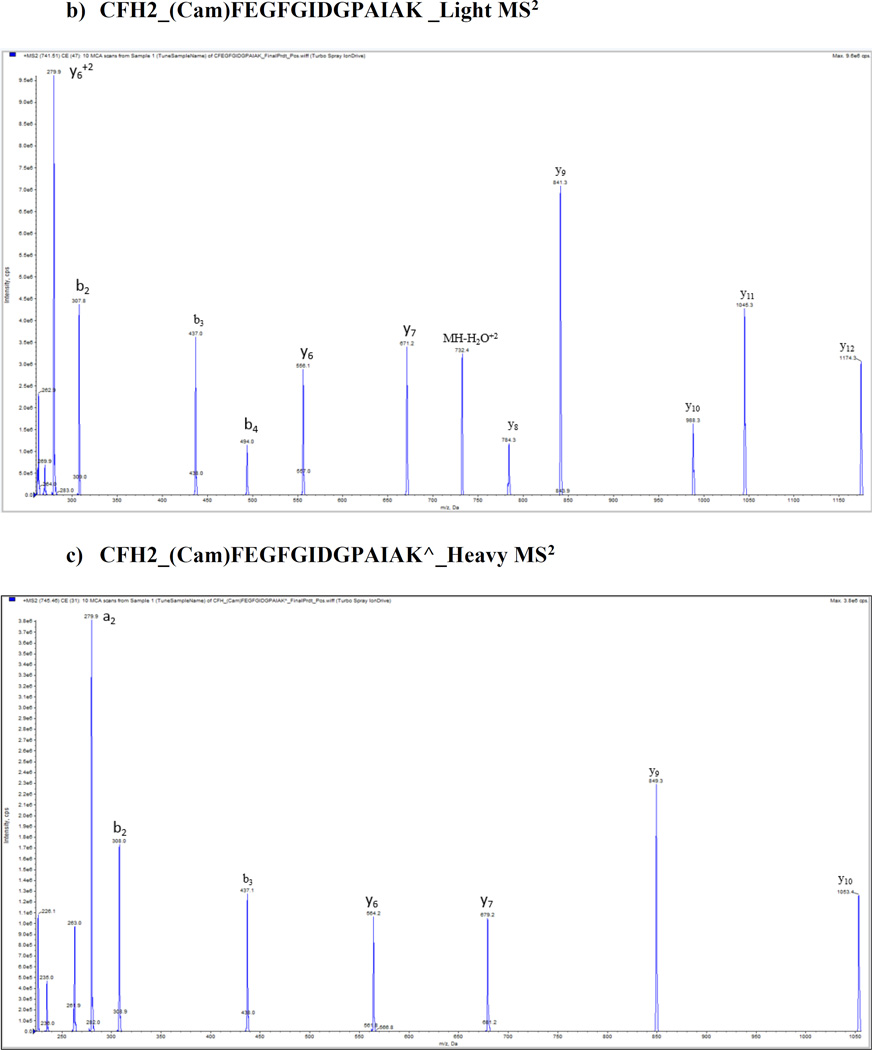
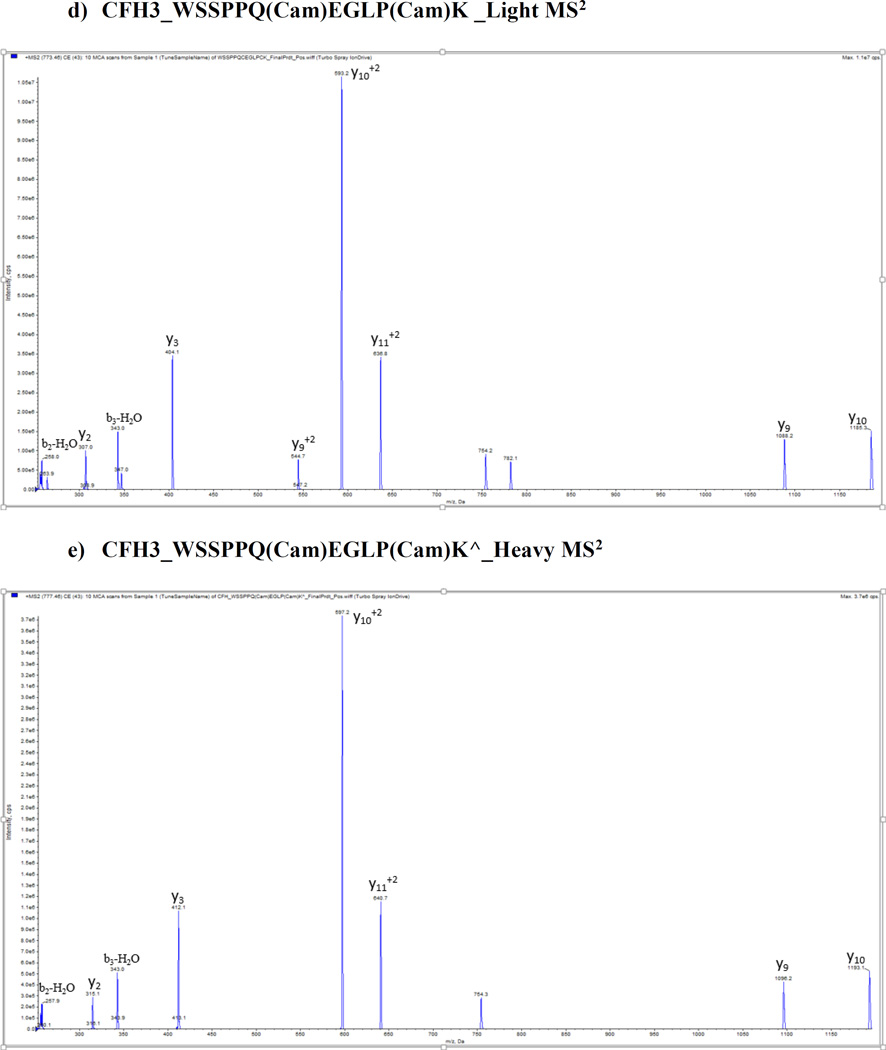
We optimized and validated all peptides in pure buffer of 0.1% formic acid and plasma matrix by using 5500 QTrap platform prior to the SRM assay, and no significant matrix effect was found for these peptides. Figure 1 shows the representative MS/MS spectra of CFH proteins with light and heavy peptides respectively: a) and d) CFH1_LSYTCEGGFR; b) and e) CFH2_CFEGFGIDGPAIAK; c) and f) CFH3_WSSPPQCEGLPCK. A full map of spectra is shown in Supporting Information Fig. 2. Mass spectrometry optimization was conducted with a continuous injection of individual peptide and internal standard at each of 100 fmol/µL by ramping the parameters DP (0–400 volts), CE (5–130 volts) and CXP (0–66 volts) from low to high with a step of 1 for all parameters and a fixed setting of 10 volts for entrance potential (EP). Supporting Information Fig. 3 shows representative optimization results of collision energy for quantifying CFH variants and CFHR proteins including (A) CFHR1_ISSVGGEATF(Cam)DFPK, (B) CFHR1_ISSVGGEATF(Cam)DFPK^ (C) CFHR2_STISAEK^ (D) CFHR3_LGYNANTSILSFQAV(Cam)R^ (E) CFHR4_YVT(Cam)SNGDWSEPPR^ (F) CFHR5_GWSTPPI(Cam)SFTK^ peptides.
Figure 1.
Representative MS/MS spectra from CFH proteins with light and heavy peptides respectively. a) and b) CFH1_LSYTCEGGFR; c) and d) CFH2_CFEGFGIDGPAIAK; e) and f) CFH3_WSSPPQCEGLPCK.
The targeted peptides were separated well by an optimized HPLC method with a high resolution in plasma. Figure 2 shows a representative total ion chromatographic separation of three CFH peptides, four SNP variants, and five CFHR1–5 proteins. For each peptide, the HPLC and MS parameters of SRM assay were optimized and transitions were selected to achieve the greatest sensitivity. HPLC optimization results showed a good gradient separation of peptides can be conducted in total time of 18 min with a linear increasing concentration of acetonitrile from 5% B to 36% B within12 min. Figure 3 shows the co-elution of heavy and natural peptides extracted-ion chromatogram (XIC). Three transitions of each peptide were found eluted exactly at the same time with the standard stable-isotope-labeled peptides respectively. We set up 36 peptides and 108 interference-free SRM transition ion pairs as the final SRM assay. Table 1 shows selected proteotypic peptide length, molecular weight, and charge status in SRM assay. Supporting Table 1 shows the full parameters to monitor peptides, including parent ion Q1 and fragment Q3, dwell time, declustering potential (DP), and peptide-specific tuned collision energy (CE), entrance potential (EP), and collision cell exit (CXP) voltages for each transition, and exact retention time (min).
Figure 2.
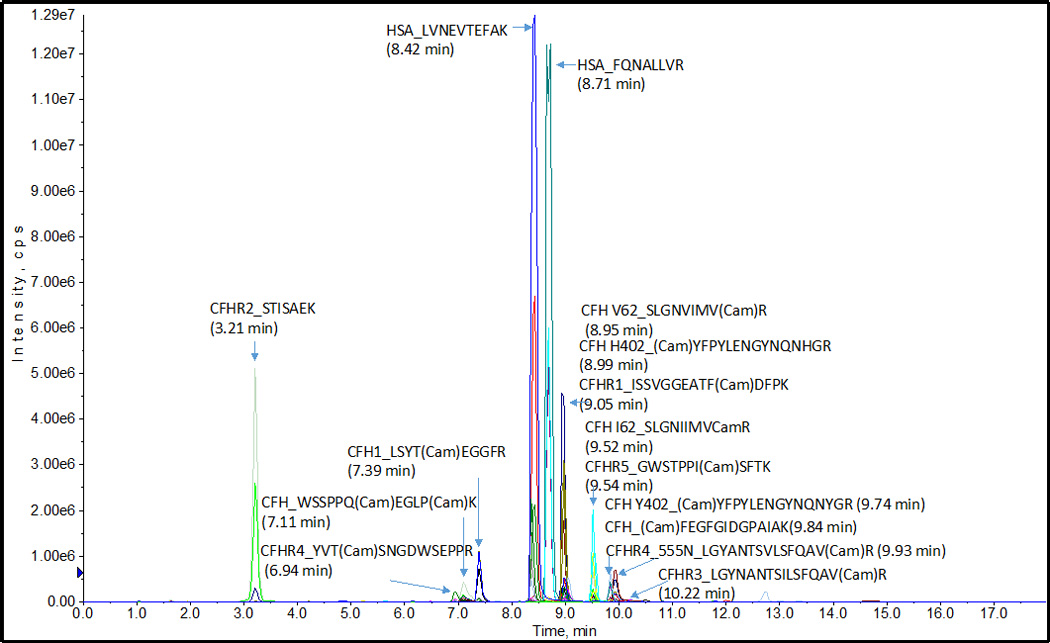
Representative total ion current chromatographic separation of CFH, SNP variants and CFHR1–5 proteins. HSA (human serum albumin) peptides used to monitor day-to-day variability of assay.
Figure 3.
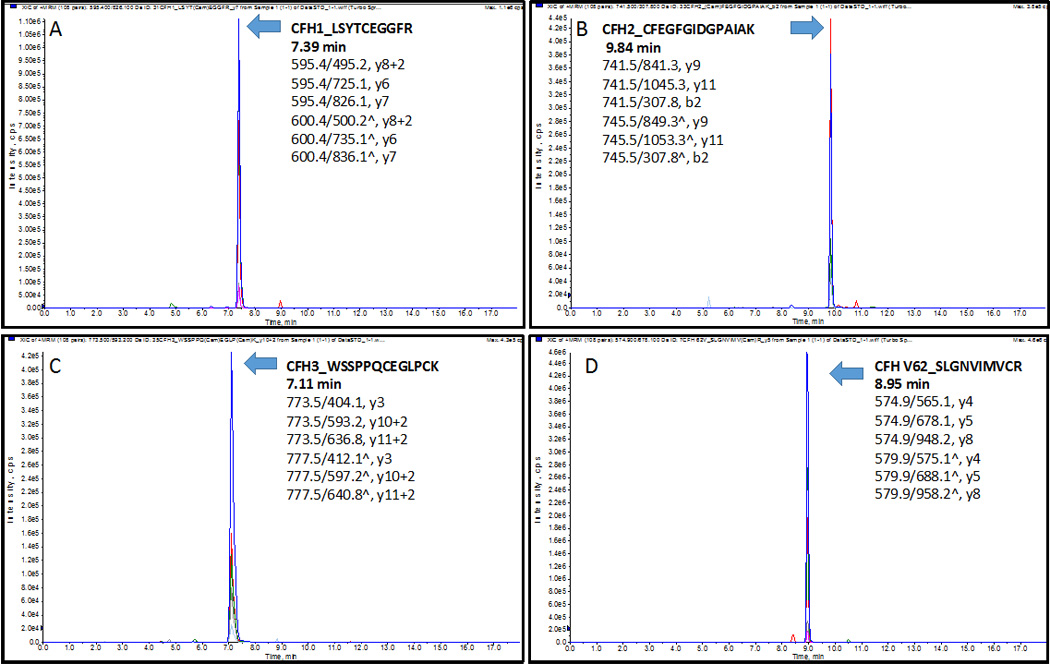
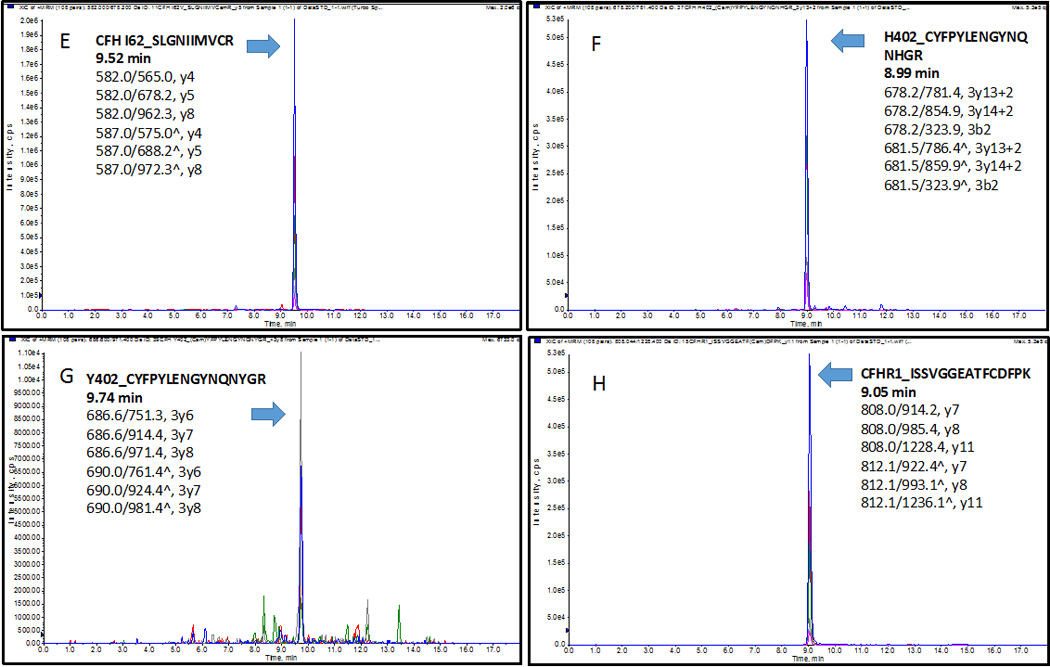
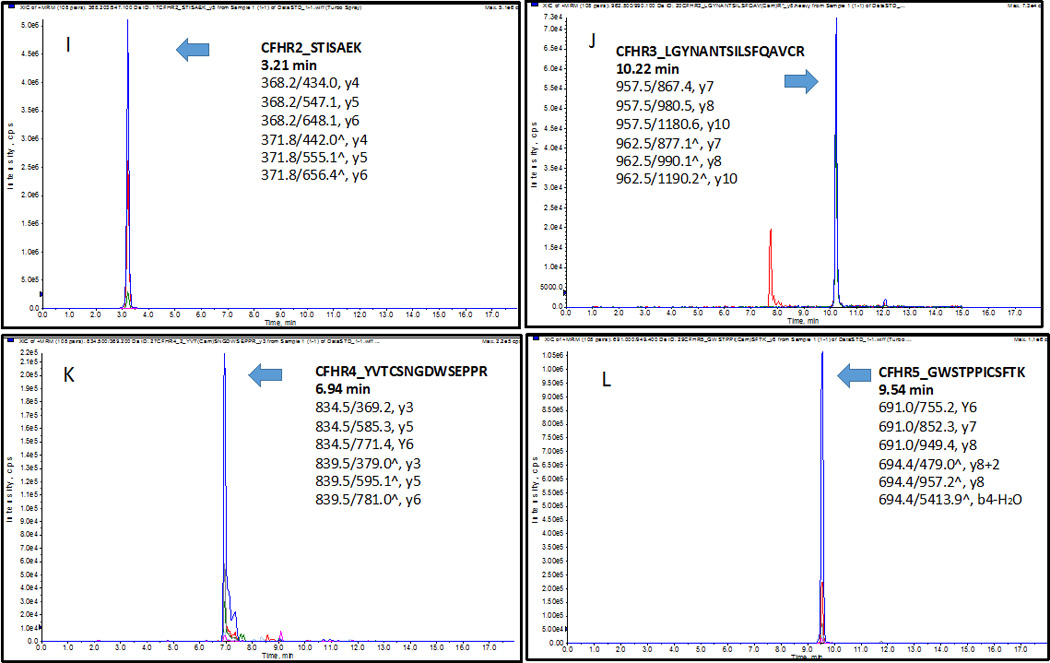
The extracted-ion chromatogram (XIC) of peptides (A) CFH1_LSYTCEGGFR at 7.39 min, (B) CFH2_CFEGFGIDGPAIAK at 9.84 min, (C) CFH3_WSSPPQCEGLPCK at 7.11min; four variants (D) V62_SLGNVIMVCR at 8.95 min, (E) I62_SLGNIIMVCR at 9.52 min, (F) H402_CYFPYLENGYNQNHGR at 8.99 min, (G) Y402_CYFPYLENGYNQNYGR at 9.74 min; (H) CFHR1_ISSVGGEATFCDFPK at 9.05 min, (I) CFHR2_STISAEK at 3.21 min, (J) CFHR3_LGYNANTSILSFQAVCR at 10.22 min, (K) CFHR4_YVTCSNGDWSEPPR at 6.94 min, n), and (L) CFHR5_GWSTPPICSFTK at 9.54 min. Three transitions of each peptide were found eluted exactly at the same time with the standard stable-isotope-labeled peptides respectively.
Finally, linearity was evaluated by titration curves of internal standards spikes in plasma. We generated calibration curves for each SRM transition, with 13-point of concentrations at 0.00, 0.24, 0.48, 0.98, 1.95, 3.91, 7.81, 15.62, 31.25, 62.50, 125.00, 250.00, and 500.00 fmol/µL running in triplicate. Most peptides showed good linearity over the 0.3–200 fmol/µL concentration range. Supporting Information Fig. 4 shows calibration curves of the target peptides at least three transitions, all with good linear range of R2 >0.99, and intra- or inter-coefficient of variation (CV) <10%.
Using a high-resolution SRM/MRM mass spectrometry method, we determined the lowest limit of detection (LLOD) and quantification (LLOQ) for each peptide. LLOQ was defined as the lowest detected concentration with CV ≤10% and signal-to-noise (S/N) ratio ≥10; the instrument LLOD was based on S/N >3 (Supporting Table 2).
Detection of another variant Y402 (fragment ion y7, LLOD=9.470) was found 8 times higher than the variant H402 (double charge ion of y13, LLOD=1.184). As the highest LLOQ, we spiked the highest amount of 125 fmol/µL of internal standard for accurate quantification of Y402. Among five CFHR proteins, CFHR1 of the peptide ISSVGGEATF(Cam)DFPK was found on an average ion reactions with the lowest values of LLOQ=2.116 and LLOD=0.641 fmol/µL. Digestion efficiency and intra- and inter-plate CVs are shown in Supporting Information Fig. 5 and Supporting Information Table 3, respectively.
To measure the protein concentration in plasma, we carried out protein denaturation, reduction, alkylation, and digestion from 344 participants as a pilot testing in the AGES-Reykjavik Study. Plasma concentrations of CFH variants and CFHR1–5 were measured using the SRM assay in 344 adults (Table 2).
Table 2.
Plasma concentrations of complement factor H variants and complement factor H-related proteins in 344 adults
| Protein & inferred genotype |
Sample (n) |
Age1 (years) |
Female (%) |
Concentration2 (µg/mL) |
|---|---|---|---|---|
| CFH YY402, II62 | 16 | 79.2 (4.8) | 68.8 | 170.1(31.4) |
| CFH YY402, VV62 | 51 | 80.2 (4.5) | 45.1 | 188.8 (38.5) |
| CFH YY402, IV62 | 56 | 79.0 (4.8) | 60.7 | 194.8 (36.8) |
| CFH HH402, VV62 | 56 | 79.9 (5.6) | 52.9 | 144.0 (37.0) |
| CFH HY402, IV62 | 65 | 79.5 (4.1) | 66.1 | 181.3 (44.7) |
| CFH HY402, VV62 | 100 | 80.1 (5.9) | 58.5 | 164.2 (42.3) |
| CFHR1 | 344 | 79.7 (5.1) | 56.9 | 1.63 (0.04) |
| CFHR2 | 344 | 79.7 (5.1) | 56.9 | 3.64 (1.20) |
| CFHR3 | 344 | 79.7 (5.1) | 56.9 | 0.020 (0.001) |
| CFHR4 | 344 | 79.7 (5.1) | 56.9 | 2.42 (0.18) |
| CFHR5 | 344 | 79.7 (5.1) | 56.9 | 5.49 (1.55) |
Mean (standard deviation)
Mean (standard error)
4 Discussion
We describe a new SRM assay for the quantification of CFH variants and CFHR1–5. To our knowledge, this study is the first SRM assay to allow measurement of these proteoform concentrations. A previous study used MALDI-TOF for detection of CFH variant but did not allow quantification [29]. The evaluation of plasma concentrations of relevant complement regulatory factors could provide insights that are not achievable from the study of genetic variants. It is reasonable to test the associations between plasma levels and the genetic variants themselves as well as determine if there is an independent association of the plasma levels of the proteins with AMD.
In this study, the mean CFH concentrations in human plasma are similar to concentration range in dried blood reported by Chambers and colleagues [30] as a SRM assay reported with IDVHLVPDR, y6+2, 76.0 µg/mL, SPDVINGSPISQK, b3, 81.0 µg/mL, SSNLIILEEHLK, y6, 93.7 µg/mL, and 116–562 µg/mL [31] by immunoassay, but different from the plasma value of 40 µg/mL [32] or concentration ranges 265–684 µg/mL [33] by immunoassay or 57 µg/mL by spectral counting [34], suggesting that a more accurate method like MS-based SRM is necessary for CFH measurements. Using variant-specific monoclonal antibodies, Hakobyan and colleagues reported mean values of CFH concentrations of 233 µg/mL in young adults, 269 µg/mL in elderly individuals [35], and 263 µg/mL [36] in different control populations. Compared with CFHR1–5 concentrations with the published literature by other methods like immunoassay, our low concentration values by SRM assay are different from the estimated plasma concentration of CFHR1 (~70–100 µg/mL), [37], CFHR2 (~50 µg/mL) [38], CFHR3 (~70–100 µg/mL) [39], CFHR4 (6–54 µg/mL) [40], and CFHR5 (3–6 µg/mL) [41]. The difference between the results of the present study using SRM and LC-MS/MS and previous studies using immunoassays might be due to the lack of specificity of antibodies in distinguishing highly similar homologues and sequence variants such as that found in CFH and CFHR proteins.
Future work will examine the relationship of plasma CFH Y402, H402, I62, and V62 variants and CFHR1 to CFHR5 with AMD in participants in the Age, Gene/Environment Susceptibility-Reykjavik (AGES-Reykjavik) Study. This work may determine whether systemic concentrations of CFH and CFHR proteins and specific variant levels play a role in AMD and represent a potential pathway for risk stratification and/or therapeutic intervention.
Supplementary Material
Acknowledgments
This work was supported by the National Institutes of Health grants R01 EY024596, R01 AG027012, R56 AG052973, the Intramural Research Program of the National Institute on Aging, the Joint King Khaled Eye Specialist Hospital and Wilmer Eye Institute Research Grant Program, the Edward N. & Della L. Thome Memorial Foundation, and Research to Prevent Blindness. The AGES Reykjavik study was supported by National Institutes of Health (contracts N01-AG-12100 and HHSN271201200022C); the National Institute on Aging Intramural Research Program; Hjartavernd (the Icelandic Heart Association); the Althingi (the Icelandic Parliament).
Footnotes
The authors declare no conflicts of interest.
References
- 1.Jager RD, Meiler WF, Miller JW. Age-related macular degeneration. N. Engl. J. Med. 2008;358:2606–2617. doi: 10.1056/NEJMra0801537. [DOI] [PubMed] [Google Scholar]
- 2.Klein RJ, Zeiss C, Chew EY, Tsai JY, et al. Complement factor H polymorphism in age-related macular degeneration. Science. 2005;308:385–389. doi: 10.1126/science.1109557. [DOI] [PMC free article] [PubMed] [Google Scholar]
- 3.Haines JL, Hauser MA, Schmidt S, Scott WK, et al. Complement factor H variant increases the risk of age-related macular degeneration. Science. 2005;308:419–421. doi: 10.1126/science.1110359. [DOI] [PubMed] [Google Scholar]
- 4.Edwards AO, Ritter R, III, Abel KJ, Manning A, et al. Complement factor H polymorphism and age-related macular degeneration. Science. 2005;308:421–424. doi: 10.1126/science.1110189. [DOI] [PubMed] [Google Scholar]
- 5.Hageman GS, Anderson DH, Johnson LV, Hancox LS, et al. A common haplotype in the complement regulatory gene factor H (HF1/CFH) predisposes individuals to age-related macular degeneration. Proc. Natl. Acad. Sci. U. S. A. 2005;102:7227–7232. doi: 10.1073/pnas.0501536102. [DOI] [PMC free article] [PubMed] [Google Scholar]
- 6.Ricklin D, Lambris JD. Complement in immune and inflammatory disorders: pathophysiological mechanisms. J. Immunol. 2013;190:3831–3838. doi: 10.4049/jimmunol.1203487. [DOI] [PMC free article] [PubMed] [Google Scholar]
- 7.Hughes AE, Orr N, Esfandiary H, Diaz-Torres M, et al. A common CFH haplotype, with deletion of CFHR1 and CFHR3, is associated with lower risk of age-related macular degeneration. Nat. Genet. 2006;38:1173–1177. doi: 10.1038/ng1890. [DOI] [PubMed] [Google Scholar]
- 8.Hageman GS, Hancox LS, Taiber AJ, Gehrs KM, et al. Extended haplotypes in the complement factor H (CFH) and CFH-related (CFHR) family of genes that protect against age-related macular degeneration: identification, ethnic distribution and evolutionary implications. Ann. Med. 2006;38:592–604. [PMC free article] [PubMed] [Google Scholar]
- 9.Fritsche LG, Lauer N, Hartmann A, Stippa S, et al. An imbalance of human complement regulatory proteins CFHR1, CFHR3 and factor H influences risk for age-related macular degeneration (AMD) Hum. Mol. Genet. 2010;19:4694–4704. doi: 10.1093/hmg/ddq399. [DOI] [PubMed] [Google Scholar]
- 10.Zhang H, Morrison MA, DeWan A, Adams S, et al. The NEI/NCBI dbGAP database: genotypes and haplotypes that may specifically predispose to risk of neovascular age-related macular degeneration. BMC Med. Genet. 2008;9:51. doi: 10.1186/1471-2350-9-51. [DOI] [PMC free article] [PubMed] [Google Scholar]
- 11.Perlee LT, Bansal AT, Gehrs K, Heier JS, et al. Inclusion of genotype with fundus phenotype improves accuracy of predicting choroidal neovascularization and geographic atrophy. Ophthalmology. 2013;120:1880–1892. doi: 10.1016/j.ophtha.2013.02.007. [DOI] [PMC free article] [PubMed] [Google Scholar]
- 12.Weismann D, Hartvigsen K, Lauer N, Bennett KL, et al. Complement factor H binds malondialdehyde epitopes and protects from oxidative stress. Nature. 2011;478:76–81. doi: 10.1038/nature10449. [DOI] [PMC free article] [PubMed] [Google Scholar]
- 13.Herbert AP, Deakin JA, Schmidt CQ, Blaum BS, et al. Structure shows that a glycosaminoglycan and protein recognition site in factor H is perturbed by age-related macular degeneration-linked single nucleotide polymorphism. J. Biol. Chem. 2007;282:18960–18968. doi: 10.1074/jbc.M609636200. [DOI] [PubMed] [Google Scholar]
- 14.Prosser BE, Johnson S, Roversi P, Herbert AP, et al. Structural basis for complement factor H-linked age-related macular degeneration. J. Exp. Med. 2007;204:2277–2283. doi: 10.1084/jem.20071069. [DOI] [PMC free article] [PubMed] [Google Scholar]
- 15.Clark SJ, Higman VA, Mulloy B, Perkins SJ, et al. His-384 allotypic variant of factor H associated with age-related macular degeneration has different heparin binding properties from the non-disease-associated form. J. Biol. Chem. 2006;34:24713–24720. doi: 10.1074/jbc.M605083200. [DOI] [PubMed] [Google Scholar]
- 16.Lauer N, Mihlan M, Hartmann A, Schlötzer-Schrehardt U, et al. Complement regulation at necrotic cell lesions is impaired by the age-related macular degeneration-associated factor-H His402 variant. J. Immunol. 2011;187:4374–4383. doi: 10.4049/jimmunol.1002488. [DOI] [PubMed] [Google Scholar]
- 17.Clark SJ, Perveen R, Hakobyan S, Morgan BP, et al. Impaired binding of the age-related macular degeneration-associated complement factor H 402H allotype to Bruch’s membrane in human retina. J. Biol. Chem. 2010;285:30192–30202. doi: 10.1074/jbc.M110.103986. [DOI] [PMC free article] [PubMed] [Google Scholar]
- 18.Hocking HG, Herbert AP, Kavanagh D, Soares DC, et al. Structure of the N-terminal region of complement factor H and conformational implications of disease-linked sequence variations. J. Biol. Chem. 2008;283:9475–9487. doi: 10.1074/jbc.M709587200. [DOI] [PMC free article] [PubMed] [Google Scholar]
- 19.Tortajada A, Montes T, Martínez-Barricarte R, Morgan BP, et al. The disease-protective complement factor H allotypic variants Ile62 shows increased binding affinity for C3b and enhanced cofactor activity. Hum. Mol. Genet. 2009;18:3452–3461. doi: 10.1093/hmg/ddp289. [DOI] [PMC free article] [PubMed] [Google Scholar]
- 20.Pechtl IC, Kavanagh D, Mcintosh N, Harris CL, et al. Disease-associated N-terminal complement factor H mutations perturb cofactor and decay-accelerating activities. J. Biol. Chem. 2011;286:11082–11090. doi: 10.1074/jbc.M110.211839. [DOI] [PMC free article] [PubMed] [Google Scholar]
- 21.Anderson DH, Mullins RF, Hageman GS, Johnson LV. A role for local inflammation in the formation of drusen in the eye. Am. J. Ophthalmol. 2002;134:411–431. doi: 10.1016/s0002-9394(02)01624-0. [DOI] [PubMed] [Google Scholar]
- 22.Bhutto IA, Baba T, Merges C, Juriasinghani V, et al. C-reactive protein and complement factor H in aged human eyes and eyes with age-related macular degeneration. Br. J. Ophthalmol. 2011;95:1323–1330. doi: 10.1136/bjo.2010.199216. [DOI] [PMC free article] [PubMed] [Google Scholar]
- 23.Kuzyk MA, Parker CE, Domanski D, Borchers CH. Development of MRM-based assays for the absolute quantitation of plasma proteins. Methods Mol. Biol. 2013;1023:53–82. doi: 10.1007/978-1-4614-7209-4_4. [DOI] [PubMed] [Google Scholar]
- 24.Harris TB, Launer LJ, Eiriksdottir G, Kjartansson O, Jonsson PV, Sigurdsson G, Thorgeirsson G, Aspelund T, Garcia ME, Cotch MF, Hoffman HJ, Gudnason V. Age, Gene/Environment Susceptibility-Reykjavik Study: multidisciplinary applied phenomics. Am. J. Epidemiol. 2007;165:1076–1087. doi: 10.1093/aje/kwk115. [DOI] [PMC free article] [PubMed] [Google Scholar]
- 25.Clough T, Thaminy S, Ragg S, Aebersold R, Vitek O. Statistical protein quantification and significance analysis in label-free LC-MS experiments with complex designs. BMC Bioinformatics. 2012;13(Suppl 16):S6. doi: 10.1186/1471-2105-13-S16-S6. [DOI] [PMC free article] [PubMed] [Google Scholar]
- 26.McCulloch CE, Searle SR. Neuhaus. Generalized, linear, and mixed models. New York: Wiley; 2008. [Google Scholar]
- 27.Ihaka R, Gentleman RR. A language for data analysis and graphics. J. Comput. Graph. Stat. 1996;5:299–314. [Google Scholar]
- 28.Bate D, Machler M, Bolker B. Fitting linear mixed-effects models using lme4. J. Stat. Software. 2015;67:1–48. [Google Scholar]
- 29.Kelly U, Yu L, Kumar P, Ding JD, Jiang H, Hageman GS, Arshavsky VY, Frank MM, Hauser MA, Rickman CB. Heparan sulfate, including that in Bruch's membrane, inhibits the complement alternative pathway: implications for age-related macular degeneration. J. Immunol. 2010;185:5486–5494. doi: 10.4049/jimmunol.0903596. [DOI] [PMC free article] [PubMed] [Google Scholar]
- 30.Chambers AG, Percy AJ, Yang J, Borchers CH. Multiple reaction monitoring enables precise quantification of 97 proteins in dried blood spots. Mol. Cell Proteomics. 2015;14:3094–3104. doi: 10.1074/mcp.O115.049957. [DOI] [PMC free article] [PubMed] [Google Scholar]
- 31.Esparza-Gordillo J, Soria JM, Buil A, Almasy L, Blangero J, Fontcuberta J, Rodríguez de Córdoba S. Genetic and environmental factors influencing the human factor H plasma levels. Immunogenetics. 2004;56:77–82. doi: 10.1007/s00251-004-0660-7. [DOI] [PubMed] [Google Scholar]
- 32.Timmann C, Leippe M, Horstmann RD. Two major serum components antigenically related to complement factor H are different glycosylation forms of a single protein with no factor H-like complement regulatory functions. J. Immunol. 1991;146:1265–1270. [PubMed] [Google Scholar]
- 33.de Paula PF, Barbosa JE, Junior PR, Ferriani VP, Latorre MR, Nudelman V, Isaac L. Ontogeny of complement regulatory proteins - concentrations of factor H, factor I, C4b-binding protein, properdin and vitronectin in healthy children of different ages and in adults. Scand. J. Immunol. 2003;58:572–577. doi: 10.1046/j.1365-3083.2003.01326.x. [DOI] [PubMed] [Google Scholar]
- 34.Farrah T, Deutsch EW, Omenn GS, Campbell DS, Sun Z, Bletz JA, Mallick P, Katz JE, Malmström J, Ossola R, Watts JD, Lin B, Zhang H, Moritz RL, Aebersold R. A high-confidence human plasma proteome reference set with estimated concentrations in PeptideAtlas. Mol. Cell Proteomics. 2011;10:M110.006353. doi: 10.1074/mcp.M110.006353. [DOI] [PMC free article] [PubMed] [Google Scholar]
- 35.Hakobyan S, Harris CL, Tortajada A, Goicochea de Jorge E, García-Layana A, Fernández-Robredo P, Rodríguez de Córdoba S, Morgan BP. Measurement of factor H variants in plasma using variant-specific monoclonal antibodies: Application to assessing risk of age-related macular degeneration. Invest. Ophthalmol. Vis. Sci. 2008;49:1983–1990. doi: 10.1167/iovs.07-1523. [DOI] [PubMed] [Google Scholar]
- 36.Hakobyan S, Tortajada A, Harris CL, Rodríguez de Córdoba S, Morgan BP. Variant-specific quantification of factor H in plasma identifies null alleles associated with atypical hemolytic uremic syndrome. Kidney Int. 2010;78:782–788. doi: 10.1038/ki.2010.275. [DOI] [PMC free article] [PubMed] [Google Scholar]
- 37.Heinen S, Hartmann A, Lauer N, Wiehl U, Dahse HM, Schirmer S, Gropp K, Enghardt T, Wallich R, Hälbich S, Mihlan M, Schlötzer-Schrehardt U, Zipfel PF, Skerka C. Factor H-related protein 1 (CFHR-1) inhibits complement C5 convertase activity and terminal complex formation. Blood. 2009;114:2439–2447. doi: 10.1182/blood-2009-02-205641. [DOI] [PubMed] [Google Scholar]
- 38.Skerka C, Chen Q, Fremeaux-Bacchi V, Roumenina LT. Complement factor H related proteins (CFHRs) Mol. Immunol. 2013;56:170–180. doi: 10.1016/j.molimm.2013.06.001. [DOI] [PubMed] [Google Scholar]
- 39.Fritsche LG, Lauer N, Hartmann A, Stippa S, Keilhauer CN, Oppermann M, Pandey MK, Köhl J, Zipfel PF, Weber BH, Skerka C. An imbalance of human complement regulatory proteins CFHR1, CFHR3 and factor H influences risk for age-related macular degeneration (AMD) Hum. Mol. Genet. 2010;19:4694–4704. doi: 10.1093/hmg/ddq399. [DOI] [PubMed] [Google Scholar]
- 40.Hebecker M, Józsi M. Factor H-related protein 4 activates complement by serving as a platform for the assembly of alternative pathway C3 convertase via its interaction with C3b protein. J. Biol Chem. 2012;287:19528–19536. doi: 10.1074/jbc.M112.364471. [DOI] [PMC free article] [PubMed] [Google Scholar]
- 41.McRae JL, Duthy TG, Griggs KM, Ormsby RJ, Cowan PJ, Cromer BA, McKinstry WJ, Parker MW, Murphy BF, Gordon DL. Human factor H-related protein 5 has cofactor activity, inhibits C3 convertase activity, binds heparin and C-reactive protein, and associates with lipoprotein. J. Immunol. 2005;174:6250–6256. doi: 10.4049/jimmunol.174.10.6250. [DOI] [PubMed] [Google Scholar]
Associated Data
This section collects any data citations, data availability statements, or supplementary materials included in this article.


