

Abstract
The onset of type 2 diabetes is characterized by transition from successful to failed insulin secretory compensation to obesity-related insulin resistance and dysmetabolism. Energy-rich diets in rodents are commonly studied models of compensatory increases in both insulin secretion and β cell mass. However, the mechanisms of these adaptive responses are incompletely understood, and it is also unclear why these responses eventually fail. We measured the temporal trends of glucose homeostasis, insulin secretion, β cell morphometry, and islet gene expression in C57BL/6NTac mice fed a 60% high-fat diet (HFD) or control diet for up to 16 weeks. A 2-fold increased hyperinsulinemia was maintained for the first 4 weeks of HFD feeding and then further increased through 16 weeks. β cell mass increased progressively starting at 4 weeks, principally through nonproliferative growth. Insulin sensitivity was not significantly perturbed until 11 weeks of HFD feeding. Over the first 8 weeks, we observed two distinct waves of increased expression of β cell functional and prodifferentiation genes. This was followed by activation of the unfolded protein response at 8 weeks and overt β cell endoplasmic reticulum stress at 12–16 weeks. In summary, β cell adaptation to an HFD in C57BL/6NTac mice entails early insulin hypersecretion and a robust growth phase along with hyperexpression of related genes that begin well before the onset of observed insulin resistance. However, continued HFD exposure results in cessation of gene hyperexpression, β cell functional failure, and endoplasmic reticulum stress. These data point to a complex but not sustainable integration of β cell-adaptive responses to nutrient overabundance, obesity development, and insulin resistance.
Keywords: β cell, gene expression, insulin secretion, peroxisome proliferator–activated receptor (PPAR), unfolded protein response (UPR), adaptation, high-fat diet
Introduction
Type 2 diabetes (T2D) 2 is a complex metabolic disorder that is characterized by progressive deterioration of glucose homeostasis, in part because of loss of pancreatic β cell mass (BCM) and function (1–4). The islet β cell is central to maintenance of glucose homeostasis through secretion of insulin. Numerous studies in animals have shown a substantial capacity for a compensatory expansion of BCM and function in response to physiological and pathophysiological changes in insulin demands, in particular obesity-associated insulin resistance (3, 4). Multiple factors have been identified that regulate the β cell growth response: glycolytic flux through glucokinase (5), mild ER stress (6), autophagy (7), and exogenous factors such as neural (8) and humoral signals originating in the liver (9). Although the contributions of existing β cell hyperplasia versus neogenesis from pancreatic epithelial precursors, survival versus apoptotic death, and hypertrophy are not fully resolved, abundant evidence supports β cell hyperproliferation as the principal mechanism of postnatal β cell growth and mass maintenance in mice (10–12). In contrast, the loss of functional BCM under glucolipotoxic conditions is largely attributed to dedifferentiation or apoptosis secondary to ER and oxidative stress, amyloid deposition, or inflammation (3, 4, 13). Of particular importance is that there is a prolonged period of normal glucose tolerance during progressive insulin resistance before the onset of overt T2D (3); however, the molecular mechanisms that account for the transition from normoglycemia to overt hyperglycemia remain poorly defined (14).
We previously characterized the sequence of events for β cell adaptation following a 60% pancreatectomy (Px) in normoglycemic rodents (15–17). We identified phases of β cell compensation that involved early hyperproliferation followed by activation of the Irs2-PI3K-Akt-FoxO1 pathway along with up-regulation of PPARγ and its β cell gene targets Pdx1, pyruvate carboxylase (PC), and GIP receptor (Gipr) (18–20). We subsequently showed transcriptional regulation of PPARγ by FoxO1 in β cells (20), suggesting that the Irs2-PI3K-Akt-FoxO1-PPARγ pathway functions as a central regulatory mechanism of β cell adaptation in response to Px.
The aim of this study was to define the timing and nature of key molecular and physiological events that underlie β cell compensation in a rodent model of diet-induced obesity and insulin resistance and to identify mechanisms associated with β cell transition from functional compensation to failure. Studies of diet-induced obesity models have revealed considerable variation between and within mouse strains in their propensity to develop obesity, insulin resistance, and hyperglycemia (21–23). Here we have characterized the temporal profile of β cell function, mass, and expression of key genes, along with in vivo glucose homeostasis and insulin sensitivity, in the C57BL/6NTac (B6N) mouse substrain of obesity-susceptible C57BL/6 mice fed a 60% high fat–enriched diet for 16 weeks. Our study highlights the extensive repertoire of β cell compensation responses to this diet, with early increases in insulin secretion and BCM coupled with hyperexpression of profunction, prodifferentiation, and protective UPR genes, that precede overt whole-body insulin resistance by several weeks. In contrast, continued exposure to the HFD resulted in transition to reduced expression of these genes along with β cell functional exhaustion and onset of uncompensated ER stress.
Results
General characteristics of HFD in B6N mice
Body mass was increased after 1 week of the HFD and continued to progressively increase to 50% above the chow-fed control mice by 16 weeks (Fig. 1A). Also within the first week, mild fed hyperglycemia (122 ± 7 mg/dl versus 96 ± 6 mg/dl, p < 0.05) was present in the HFD mice and continued at ∼25 mg/dl above controls through 16 weeks (Fig. 1B). Likewise, hyperinsulinemia developed within the first week of the HFD (0.55 ± 0.07 ng/ml versus 0.23 ± 0.03 ng/ml, p < 0.05) and increased to 4-fold at 9 weeks and 8-fold by 16 weeks over control mice (Fig. 1C). No differences in plasma triglycerides were detected between the groups at 8, 12, and 16 weeks (data not shown).
Figure 1.
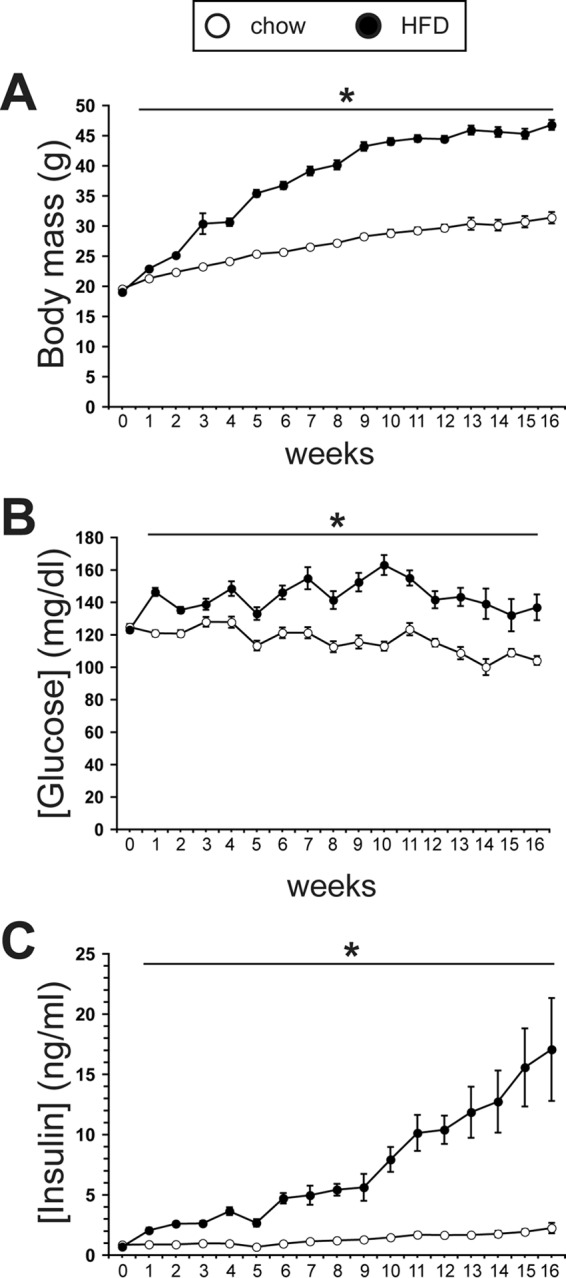
A chronic HFD leads to progressive hyperinsulinemia and weight gain, but mild hyperglycemia is maintained. A, body mass measured weekly through 16 weeks in chow-fed and HFD-fed mice (n ≥ 14/group). B, weekly morning nonfasting blood glucose concentrations in chow-fed and HFD-fed mice through 16 weeks (n ≥ 14/group). C, weekly morning nonfasting plasma insulin concentrations in chow-fed and HFD-fed mice through 16 weeks (n ≥ 8/group). *, p < 0.05.
Early and progressive impairment of glucose tolerance in HFD-fed mice
HFD-fed mice exhibited a gradual reduction in glucose tolerance starting within the first week of feeding (Fig. 2A). The corresponding insulin secretion profiles revealed a progressively exaggerated glucose-induced secretory response along with fasting hyperinsulinemia in the HFD mice (Fig. 2B). Whole-body insulin sensitivity was examined using ITT. At 4 and 8 weeks, the insulin-induced hypoglycemic response of HFD-fed mice remained intact; it was not until 11 weeks that insulin resistance was detectable in these mice (Fig. 3).
Figure 2.

Progressive glucose intolerance in HFD mice. A, i.p. GTT (2 g/kg) results for chow-fed and HFD-fed mice at multiple time points through 16 weeks of the respective diets. B, the corresponding insulin secretion curves for the i.p. GTT results. The ratios of the area under the curve (AUC) calculations for HFD versus control diet mice are indicated. (n ≥ 5/group). *, p < 0.01; **, p < 0.05.
Figure 3.
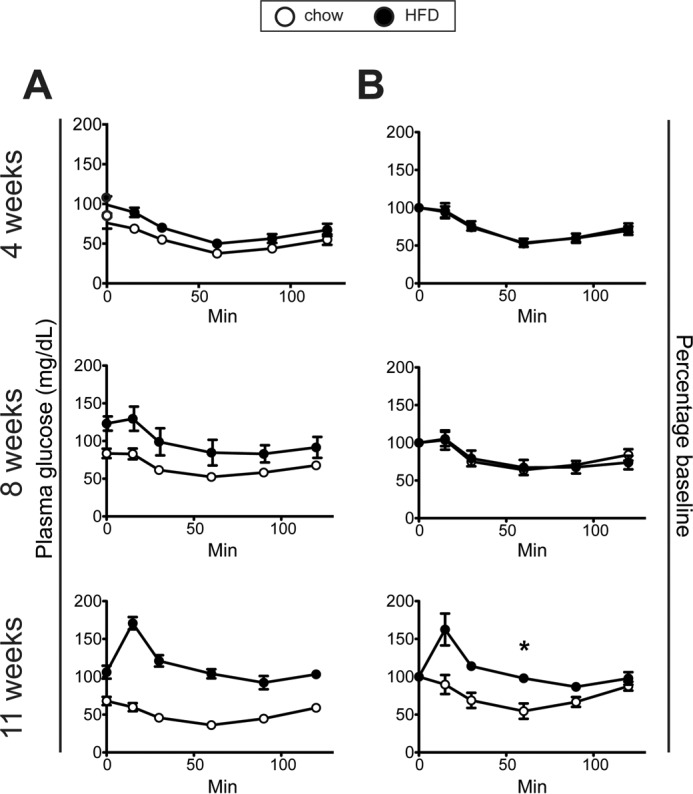
Insulin sensitivity assessed with ITT in chow-fed and HFD-fed mice. A and B, ITT (0.75 units/kg) plasma glucose values (A) and glucose values (B) expressed as percentages of the time 0 value after 4, 8, and 11 weeks of HFD and chow diet. (n ≥ 7/group). *, p = 0.05.
Transition from enhanced to impaired insulin secretion in HFD-fed mice
To further assess β cell function in HFD-fed mice, we compared isolated islet insulin secretion in the presence of low (2.8 mm) and high (16.7 mm) glucose with or without the incretins GLP-1 and GIP between chow-fed and HFD-fed mice at 2 and 16 weeks. At 2 weeks, islets from HFD-fed mice displayed nearly doubled insulin secretory responses to high glucose (16.7 mm), and to GLP-1 and GIP supplementation (Fig. 4A). In contrast, after 16 weeks of HFD, high glucose and GIP-augmented insulin secretion were both markedly reduced compared with islets from chow-fed mice; GLP-1–potentiated insulin secretion remained intact but was no longer exaggerated (Fig. 4B).
Figure 4.
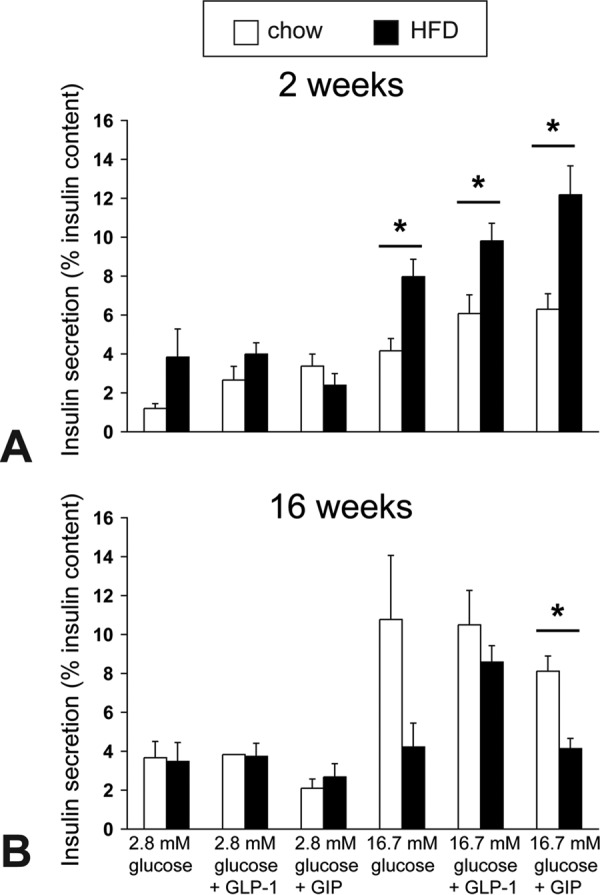
Isolated islet in vitro insulin responses to high glucose and incretin hormones in chow-fed and HFD-fed mice. A and B, glucose-stimulated insulin secretion was measured with or without GLP1 and GIP peptides in the presence of low or high glucose from triplicates of 15 equal-size islets from chow-fed control or HFD-fed mice (n = 3). The graph shows the mean ± S.E. of insulin released to 2.8 mmol/liter or 16.7 mmol/liter glucose with or without 10 nmol/liter GLP-1 or GIP peptide in three separate experiments expressed as percent insulin content after 2 weeks (A) and 16 weeks (B) of HFD or chow diet. *, p < 0.05.
BCM and islet number dynamics in response to HFD
We compared BCM and its contributing parameters. BCM was increased 50% by 4 weeks of HFD feeding, almost doubled by 8 weeks, was 2.5-fold increased at 10 weeks, and then leveled off (Fig. 5A). Unexpectedly, β cell proliferation assessed by Ki-67 immunostaining was only transiently increased (>4-fold) in HFD-fed mice at 10 weeks (Fig. 5B). The lack of β cell hyperproliferation at earlier time points was corroborated by proliferating cell nuclear antigen immunostaining (data not shown). To ensure that we had not missed a β cell proliferation burst during the first week of the HFD, we analyzed mice after 2 and 3 days of HFD feeding; there were no significant differences in proliferation between the groups (data not shown). Thus, we found virtually no role for β cell hyperproliferation in BCM growth response to the HFD in B6NTac mice. Furthermore, only modest increases in β cell size were noted at the later time points, when most of the BCM accrual was established (Fig. 5C). As expected, TUNEL staining yielded staining frequencies that were too low for comparison of apoptosis between the groups.
Figure 5.

Effects of a chronic HFD on β cell mass and related morphometrics. A, BCM measured at multiple time points in HFD- and chow-fed mice. B, β cell proliferation assessed by quantification of the percentage of β cells positive for Ki-67 immunostaining at multiple time points in HFD- and chow-fed mice. C, individual β cell size assessed by planimetry at multiple time points in HFD- and chow-fed mice. D, dynamic changes in islet size populations at multiple time points in HFD- and chow-fed mice. (n ≥ 6/group). *, p < 0.05.
We examined how the HFD affected relative islet size and numbers (Fig. 5D). At 2 weeks, there was a modest increase in the number of small islets in the HFD group. By 4 weeks, coinciding with the first identified BCM increase, the prevalence of the largest islet size population was doubled in the HFD group. Thereafter, the number of small and largest islets was increased through 12 weeks, but these differences were no longer present at 16 weeks, correlating with cessation of the BCM growth response at the later time points.
Dynamic changes in islet gene expression over 16 weeks
We performed islet quantitative PCR analyses of key β cell profunction and prosurvival genes, major transcription factors, and metabolic stress–related genes at multiple time points to gain insight into the molecular mechanisms that regulate the adaptive and maladaptive β cell responses to the HFD (Fig. 6, A and B). Within the first week, corresponding with the onset of mild hyperglycemia and glucose intolerance, the HFD-fed mice islet expression profile showed modest down-regulation of several profunction genes (MafA, 0.35-fold; PC, 0.55-fold; Gipr, 0.7-fold). In contrast, by the second and third weeks, the pattern switched to a surge in expression of several genes: restored MafA expression and increased expression of the genes encoding the glucose sensors Glut2 and Gck, the mitochondrial anaplerotic enzyme PC, the incretin receptor Gipr, and the transcription factors Pparγ and Pdx1. It is notable that Gipr, Pdx1, Glut2, PC, and Gck are established targets of Pparγ-mediated transcriptional regulation (19, 20, 24–26).
Figure 6.

Profiles of islet gene expression in HFD- and chow-fed mice. The results show -fold expression (quantitative PCR) of mRNA expression of islets from HFD mice (n = 4) compared with islets from chow-fed mice (n = 4) at selected time points through 16 weeks of the respective diets. Green rectangles indicate significantly increased expression, whereas red rectangles show significantly reduced expression in HFD-fed mice relative to chow-fed control mice (p < 0.05). A, selected β cell functional genes. B, selected β cell transcription factors. C, selected UPR and stress-related genes.
As stated above, we found that the onset of the BCM increase was at the fourth week of HFD. This time point corresponded with hyperexpression of the prodevelopment transcription factors MafA, Nkx6.1, and NeuroD. By the eighth week of HFD, there were a second surge of Pparγ expression and its target genes (Gipr, Pdx1, Glut2, PC, and Gck) and sustained hyperexpression of MafA and NeuroD that correlated with progressive increases in hyperinsulinemia and BCM accrual. This period was also characterized by the onset of UPR activation, as demonstrated by a 2-fold increase in BiP/Grp78 expression without significant changes in expression of the downstream UPR markers (Fig. 6C).
At week 12, in the presence of profound insulin resistance and ∼10-fold higher (fed) plasma insulin, a substantial, >3.0-fold enhancement of PC expression was present, along with a sustained increase in Pparγ expression (Fig. 6B). On the other hand, significant reductions in islet MafA, NeuroD, Gck, and Hif1a expression levels were found at this time point. Among UPR-associated genes, a 1.9-fold increase in Chop (Ddit3) and a 6-fold increase in Xbp1-spliced were observed. We also examined expression of major calcium-binding ER chaperones involved in the UPR. At both 12 and 16 weeks, calreticulin and related calnexin mRNA levels were significantly up-regulated in the HFD mice (Fig. 7A). This was corroborated at the protein level by immunoblot (Fig. 7B) and by immunofluorescence imaging, which showed increased β cell calreticulin immunoreactivity in the HFD mice above the age- and diet-matched control mice (Fig. 7C). At 16 weeks, there were now significant reductions in the expression of β cell profunction genes (Gck, Glut2, PC, Irs1, Irs2, Gipr, and Glp-1r) and transcription factors (MafA, Pdx1, Nkx6.1, Ppar, NeuroD). Also at this time point was increased islet expression of the ER chaperone protein BiP (4.5-fold) and the ER stress markers Xbp1-spliced (1.59-fold) and Chop (2.64-fold) (Fig. 6C).
Figure 7.

Relative expression of β cell ER calcium-binding chaperone proteins in HFD- and chow-fed mice. A, RT-PCR analysis of calreticulin and calnexin in islets after 12 and 16 weeks of HFD or chow diet. #, calreticulin mRNA expression levels at 16-weeks compared to 12-weeks with a statistical significance of p < 0.005; *, p < 0.05. B, representative immunoblots from islet extracts from two mice assessed for calreticulin protein after 16 weeks of HFD or chow diet. con, control. *, mRNA expression levels of calreticulin and calnexin in HFD fed compared to chow fed mice with a statistical significance of p < 0.005. C, representative confocal fields showing islet calreticulin immunoreactivity (red) and corresponding fields immunomarked for insulin (green) after 12 and 16 weeks of HFD or chow diet. Imaging conditions were identical for each panel. Scale bar = 50 μm.
Ultrastructural evidence for islet ER stress at 16 weeks of HFD
To further investigate the gene expression profile that suggested islet ER stress, we performed a transmission electron microscopy comparison of pancreas sections from 16-week HFD-fed and control mice. The control mice exhibited abundant insulin granules in their β cells, with well-defined mitochondria (Fig. 8, A and C). In contrast, β cells of HFD-fed mice generally displayed fewer insulin granules, grossly dilated ER cisternae, and degenerating mitochondria (Fig. 8, B and D) that are typical morphological features of ER stress and β cell exhaustion (27).
Figure 8.
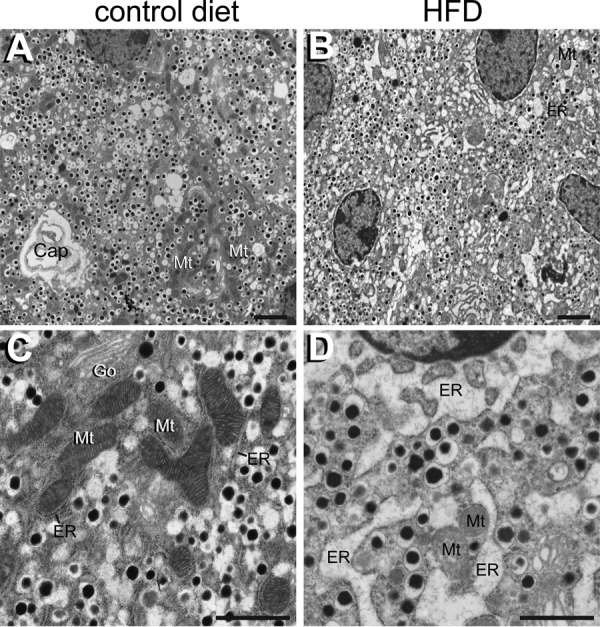
β cell ultrastructural changes assessed by EM following 16 weeks of HFD or chow diet. A, overview of a typical islet field from a chow diet mouse demonstrating abundant insulin granules in β cells. Typical elongated β cell mitochondria (Mt) and a capillary (Cap) are indicated. B, overview of β cells from a HFD-fed mouse showing fewer insulin granules and altered ultrastructural features. Dilated ER cisternae (ER) and degenerating mitochondria (Mt) are labeled. C, higher magnification of a typical β cell from a 16-week chow diet-fed mouse reveals mitochondria with dense matrices and prominent cristae (Mt) with an adjacent unaltered rough ER (ER). Go, Golgi complex. D, comparable high-magnification field from an HFD-fed mouse showing prominent dilated ER cisternae (ER) and a degenerating mitochondrion (Mt). Scale bars = 2 μm (A and B) and 1 μm (C and D).
Discussion
The general consensus is that genetic susceptibility, coupled with a loss of functional BCM, is a major element of the pathogenesis of T2D (1–4). Genome-wide association studies have identified many related genes and loci, but they account for only a fraction of the total risk (28). Instead, a loss of functional β cell compensation to metabolic stress over time appears to be the key factor in the transition from normoglycemia to overt T2D (3, 4). However, a detailed understanding of the precise mechanisms that account for this β cell maladaptation remains incomplete. Toward this end, a myriad of HFD-induced rodent models have been studied, with a range of metabolic perturbations and failed β cell-adaptive responses, although these findings are impacted by variables such as genetic differences among strains, sex, age of diet onset and its duration, and diet composition. In this study, we sought to avoid some of these confounding issues by using the B6N mouse, which lacks the Nnt mutation and has been reported to exhibit uniform insulin secretion profiles along with robust β cell responses to overnutrition (29). Indeed, our results showed a marked consistency within the various in vivo and in vitro isolated islet measurements in the HFD mice. The goal of this study was to characterize the temporal sequence and β cell adaptation mechanisms in male B6N mice fed a high-fat diet for up to 16 weeks that spanned the compensation-decompensation transition.
We found that the B6NTac mice maintained mild fed hyperglycemia through the 16 weeks of the HFD despite a progressive increase in obesity and glucose intolerance. Hyperglycemia was minimized by an ordered succession of adaptive β cell responses. Initially, insulin secretion was enhanced without a change in BCM. However, at 4–5 weeks, BCM increased and continued to expand for the next 6 weeks. Hyperinsulinemia also surged, especially after the 9- to 10-week time point when insulin resistance was first detectable by ITT. With continued exposure to the HFD (12–16 weeks), these counter-responses began to fail, with cessation of β cell growth, worsened glucose intolerance, and uncompensated β cell ER stress. This transition from β cell adaptation to failure was most apparent in the expression patterns of key profunction, prodifferentiation, and UPR genes. It also correlated with markedly reduced islet insulin secretory responses to high glucose concentrations and incretins ex vivo at 16 weeks.
Many studies using various durations of fat feeding in rodents reported early β cell compensation and/or later functional failure or ER stress. The novelty of this study is the focus on sequentially mapping the relative expression levels of key β cell profunction and prodifferentiation genes, transcription factors, and stress-related genes, which identified temporally distinct patterns and allowed us to identify and track the responses that account for the early β cell adaptation and later transition to functional failure. After the first week of HFD feeding, expression of the profunction genes MafA, PC, and Gipr was modestly reduced. The following week, the pattern switched to hyperexpression of genes, consistent with activating an array of compensatory responses related to enhanced glycolysis, mitochondrial metabolism, and survival. A second wave of enhanced gene expression occurred at 8 weeks with ongoing β cell growth. These waves were both characterized by hyperexpression of Pparγ, Pdx1, Gipr, PC, and Gck. We and others have shown previously that Pparγ transcriptionally regulates Pdx1 (18, 24), Gipr (19), PC (20), Glut2 (25), and Gck (26). In addition, PPARγ is known to mediate protection against β cell ER stress and maintain euchromatin structure (30) and is an important fatty acid sensor that, along with GPR40, is a key regulator of fatty acid-induced insulin secretion (31, 32). Furthermore, we have established that Pparγ is transcriptionally regulated by FoxO1 (20). These findings likely support activation of the PPARγ signaling pathway as a link to the downstream β cell functional adaptive responses with fat feeding, similar to our findings in Px rodent models (19, 20).
At 12 weeks of HFD, a transition in the expression of β cell profunction genes occurred so that most were down-regulated, but PPARγ and its target PC remained elevated. Although β cell mitochondrial dysfunction in concert with reduced PC levels are hallmarks of T2D (33), increased PC activity and metabolic coupling of mitochondrial metabolism with enhanced insulin secretion have been correlated with a heightened β cell compensatory drive (34). Thus, the dramatic increase in PC expression at 12 weeks of HFD, despite the relative reductions in other β cell function genes, may reflect a final effort to maintain high levels of insulin secretion.
The 12- to 16-week interval was marked by another switch in the gene expression profile to one of evolving β cell ER stress. A single β cell synthesizes approximately one million molecules of insulin per minute, which is achieved with highly efficient ER and Golgi activity (35). Integral to ER function are molecular chaperoning mechanisms that maintain correct protein folding and assembly (35, 36). The β cell UPR is a protective system, with BiP (GRP78) acting as the master regulator; when ER stress is detected, it initiates mechanisms to degrade misfolded proteins and arrest translation, thereby maintaining β cell function (35–37). However, with persistent ER stress, a decompensating UPR results in purging of dysfunctional β cells through C/EBP homologous protein 10 (CHOP)-mediated apoptosis (38). At 8 weeks, among the tested UPR genes, BiP expression was uniquely increased, indicating the onset of compensated ER stress. However, 4 weeks later, expression of the stress response genes Atf6 and Xbp1-spliced was increased, with a modest increase of Chop. Furthermore, Irs1, but not Irs2, was hyperexpressed at 8 and 12 weeks, with a recent study having shown that β cell Irs1 plays a role in activating ER stress–induced apoptosis (39). Then, at 16 weeks, Chop expression was further increased, along with widespread ER cisterna dilation by ultrastructural analysis, which is a sign of decompensated ER stress. Additional evidence for UPR activation was the increased expression at 12–16 weeks of the chaperones calreticulin and calnexin in the HFD mice (40). The importance of calreticulin in β cell biology has recently been highlighted by studies that have demonstrated its role in expression and stabilization of the insulin receptor and the link between calreticulin mutations and T2D (41–43).
In addition to the profound changes in ER stress marker expression during the 12- to 16-week interval, a striking increase in Hif1-α expression was observed. Previous work has identified a key role for β cell HIF1-α and the von Hippel-Lindau protein in regulating glucose homeostasis. Chronic activation of HIF1-α impairs β cell function by switching glucose metabolism from aerobic oxidative phosphorylation to anaerobic glycolysis (44, 45). We observed a significant reduction of Hif1-α at 12 weeks of HFD, along with a striking 3.5-fold increase in PC, suggesting enhanced anaplerotic flux of metabolites. However, by 16 weeks, a substantial, ∼4-fold increase in islet Hif1-α corresponded with a peak in proapoptotic Chop expression, with a major reduction in expression of the principal profunction and prosurvival genes. Thus, the dramatic switch in gene expression between 12 and 16 weeks is characterized by reduced expression of β cell function genes and transition to gene expression that drives decompensated ER stress and hypoxia.
We also investigated the cellular basis for the enhanced BCM in HFD mice. Studies in fat-fed B6J mice observed early β cell hyperproliferation coincident with increased expression of cell cycle regulators as the basis for increased BCM (11, 12). In this study, we found increased BCM at a similar time point (4 weeks) but did not find evidence of enhanced β cell proliferation, testing several early time points using two proliferation markers resolved with high magnification. Also, hyperproliferation was absent during the β cell growth surge in HFD mice from 4–10 weeks, except for a spike at 10 weeks, when BCM was already 2.5-fold higher than in control mice. Furthermore, only modest increases in individual β cell size were detected, and just within the 8–12 week interval. Instead, we did find a higher prevalence of the largest islet size class from 4–16 weeks. As these islets contribute substantially to the total BCM, this may indicate increased β cell life span in HFD mice, with enhanced β cell survival/reduced apoptosis having been reported in chronic HFD-fed mice (46, 47). Furthermore, the greater number of the smaller islets at 2 weeks, followed by their increased numbers up until 12 weeks, suggests potentially enhanced development of new islets (neogenesis) that grow into larger islets, thus contributing to the increased BCM. Similar observations have been reported during human obesity, pregnancy, and insulin resistance (48, 49) as well as in several animal models (15, 17, 50, 51), with the BCM increase attributed to non-proliferative means, primarily through neogenesis from the duct epithelium (52). Therefore, our data reveal primarily non-proliferative means of BCM expansion in fat-fed B6NTac mice.
It is generally believed the primary driver for the β cell adaptation in overnutrition/high-fat models is systemic insulin resistance and the associated dysmetabolism. We instead found that glucose intolerance with hyperinsulinemia was present after just 1 week of HFD feeding, whereas whole-animal insulin sensitivity as measured with ITT was not impaired until 11 weeks; a similar observation has been reported in HFD B6J mice (11, 12). Also, BCM increased substantially over the 4- to 10-week time frame in this study. However, reports on the B6J model of diet-induced obesity that used the more sensitive euglycemic clamp technique reported systemic insulin resistance much earlier (53, 54). Park et al. (54) identified hyperinsulinemia, systemic insulin resistance, adipose inflammation, and increased hepatic glucose production after just 3 days of the same HF formula that was used in this study. In addition, hypothalamic inflammation and a host of secondary neural responses have been detected after just 24 h of a HFD in B6 mice, possibly implicating the CNS in directing at least the early systemic compensation responses to nutrient overload (55). Thus, multiple elements of dysmetabolism and/or hyperglycemia, individually or collectively, remain strong candidates as physiological drivers for β cell adaptation.
In summary, a complex interplay of several β cell-adaptive mechanisms underlie the β cell functional compensation in B6NTac mice fed a HFD for 16 weeks. The first detectable β cell response is enhanced insulin secretion in tandem with a surge in Pparγ expression and its target genes. At 4 weeks, the gene expression pattern switches from profunction to prodifferentiation, whereas BCM increases by nonproliferative means. At 8 weeks, there is a second surge in Pparγ expression, along with sustained hyperexpression of prodifferentiation genes and progressive increases in BCM and hyperinsulinemia. The 12-week time point is characterized by a switch to reduced expression of principal profunction and prosurvival genes, along with the transition of compensated to decompensated ER stress. The 16-week time point is characterized by fully evolved ER stress and insulin secretory failure. Our study highlights the sequential repertoire of distinct mechanisms in response to overnutrition that transition from β cell adaptation to failure, with PPARγ and its targets playing central roles in the adaptation and ER stress eventually resulting from the metabolic decompensation.
Experimental procedures
Animals and feeding regimen
Six-week-old male C57BL/6NTac mice (B6NTac, Taconic), housed in the UVM Animal Facility, were fed either a control chow (LabDiet 5001, 13.5% fat) or an HFD (Research Diets, D14292, 60% fat) for up to 16 weeks. Male mice were chosen because female B6 mice are relatively refractory to HF-induced β cell dysfunction (56). Body weight, fed blood glucose concentration (FreeStyle monitor, Abbott) and plasma insulin (ELISA, Alpco) values were measured weekly. The guidelines specified by the UVM Institutional Animal Use and Care Committee were strictly followed for these studies.
Glucose homeostasis
Fasting blood glucose concentrations as well as i.p. glucose tolerance test (GTT, 2 g/kg) and ITT (0.75 units/kg) were performed at weekly intervals through 15 weeks in different cohorts of mice (n ≥ 5/group).
Pancreas morphometry
At weekly intervals, cohorts of mice were euthanized by exsanguination following i.p. sodium pentobarbital (n ≥ 6/group). Pancreata were routinely processed, and a planimetric method was used to measure BCM as detailed previously (17, 50, 51). In brief, this entailed high-resolution immunofluorescence imaging of 3–5 sections/pancreas with the sections being at least 200 μm apart, digital measurements of fractional β cell area, and the β cell mass calculated from the pancreatic mass of each mouse. β cell proliferation was measured using the markers Ki-67 and proliferating cell nuclear antigen, and β cell apoptosis was determined by TUNEL staining as outlined previously. β cell size (hypertrophy) was measured using the epithelial membrane marker pan-cadherin with insulin immunostaining (50, 51). The relative size distribution of islets and small endocrine cell clusters was measured using established methods (50, 51). Morphometric data were acquired and analyzed using a Nikon Ti-E workstation and NIS Elements software. For each assay, a minimum of 6 mice/group was measured.
In vitro insulin secretion
Islets were isolated by pancreatic duct infiltration with collagenase, Histopaque gradient separation, and handpicking. At 2 and 16 weeks, freshly isolated islets were subjected to a standard static secretion protocol using 2.8 or 16.7 mm glucose with or without GLP-1 or GIP-1 as described previously (19). Insulin secretion, measured with ELISA (Alpco), was normalized to total insulin content.
Islet gene expression studies
Total RNA was isolated from handpicked islets using the RNeasy Micro Kit (Qiagen) with single-step on-column DNase digestion, and the quality and quantity of total islet RNA were analyzed by NanoDrop spectrophotometry (Thermo). Total RNA (1 μg) was reverse-transcribed (ImProm-II reverse transcription system, Promega), and the resulting cDNA was subjected to quantitative real-time PCR analysis (ABI7300). Fluorescein amidite-labeled primer probes (Applied Biosystems) were used to amplify Pdx1, MafA, Nkx6.1, Pparγ, NeuroD, Irs1/2, Gck, Glut2, Kcnj, Gipr, Glp1r, Pc, Atf4, Atf6, Bip, Actb, and SYBR Green primer pairs for Chop, Hif-1α, Ins1, Ins2, and Xbp1 total and spliced were used. The threshold cycle (CT) method was used to determine relative enrichments of respective mRNAs of enlisted genes. All CT values of sample genes were normalized for total RNA using CT values of Actb message levels. The gene expression data presented are relative to control chow-fed samples, taking the average of triplicate gene expression determinations in three independent experiments.
Immunofluorescence and immunoblot analyses for ER stress
The ER chaperone and stress marker calreticulin was examined in pancreas sections from 3 mice/group at 12 and 16 weeks. For immunoblotting, islets were extracted in lysis buffer (19). Islet proteins (20 μg of whole-islet extract) were separated by 10% SDS-PAGE, transferred onto PVDF membranes, and probed with a rabbit anti-calreticulin antibody (Thermo Fisher). Membranes were reprobed with anti–β-actin (Sigma) to establish equivalent protein loading.
Electron microscopy
To examine potential ultrastructural signs of ER stress and β cell deterioration, pancreata from control chow- and HFD-fed mice (n = 3/group) at 16 weeks were minced in 2.5% glutaraldehyde in 100 mmol/liter cacodylate buffer, further fixed for 1.5 h on ice, washed, en bloc post-fixed in 1% osmium tetroxide, and embedded in Spurr resin. Thin sections were contrasted with uranyl acetate and lead citrate and finally imaged using a JEOL 1400 transmission electron microscope (UVM Microscopy Imaging Center).
Statistical analyses
Data are presented as mean ± S.E. as indicated. Statistical significance (p < 0.05) was determined by unpaired Student's t test or one-way analysis of variance and plotted using GraphPad Prism.
Author contributions
D. G., T. L. J., K. L., N. M., B. S., J. L., and M. P. performed the experiments. D. G., T. L. J., K. L., N. M., B. S., J. L., M. P., and J. L. analyzed the data. D. G., T. L. J., and J. L. wrote the manuscript. M. P. contributed to the discussions and reviewed and edited the manuscript. D. G., T. L. J., and J. L. are the guarantors of this work, had full access to all of the data in the study, and take responsibility for the integrity of the data and accuracy of the data analysis.
Acknowledgments
We thank Michele von Turkovich of the UVM Microscopy Imaging Center for expert assistance with electron microscopy and Rebecca Aksdal for preparation of the manuscript.
This work was supported by research grants from the American Diabetes Association (to J. L. L.) and National Institutes of Health Grant DK56818 (to J. L. L.). The authors declare that they have no conflicts of interest with the contents of this article. The content is solely the responsibility of the authors and does not necessarily represent the official views of the National Institutes of Health.
- T2D
- type 2 diabetes
- BCM
- β cell mass
- ER
- endoplasmic reticulum
- Px
- pancreatectomy
- PPAR
- peroxisome proliferator–activated receptor
- UPR
- unfolded protein response
- HFD
- high-fat diet
- ITT
- insulin tolerance test
- GTT
- glucose tolerance test
- UVM
- University of Vermont
- CT
- cycle threshold
- PC
- pyruvate carboxylase
- GIP
- glucose-dependent insulinotropic polypeptide.
References
- 1. Halban P. A., Polonsky K. S., Bowden D. W., Hawkins M. A., Ling C., Mather K. J., Powers A. C., Rhodes C. J., Sussel L., and Weir G. C. (2014) β-Cell failure in T2DM: postulated mechanisms and prospects for prevention and treatment. Diabetes Care 37, 1751–1758 [DOI] [PMC free article] [PubMed] [Google Scholar]
- 2. Weir G. C., and Bonner-Weir S. (2013) Islet β-cell mass in diabetes and how it relates to function, birth, and death. Ann. N.Y. Acad. Sci. 1281, 92–105 [DOI] [PMC free article] [PubMed] [Google Scholar]
- 3. Leahy J. L. (2014) in Therapy for Diabetes Mellitus and Related Disorders (Umpierrez G. E., ed) 6th Ed., pp. 92–105, American Diabetes Association, Alexandria, VA [Google Scholar]
- 4. Alejandro E. U., Gregg B., Blandino-Rosano M., Cras-Méneur C., and Bernal-Mizrachi E. (2015) Natural history of β-cell adaptation and failure in type 2 diabetes. Mol. Aspects Med. 42, 19–41 [DOI] [PMC free article] [PubMed] [Google Scholar]
- 5. Porat S., Weinberg-Corem N., Tornovsky-Babaey S., Schyr-Ben-Haroush R., Hija A., Stolovich-Rain M., Dadon D., Granot Z., Ben-Hur V., White P., Girard C. A., Karni R., Kaestner K. H., Ashcroft F. M., Magnuson M. A., et al. (2011) Control of pancreatic β-cell regeneration by glucose metabolism. Cell Metab. 13, 440–449 [DOI] [PubMed] [Google Scholar]
- 6. Sharma R. B., O'Donnell A. C., Stamateris R. E., Ha B., McCloskey K. M., Reynolds P. R., Arvan P., and Alonso L. C. (2015) Insulin demand regulates β cell number via the unfolded protein response. J. Clin. Invest. 125, 3831–3846 [DOI] [PMC free article] [PubMed] [Google Scholar]
- 7. Rivera J. F., Costes S., Gurlo T., Glabe C. G., and Butler P. C. (2014) Autophagy defends pancreatic β cells from human islet amyloid polypeptide-induced toxicity. J. Clin. Invest. 124, 3489–3500 [DOI] [PMC free article] [PubMed] [Google Scholar]
- 8. Imai J., Katagiri H., Yamada T., Ishigaki Y., Suzuki T., Kudo H., Uno K., Hasegawa Y., Gao J., Kaneko K., Ishihara H., Niijima A., Nakazato M., Asano T., Minokoshi Y., and Oka Y. (2008) Regulation of pancreatic β cell mass by neuronal signals from the liver. Science 322, 1250–1254 [DOI] [PubMed] [Google Scholar]
- 9. El Ouaamari A., Dirice E., Gedeon N., Hu J., Zhou J. Y., Shirakawa J., Hou L., Goodman J., Karampelias C., Qiang G., Boucher J., Martinez R., Gritsenko M. A., De Jesus D. F., Kahraman S., et al. (2016) SerpinB1 promotes pancreatic β-cell proliferation. Cell Metab. 23, 194–205 [DOI] [PMC free article] [PubMed] [Google Scholar]
- 10. Stewart A. F., Hussain M. A., García-Ocaña A., Vasavada R. C., Bhushan A., Bernal-Mizrachi E., and Kulkarni R. N. (2015) Human β-cell proliferation and intracellular signaling: part 3. Diabetes 64, 1872–1885 [DOI] [PMC free article] [PubMed] [Google Scholar]
- 11. Stamateris R. E., Sharma R. B., Hollern D. A., and Alonso L. C. (2013) Adaptive β-cell proliferation increases early in high-fat feeding in mice, concurrent with metabolic changes, with induction of islet cyclin D2 expression. Am. J. Physiol. Endocrinol. Metab. 305, E149–E159 [DOI] [PMC free article] [PubMed] [Google Scholar]
- 12. Mosser R. E., Maulis M. F., Moullé V. S., Dunn J. C., Carboneau B. A., Arasi K., Pappan K., Poitout V., and Gannon M. (2015) High-fat diet-induced β-cell proliferation occurs prior to insulin resistance in C57Bl/6J male mice. Am. J. Physiol. Endocrinol. Metab. 308, E573–E582 [DOI] [PMC free article] [PubMed] [Google Scholar]
- 13. Talchai C., Xuan S., Lin H. V., Sussel L., and Accili D. (2012) Pancreatic β cell dedifferentiation as a mechanism of diabetic β cell failure. Cell 150, 1223–1234 [DOI] [PMC free article] [PubMed] [Google Scholar]
- 14. Leahy JL. (2005) Pathogenesis of type 2 diabetes mellitus. Arch. Med. Res. 36, 197–209 [DOI] [PubMed] [Google Scholar]
- 15. Jetton T. L., Liu Y. Q., Trotman W. E., Nevin P. W., Sun X. J., and Leahy J. L. (2001) Enhanced expression of insulin receptor substrate-2 and activation of protein kinase B/Akt in regenerating pancreatic duct epithelium of 60%-partial pancreatectomy rats. Diabetologia 44, 2056–2065 [DOI] [PubMed] [Google Scholar]
- 16. Liu Y. Q., Montanya E., and Leahy J. L. (2001) Increased islet DNA synthesis and glucose-derived lipid and amino acid production in association with β-cell hyperproliferation in normoglycemic 60% pancreatectomy rats. Diabetologia 44, 1026–1033 [DOI] [PubMed] [Google Scholar]
- 17. Peshavaria M., Larmie B. L., Lausier J., Satish B., Habibovic A., Roskens V., Larock K., Everill B., Leahy J. L., and Jetton T. L. (2006) Regulation of pancreatic β-cell regeneration in the normoglycemic 60% partial-pancreatectomy mouse. Diabetes 55, 3289–3298 [DOI] [PubMed] [Google Scholar]
- 18. Moibi J. A., Gupta D., Jetton T. L., Peshavaria M., Desai R., and Leahy J. L. (2007) Peroxisome proliferator-activated receptor-γ regulates expression of PDX-1 and NKX6.1 in INS-1 cells. Diabetes 56, 88–95 [DOI] [PubMed] [Google Scholar]
- 19. Gupta D., Peshavaria M., Monga N., Jetton T. L., and Leahy J. L. (2010) Physiologic and pharmacologic modulation of GIPR by PPARγ signaling: possible mechanism for GIP resistance in type 2 diabetes. Diabetes 59, 1445–1450 [DOI] [PMC free article] [PubMed] [Google Scholar]
- 20. Gupta D., Leahy A. A., Monga N., Peshavaria M., Jetton T. L., and Leahy J. L. (2013) PPARγ and its target genes are downstream effectors of FoxO1 in islet β-cells: mechanism of β-cell compensation and failure. J. Biol. Chem. 288, 25440–25449 [DOI] [PMC free article] [PubMed] [Google Scholar]
- 21. Peyot M. L., Pepin E., Lamontagne J., Latour M. G., Zarrouki B., Lussier R., Pineda M., Jetton T. L., Madiraju S. R., Joly E., and Prentki M. (2010) β-Cell failure in diet-induced obese mice stratified according to body weight gain: secretory dysfunction and altered islet lipid metabolism without steatosis or reduced β-cell mass. Diabetes 59, 2178–2187 [DOI] [PMC free article] [PubMed] [Google Scholar]
- 22. Paulsen S. J., Jelsing J., Madsen A. N., Hansen G., Lykkegaard K., Larsen L. K., Larsen P. J., Levin B. E., and Vrang N. (2010) Characterization of β-cell mass and insulin resistance in diet-induced obese and diet-resistant rats. Obesity 18, 266–273 [DOI] [PubMed] [Google Scholar]
- 23. Montgomery M. K., Hallahan N. L., Brown S. H., Liu M., Mitchell T. W., Cooney G. J., and Turner N. (2013) Mouse strain-dependent variation in obesity and glucose homeostasis in response to high-fat feeding. Diabetologia 56, 1129–1139 [DOI] [PubMed] [Google Scholar]
- 24. Gupta D., Jetton T. L., Mortensen R. M., Duan S. Z., Peshavaria M., and Leahy J. L. (2008) In vivo and in vitro studies of a functional peroxisome proliferator-activated receptor γ response element in the mouse pdx-1 promoter. J. Biol. Chem. 283, 32462–32470 [DOI] [PMC free article] [PubMed] [Google Scholar]
- 25. Kim H. I., Kim J. W., Kim S. H., Cha J. Y., Kim K. S., and Ahn Y. H. (2000) Identification and functional characterization of the peroxisomal proliferator response element in rat GLUT2 promoter. Diabetes 49, 1517–1524 [DOI] [PubMed] [Google Scholar]
- 26. Kim H. I., Cha J. Y., Kim S. Y., Kim J. W., Roh K. J., Seong J. K., Lee N. T., Choi K. Y., Kim K. S., and Ahn Y. H. (2002) Peroxisomal proliferator-activated receptor-γ upregulates glucokinase gene expression in β-cells. Diabetes 51, 676–685 [DOI] [PubMed] [Google Scholar]
- 27. Sachdeva M. M., Claiborn K. C., Khoo C., Yang J., Groff D. N., Mirmira R. G., and Stoffers D. A. (2009) Pdx1 (MODY4) regulates pancreatic β cell susceptibility to ER stress. Proc. Natl. Acad. Sci. U.S.A. 106, 19090–19095 [DOI] [PMC free article] [PubMed] [Google Scholar]
- 28. Kahn S. E., Cooper M. E., and Del Prato S. (2014) Pathophysiology and treatment of type 2 diabetes: perspectives on the past, present, and future. Lancet 383, 1068–1083 [DOI] [PMC free article] [PubMed] [Google Scholar]
- 29. Alonso L. C., Watanabe Y., Stefanovski D., Lee E. J., Singamsetty S., Romano L. C., Zou B., Garcia-Ocaña A., Bergman R. N., and O'Donnell C. P. (2012) Simultaneous measurement of insulin sensitivity, insulin secretion, and the disposition index in conscious unhandled mice. Obesity 20, 1403–1412 [DOI] [PMC free article] [PubMed] [Google Scholar]
- 30. Evans-Molina C., Robbins R. D., Kono T., Tersey S. A., Vestermark G. L., Nunemaker C. S., Garmey J. C., Deering T. G., Keller S. R., Maier B., and Mirmira R. G. (2009) PPAR-γ activation restores islet function in diabetic mice through reduction of ER Stress and maintenance of euchromatin structure. Mol. Cell. Biol. 29, 2053–2067 [DOI] [PMC free article] [PubMed] [Google Scholar]
- 31. Kim H. S., Hwang Y. C., Koo S. H., Park K. S., Lee M. S., Kim K. W., and Lee M. K. (2013) PPAR-γ activation increases insulin secretion through the up-regulation of the free fatty acid receptor GPR40 in pancreatic β-cells. PLoS ONE 8, e50128. [DOI] [PMC free article] [PubMed] [Google Scholar]
- 32. Wagner R., Hieronimus A., Lamprinou A., Heni M., Hatziagelaki E., Ullrich S., Stefan N., Staiger H., Häring H.-U., and Fritsche A. (2014) PPAR modulates free fatty acid receptor (FFAR1) dependent insulin secretion in humans. Mol. Metab. 3, 676–680 [DOI] [PMC free article] [PubMed] [Google Scholar]
- 33. Jitrapakdee S., Wutthisathapornchai A., Wallace J. C., and MacDonald M. J. (2010) Regulation of insulin secretion: role of mitochondrial signalling. Diabetologia 53, 1019–1032 [DOI] [PMC free article] [PubMed] [Google Scholar]
- 34. Liu Y. Q., Jetton T. L., and Leahy J. L. (2002) β-Cell adaptation to insulin resistance: increased pyruvate carboxylase and malate-pyruvate shuttle activity in islets of nondiabetic zucker fatty rats. J. Biol. Chem. 277, 39163–39168 [DOI] [PubMed] [Google Scholar]
- 35. Scheuner D., and Kaufman R. J. (2008) The unfolded protein response: A pathway that links insulin demand with β cell failure and diabetes. Endocr. Rev. 29, 317–333 [DOI] [PMC free article] [PubMed] [Google Scholar]
- 36. Papa F. R. (2012) Endoplasmic reticulum stress, pancreatic β cell degeneration, and diabetes. Cold Spring Harb. Perspect. Med. 2, a007666. [DOI] [PMC free article] [PubMed] [Google Scholar]
- 37. Evans-Molina C., Hatanaka M., and Mirmira R. G. (2013) Lost in translation: endoplasmic reticulum stress and the decline of β-cell health in diabetes mellitus. Diabetes Obes. Metab. 15, 159–169 [DOI] [PMC free article] [PubMed] [Google Scholar]
- 38. Song B., Scheuner D., Ron D., Pennathur S., and Kaufman R. J. (2008) Chop deletion reduces oxidative stress, improves β cell function, and promotes cell survival in multiple mouse models of diabetes. J. Clin. Invest. 118, 3378–3389 [DOI] [PMC free article] [PubMed] [Google Scholar]
- 39. Takatani T., Shirakawa J., Roe M. W., Leech C. A., Maier B. F., Mirmira R. G., and Kulkarni R. N. (2016) IRS1 deficiency protects β-cells against ER stress-induced apoptosis by modulating sXBP-1 stability and protein translation. Sci. Rep. 6, 28177. [DOI] [PMC free article] [PubMed] [Google Scholar]
- 40. Michalak M., Corbett E. F., Mesaeli N., Nakamura K., and Opas M. (1999) Calreticulin: one protein, one gene, many functions. Biochem. J. 344, 281–292 [PMC free article] [PubMed] [Google Scholar]
- 41. Jalali S., Aghasi M., Yeganeh B., and Mesaeli N. (2008) Calreticulin regulates insulin receptor expression and its downstream PI3Kinase/Akt signaling pathways. Biochim. Biophys. Acta 1783, 2344–2351 [DOI] [PubMed] [Google Scholar]
- 42. Ramos R. R., Swanson A. J., and Bass J. (2007) Calreticulin and Hsp90 stabilize the human insulin receptor and promote its mobility in the endoplasmic reticulum. Proc. Natl. Acad. Sci. U.S.A. 104, 10470–10475 [DOI] [PMC free article] [PubMed] [Google Scholar]
- 43. Mahmazi S., Parivar K., Rahnema M., and Ohadi M. (2013) Calreticulin novel mutation in type 2 diabetes mellitus. Int. J. Diab. Dev. Ctries 33, 219–225 [Google Scholar]
- 44. Puri S., Cano D. A., and Hebrok M. (2009) A role for von Hippel-Lindau protein in pancreatic β-cell function. Diabetes 58, 433–441 [DOI] [PMC free article] [PubMed] [Google Scholar]
- 45. Cantley J., Grey S. T., Maxwell P. H., and Withers D. J. (2010) The hypoxia response pathway and β-cell function. Diabetes Obes. Metab. 12, 159–167 [DOI] [PubMed] [Google Scholar]
- 46. Ahrén J., Ahrén B., and Wierup N. (2010) Increased β-cell volume in mice fed a high-fat diet: a dynamic study over 12 months. Islets 2, 353–356 [DOI] [PubMed] [Google Scholar]
- 47. Mathijs I., Da Cunha D. A., Himpe E., Ladriere L., Chellan N., Roux C. R., Joubert E., Muller C., Cnop M., Louw J., and Bouwens (2014) Phenylpropenoic acid glucoside augments pancreatic β cell mass in high-fat diet-fed mice and protects β cells from ER stress-induced apoptosis. Mol. Nutr. Food Res. 58, 1980–1990 [DOI] [PubMed] [Google Scholar]
- 48. Saisho Y., Butler A. E., Manesso E., Elashoff D., Rizza R. A., and Butler P. C. (2013) β-cell mass and turnover in humans: effects of obesity and aging. Diabetes Care 36, 111–117 [DOI] [PMC free article] [PubMed] [Google Scholar]
- 49. Butler A. E., Cao-Minh L., Galasso R., Rizza R. A., Corradin A., Cobelli C., and Butler P. C. (2010) Adaptive changes in pancreatic β cell fractional area and β cell turnover in human pregnancy. Diabetologia 53, 2167–2176 [DOI] [PMC free article] [PubMed] [Google Scholar]
- 50. Jetton T. L., Everill B., Lausier J., Roskens V., Habibovic A., LaRock K., Gokin A., Peshavaria M., and Leahy J. L. (2008) Enhanced β-cell mass without increased proliferation following chronic mild glucose infusion. Am. J. Physiol. Endocrinol. Metab. 294, E679–E687 [DOI] [PubMed] [Google Scholar]
- 51. Jetton T. L., Lausier J., LaRock K., Trotman W. E., Larmie B., Habibovic A., Peshavaria M., and Leahy J. L. (2005) Mechanisms of compensatory β-cell growth in insulin-resistant rats: roles of Akt kinase. Diabetes 54, 2294–2304 [DOI] [PubMed] [Google Scholar]
- 52. Bonner-Weir S., Li W. C., Ouziel-Yahalom L., Guo L., Weir G. C., and Sharma A. (2010) β-Cell growth and regeneration: replication is only part of the story. Diabetes 59, 2340–2348 [DOI] [PMC free article] [PubMed] [Google Scholar]
- 53. Winzell M. S., and Ahrén B. (2004) The high-fat diet-fed mouse: a model for studying mechanisms and treatment of impaired glucose tolerance and type 2 diabetes. Diabetes 53, S215–S219 [DOI] [PubMed] [Google Scholar]
- 54. Park S. Y., Cho Y. R., Kim H. J., Higashimori T., Danton C., Lee M. K., Dey A., Rothermel B., Kim Y. B., Kalinowski A., Russell K. S., and Kim J. K. (2005) Unraveling the temporal pattern of diet-induced insulin resistance in individual organs and cardiac dysfunction in C57BL/6 mice. Diabetes 54, 3530–3540 [DOI] [PubMed] [Google Scholar]
- 55. Thaler J. P., Yi C. X., Schur E. A., Guyenet S. J., Hwang B. H., Dietrich M. O., Zhao X., Sarruf D. A., Izgur V., Maravilla K. R., Nguyen H. T., Fischer J. D., Matsen M. E., Wisse B. E., Morton G. J., et al. (2012) Obesity is associated with hypothalamic injury in rodents and humans. J. Clin. Invest. 122, 153–162 [DOI] [PMC free article] [PubMed] [Google Scholar]
- 56. Gonzalez A., Merino B., Marroquí L., Ñeco P., Alonso-Magdalena P., Caballero-Garrido E., Vieira E., Soriano S., Gomis R., Nadal A., and Quesada I. (2013) Insulin hypersecretion in islets from diet-induced hyperinsulinemic obese female mice is associated with several functional adaptations in individual β-cells. Endocrinology 154, 3515–3524 [DOI] [PubMed] [Google Scholar]