Abstract
Sepsis is a potentially lethal condition that might benefit from early monitoring of circulating activated leukocytes for faster stratification of severity of illness and improved administration of targeted treatment. Characterization of the intrinsic electrical properties of leukocytes is lable-free and can provide a quick way to quantify the number of activated cells as sepsis progresses. Iso-dielectric separation (IDS) uses dielectrophoresis (DEP) to characterize the electrical signatures of cells. Here we use IDS to show that activated and non-activated leukocytes have different electrical properties. We then present a double-sided version of the IDS platform to increase throughput to characterize thousands of cells. This new platform is less prone to cell fouling and allows faster characterization. Using peripheral blood samples from a cecal-ligation and puncture (CLP) model of polymicrobial sepsis in mice, we estimate the number of activated leukocytes by looking into differences in the electrical properties of cells. We show for the first time using animal models that electrical cell profiling correlates with flow cytometry (FC) results and that IDS is therefore a good candidate to provide rapid monitoring of sepsis by quantifying the number of circulating activated leukocytes.
Introduction
Sepsis is a potentially lethal condition (~30% mortality) that represents a systemic inflammatory and deregulated host response to infection1,2. In many cases, infectious agents can be detected in the blood, which induces complex immune responses that are initially pro-inflammatory and later anti-inflammatory3. At the center of these evolving inflammatory responses are leukocytes. Granulocyte recruitment and activation, for instance, increase with the initial inflammatory response associated with sepsis4.
Granulocyte mobilization can occur within a matter of hours5, therefore rapid quantification of activated leukocytes, and activated circulating granulocytes in particular, can provide a timely indicator of host responses to sepsis progression, thus allowing faster stratification of severity of illness and improved administration of targeted treatment.
Blood cells are routinely counted and characterized in clinical settings as a diagnostic aid. This requires counting subsets of leukocytes from a complex heterogeneous population such as that contained within septic blood. Clinicians often use complete blood counts (CBC), which have modest diagnostic specificity. Determining the host response to sepsis, however, requires a more specific count able to identify banded forms and activated leukocytes6. This is rarely feasible at the bedside and is typically done via extrinsic labeling that uses probes added to the cells to molecularly distinguish the subpopulations. This antibody-based labeling, however, requires approximately one hour for sample preparation, which prevents fast quantitation of activated leukocytes and thus impedes detailed monitoring of the early stages of sepsis.
Intrinsic properties of cells, meanwhile, refer to physical properties including size, mechanical properties, etc. These properties do not need exogenous labels or sample preparation to become apparent. As a result, significant effort has been devoted to creating technologies that can analyze and sort cells based on these properties7,8.
The electrical signature of cells induced in response to alternating-current (AC) fields is one such intrinsic property commonly used in micro-impedance spectroscopy9 and dielectrophoresis (DEP)10 to characterize and sort cells. Indeed, prior work using cell lines11 or healthy donor blood suggests that blood cell subpopulations can be distinguished electrically both in mice12 and human samples13–15. Some studies also show that activated and non-activated leukocytes have different AC electrical signatures11,16–19. Unfortunately, there have been few (if any) examples of translating this work to actual disease samples, which can differ substantially from healthy samples.
Two challenges exist in analyzing diseased septic blood. First, primary septic blood has substantial cell heterogeneity motivating the need for single-cell analyses on thousands of cells. Most prior blood-related work mentioned above, however, has characterized cell suspensions at a population level14,18,17,12 or with modest numbers of single cells (6–50 cells)13,16,19,15 and are thus unable to capture the heterogeneity in the population. Second, septic blood is inherently prone to fouling due to the abundance of clotting agents. Fouling is often exacerbated in electrical profiling systems, which typically operate at slow flow rates that allow substantial interaction between the cells and the device surfaces. Washing cells into controlled media, as has previously been done with artificially activated leukocytes, can help mitigate this adhesion17,19.
Our group has previously introduced isodielectric separation (IDS) as a method to measure the electrical properties of single cells independently of their size and using continuous flow20. Here we adapted IDS to assay the electrical properties of immune cells for monitoring sepsis. We first characterized the electrical properties of activated human granulocytes at a single cell level using a traditional single-sided IDS platform, which contains electrodes on the flow chamber floor. We then introduced technical innovations that enabled analysis of septic blood samples, namely a double-sided IDS platform with electrodes on the chamber floor and ceiling that allows increased flow rates and, along with use of controlled media, is thus more resistant to fouling. We use this new IDS platform to characterize samples from septic mouse models and demonstrate the ability to distinguish activated and non-activated granulocytes. Finally, we show for the first time, that electrical profiling of primary immune cells from septic mice correlates with traditional flow cytometry analysis and therefore holds promise for fast label-free monitoring of sepsis progression.
Materials and Methods
Experimental Setup
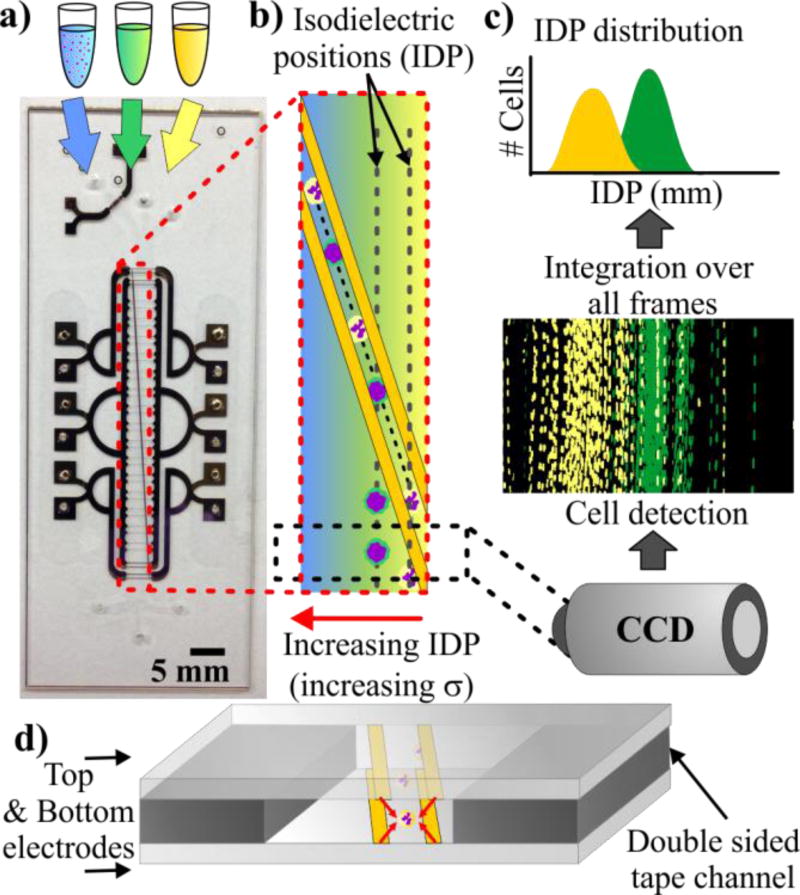
In IDS, a heterogeneous population of cells suspended in high-conductivity media is flowed into a microfluidic chip (Fig. 1a). Other inlets containing intermediate and low conductivity media provide a parallel laminar co-flow. This configuration generates a diffusive conductivity gradient perpendicular to the convective fluid flow (Fig. 1a–b). The channel also contains slanted planar electrodes patterned at the bottom (single-sided IDS) or top and bottom (double-sided IDS). An AC electric field applied to the electrodes generates a DEP barrier that guides the cells across the conductivity gradient. Cells escape the DEP barrier at their isodielectric position (IDP), which is the position where they are at dielectric equilibrium with the surrounding medium. Cells with different effective permittivity (or, equivalently, effective conductivity) escape at a different IDPs resulting in a transverse spatial distribution of cells. A camera near the end of the channel takes images of the cells. Finally, image-processing software detects these cells and computes the resulting IDP distribution (Figure 1c).
Figure 1.
(a) Image of double-sided IDS chips, which consists of patterned electrodes on two glass substrates bonded together by a 25 µm thick double-sided tape. (b) Liquid of high, medium, and low conductivity flows into a channel and creates a transverse conductivity gradient. Electrodes apply a DEP force pushing cells to the right as they flow down the channel. Cells escape the DEP barrier at their isodielectric position (IDP) resulting in a transverse distribution of cells. (c) A camera is used to capture images near the end of the channel, which are processed to extract the IDP distributions. (d) Depiction of the cross section of a double-sided IDS, which has electrodes on the top and bottom of the channel generating DEP forces that keep cells away from the walls.
IDS Operation
To determine the IDP distributions of different populations, we used cell suspensions (2×10⁶ cells/ml) in PBS buffer with a conductivity of 1.2 S/m (PBS, 1% BSA, 1 U/ml Heparin). For the intermediate and low conductivity media we mixed this buffer with an isotonic sucrose solution to achieve an intermediate conductivity of 0.8 S/m and a low conductivity of 0.4 S/m.
External syringe pumps controlled the flow in all three inlets (see results for detailed flow rate conditions). The cell inlet was connected to a custom-made fluidic switch that allowed device priming and cleaning between samples, thus helping to avoid fouling.
A function generator (Agilent 33220A) and an amplifier applied a 10 Vpp AC field at various frequencies. Imaging was performed with a camera (Image QE, LaVision) using fully automated microscopy (Axio Imager M1m, Zeiss) under FITC and TRITC filters (FITC and TRITC filter sets, Zeiss). A MATLAB script analyzed the images to detect cells in each frame and determine the centroid of each cell, thus creating the cell position distributions that correspond to the resulting IDP distribution.
Device Fabrication
Fabrication of the single-sided IDS platform is as previously reported20. Briefly, we use soft lithography and replica molding to generate a 2-mm wide and 20-µm tall PDMS microchannel that we bond to a glass substrate with patterned electrodes. To pattern the electrodes on the glass, we e-beam evaporate 10 nm of Ti and 200 nm of Au and perform lift-off, which generates interdigitated electrodes with gap and width of 15 µm and 50 µm respectively.
The double-sided IDS (Figure 1d) consists of a microchannel cut in a double-sided tape sandwiched by two electrode-patterned glass slides, fabricated in a fashion similar to previous reports21. We cut a 2-mm wide microchannel using a laser cutter on a 25 µm thick double-sided tape (PSA tape, Adhesive Research). We align the tape to the substrate under a stereoscope and press with a rubber roller to bond the channel to one of the substrates (bottom glass slide). We drill 2-mm wide holes using diamond bits on the other substrate (top glass slide) to allow fluidic access to the microchannel. The top substrate is then aligned and pressed onto the topside of the tape. The whole device is then set in a hotplate (90° C) for 1h with 1 kg weight on top to ensure a proper seal.
In both platforms electrode connections consist of wires attached to electrode pads using silver epoxy.
Cecal Ligation and Puncture Mouse Model
All animal protocols were approved by the Harvard Medical Area Standing Committee on Animals, Harvard Medical School, and the Space and Naval Warfare Systems Center Pacific (SSC Pacific) Institutional Animal Care and Use Committee (IACUC). We used cecal ligation and puncture (CLP) as a polymicrobial sepsis model in mice as described in detail elsewhere22.
Briefly, we used 6–8 week C57BL/6 male mice (~20 grams) with right carotid and left internal jugular catheters (Charles River Laboratories, Wilmington, MA). Some of these mice with catheters were used as control with no intervention from here on called healthy mice. The rest were anesthetized and via a 2 cm laparotomy the cecum was exposed, and half of it was ligated. At 2 mm from the ligation the cecum was punctured with a 19G needle (BD Biosciences, San Jose, CA) to gently squeeze cecal content back into the peritoneal cavity. The cecum was then placed back into the peritoneal cavity, the abdomen was closed, and 1 mL of phosphate-buffered saline (Corning-Cellgro, Manasas, VA) was administered i.p. for resuscitation. 100 µl aliquots of peripheral blood were collected through the venous catheters at 6, 12 and 24 h after CLP.
Cell Preparation
We obtained 10 ml samples of heparinized human blood from healthy donors (Blood Research Components, LLC). We set two aliquots of 5 ml of blood in 3 ml of Mono-Poly Resolving Medium (MP Biosciences) and spun the samples in a free hanging centrifuge at 400 cfg for 40 min. The resulting layered samples contained a band of granulocytes that we recovered, triple washed with PBS, and resuspended in a cell buffer consisting of PBS, 1% BSA and 1 U/ml Heparin.
We activated human granulocytes using a buffer of PMA (Phorbol 12-Myristate 13-Acetate, Sigma Aldrich) in PBS containing Mg++ and Ca++. To activate the cells, we mixed a 1:1 solution of suspended cells and solutions of PMA at different concentrations and incubated the resulting suspension for 20 min at room temperature.
We obtained mouse leukocytes from blood aliquots collected from the mouse models. Whole blood was mixed with erythrocyte lysis buffer (1x RBC Lysis Buffer 200mL, eBioscience) for 5 min and then triple washed in PBS and resuspended in the same cell buffer.
We labeled cells with 50 µM nuclear dye (SYTO-9, Invitrogen) to aid visualization of nucleated cells and simplify cell detection in the image processing. In all cases we loaded 2×10⁶ cells/ml solutions of stained cells into the IDS device immediately after preparation.
Flow Cytometry and Functional Assays of Leukocytes
Flow cytometry (FC) was performed with a BD Accuri (Becton Dickinson) flow cytometer with 488 nm and 670 nm lasers. We gated granulocytes based on side and forward scatter and stained them with anti-human CD18-APC (Becton Dickinson). To verify granulocyte activation, we monitored the oxidative burst pre-incubating cells 10 min at room temperature with 100 nM dichloro-fluorescein diacetate (DCFH-DA, Sigma Aldrich). Activation was then quantified by DCF fluorescence.
Mouse leukocytes were also gated based on side and forward scatter and stained using anti-mouse CD-18 and anti-mouse Ly6G (Becton Dickinson) as activation markers.
Results
Dielectric Characterization of Human Granulocytes
We first set out to confirm that IDS is able to discern IDP differences in activated and non-activated human granulocytes extracted from freshly collected blood from healthy donors. As a way to control the activation level we used PMA, which is commonly used to activate granulocytes in vitro. Different doses of PMA resulted in increased DCF fluorescence as a result of an increase in the levels of reactive oxygen species, which indicate granulocyte activation (Figure S1).
Using a single-sided IDS platform, we measured the IDP distributions of granulocytes treated with 1 µM PMA and a control population of non-treated granulocytes. We loaded cells at 0.4 µl/min and the intermediate and low conductivity buffer at 0.55 µl/min (1.5 µl/min total).
We applied a 10 Vpp voltage to the electrodes with frequencies ranging from 0.5 MHz to 15 MHz. To determine the IDP distributions for each frequency and sample we recorded the IDP for ~45 seconds. This acquisition provided the characterization of different populations with a median of 330 cells per sample. The IDP results correspond to the average IDP position of three blood samples from different healthy donors.
As expected, PMA treated and non-treated cells loaded without applying an AC voltage across the electrodes (DEP Off) have the same average IDP of ~1.48 mm (Figure S3). This represents the upper limit of our dynamic range. An IDP of 0 mm is the lower limit of the dynamic range and corresponds to cells being pushed all the way to the end of the channel. At a frequency of 0.5 MHz most of the cells were pushed all the way to this lower limit for all samples. This was used to align the 0 mm IDP position across videos from different samples.
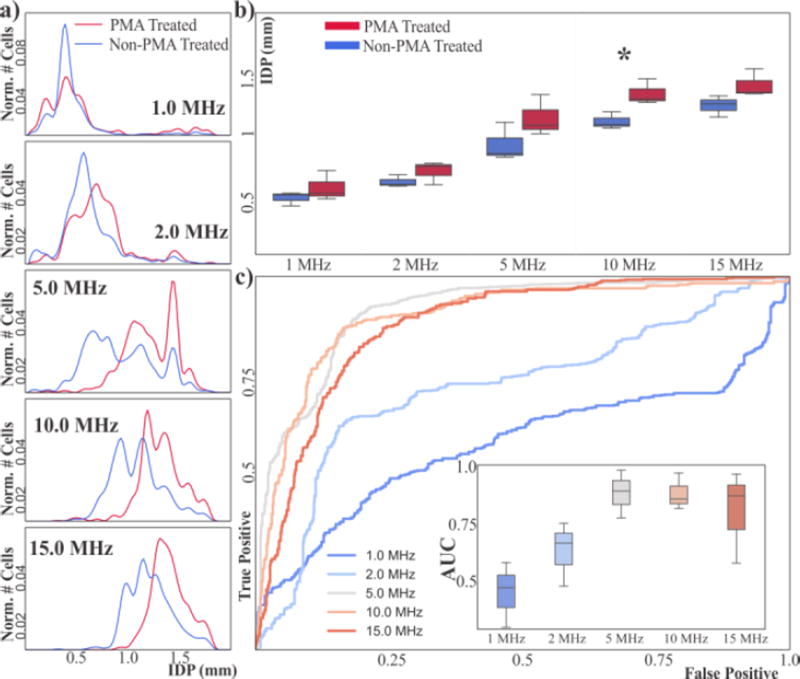
If we plot the aggregated distributions of all samples for each frequency, we can qualitatively see that at low frequencies (≤2 MHz) both PMA treated and non-treated populations have similar IDP distributions (Figure 2a). As frequency increases above 2 MHz, however, the IDP distribution of PMA treated granulocytes is displaced towards higher IDP with respect to the non-treated cells.
Figure 2.
(a) Aggregated IDP distributions of PMA-treated and non-treated human granulocytes. (b) Box-and-whisker plots of mean IDP of PMA-treated and non-treated granulocytes. At 10 MHz the mean IDP of both population types is different (*p<0.05). (c) ROC curves of the aggregated samples using the IDP position as classification criteria for different frequencies. Inset shows box-and-whisker plots of the AUC for each frequency across all samples (n=3).
This can also be observed qualitatively when introducing both PMA treated and non-treated populations into the IDS device. Video S2 shows PMA treated (stained green) and non-treated (stained red) flowing in the IDS when DEP is active at 10 MHz. By visual inspection it is easy to see that PMA-treated cells flow higher in the channel (higher IDP) and non-treated cells flow lower in the channel (smaller IDP). Remaining overlap in the IDP distributions upon IDP upon PMA treatment could be due to a subpopulation of cells that is not activated, or that the change in electrical properties of the cells upon activation is less than the variation in electrical properties across the population. Since IDS can also perform preparative separations, it is conceivable that recovery and further phenotyping of sorted fractions could help distinguish among these possibilities.
Results are also consistent with this trend when looking at samples individually across three different days. As a more quantitative measure of the difference we first look at the average IDP. Figure 2b shows the average IDP of three independent samples from three healthy donors. There is a difference in the mean IDP that is statistically significant at 10 MHz (p=0.03).
Given that the IDP distributions of PMA treated and non-treated populations appear to be different in average we decided to evaluate the use of the IDP as a threshold to classify cells into activated and non-activated at a single cell level. Receiver-operator characteristics (ROC) are a standard method for assessing if a given test is able to discern two different populations23. We used IDP as a classification threshold and we used the original population to determine true positives (i.e. PMA treated cells = activated cells, non-PMA treated cells = non-activated cells). The resulting ROC curves have an area-under-the-curve (AUC) that increases with higher frequencies (see Figure 2c).
The peak AUC occurs at frequencies ranging from 5–10 MHz with a value of ~0.88, suggesting that at these frequencies IDP is able to distinguish PMA-treated vs. non-treated human granulocytes. Importantly, this classification is performed at a single-cell level rather than as a population metric and across 3 samples.
Double-Sided IDS
Although results with human granulocytes suggest that IDS could be used to monitor activation during sepsis progression, the single-sided IDS platform is not suitable for assaying septic blood. As mentioned in the previous results, it is challenging to acquire data for more than 45 seconds for PMA treated cells. This is due to the operating conditions of the single-sided IDS and the nature of the sample.
Single-sided IDS is used at low flow rates, and it generates a net upward force pushing cells to the top of the channel where they contact the channel ceiling. These conditions eventually lead to fouling (Figure S4) which disrupts the flow and the IDP distribution and limits the number of acquired cells to ~330 in the conditions used above. Flow rates would be further decreased when analyzing mouse blood, which has cells with a smaller diameter and thus experience even smaller DEP forces, worsening the problem.
Inspired by previous work that used microfluidic chips with electrodes on the top and bottom of the channel24–26, we developed a double-sided IDS device. This configuration has the advantage of centering cells vertically, which in our case helps reduce cell adhesion to the microchannel walls. Previous studies have shown that given the same geometries using electrodes at the top and bottom of the channel allows to guide or stop cells, even when using higher flow rates27.
Considering our particular geometry, cell size and applied voltage we simulated our system and estimated that a double-sided configuration would double the maximum flow rate that we could use. An FEM simulation also shows that this configuration in the negative DEP regime pushes cells to the minimum electric field in the middle of the channel (Figure S5). Both the increased flow rate and minimized cell-wall contact decrease cell adhesion to the chip.
Qualitatively we observed less fouling while using the double-sided IDS, which allowed longer sampling periods. To quantify the stability of the new devices, we assayed the IDP of mouse leukocytes. We loaded the cells and two conductivity buffers at 1 µl/min (total flow rate of 3 µl/min). This allowed us to increase the measurement periods to >5 min without fouling and therefore increase ~7 fold the median number of cells characterized per sample to 2400 cells/sample.
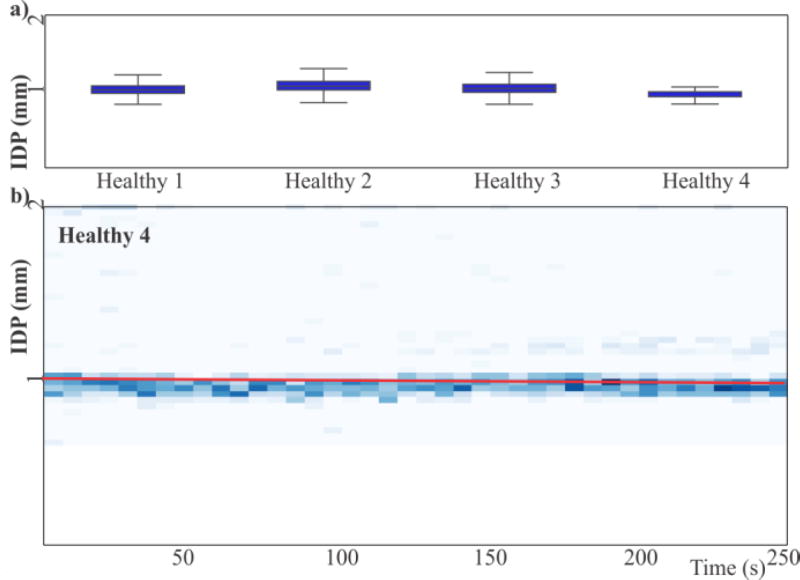
The characterization of 4 healthy mice (over 2 weeks) at 10 MHz resulted in IDP distributions with mean IDP of 1.04 mm with a standard error of the mean of 0.05 mm (Figure 3a). Importantly, there are no calibration steps in the procedure; the IDPs obtained are absolute positions that are stable across samples. Together, this data shows that characterization with the double-sided IDS device is consistent across multiple samples and weeks. Figure 3b shows the evolution of the IDP over time as a density plot of cells flowing at a particular position. This plot is a representative experiment but all other samples had similar results (Figure S6).
Figure 3.
(a) Box-and-whiskers plots of the IDP distributions of the leukocytes of four mice across 2 weeks at 10 MHz show no statistically significant differences in IDP. (b) Representative IDP time series for a healthy animal. Trend line (red) has a slope that suggests a small drift in the IDP of 24 µm (~1.5% of the dynamic range of the device).
Outlier cells at high IDP are indicative of the intrinsic heterogeneity in primary samples from healthy animals. The main peak of the IDP distribution shifts slightly over time. The p-value on the slope is <0.01 but the slope is 80 nm per second, which results in a drift of 24 µm (~1.5 % of the dynamic range of the device) over the span of the data collection. All other samples from healthy mice showed similar or smaller drifts.
Monitoring Septic Blood
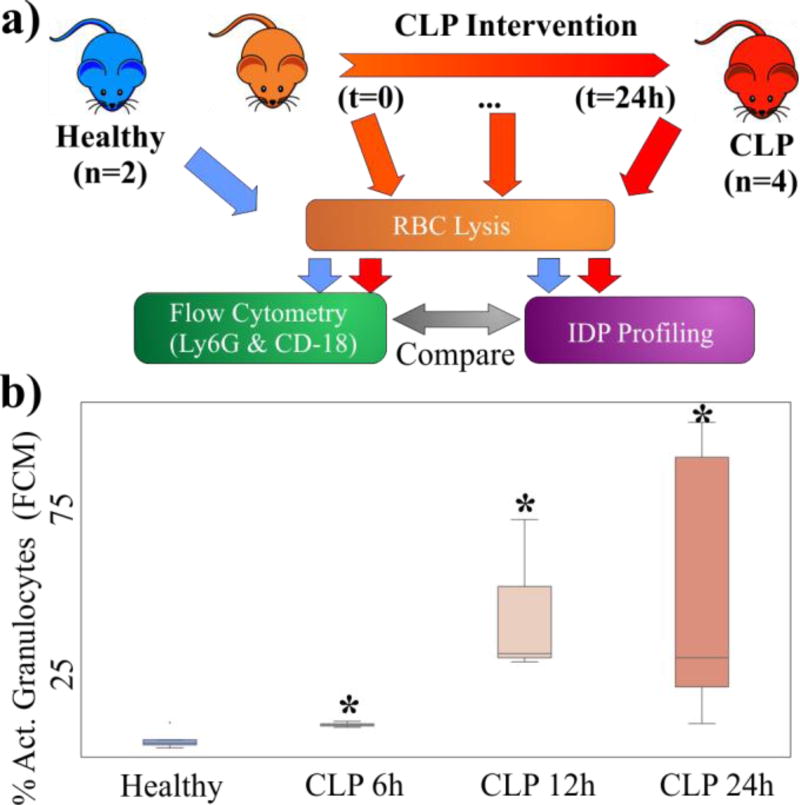
We next used a controlled pre-clinical model of sepsis as a way to compare traditional phenotyping with characterization using the double-sided IDS platform. Specifically, we obtained blood samples from healthy mice and from CLP mice at 6h, 12h and 24h after the CLP procedure, and measured the number of Ly6G+ and CD-18+ granulocytes using FC (Figure 4a). We also characterized samples from the same animals and timepoints using the double-sided IDS platform.
Figure 4.
(a) Overview of experimental protocol. Samples from healthy mice and septic mice at different time points after the CLP intervention undergo RBC lysis and then analysis via either FC or IDS. (b) Box-and-whiskers plots of the percentage of activated granulocytes measured via FC at different time points. There percentage of activated cells increases over time (* p<0.05).
FC results showed that the number of activated granulocytes increases over time after the CLP procedure (Figure 4b). In all cases the increase of activated granulocytes is statistically significant (p<0.05) when compared to healthy samples. The box-and-whiskers plot in figure 4b also shows that there is a great variability in the number of activated granulocytes between samples. This variability is a result of the complexity of the septic response and the different prognosis of each animal and becomes more apparent over time.
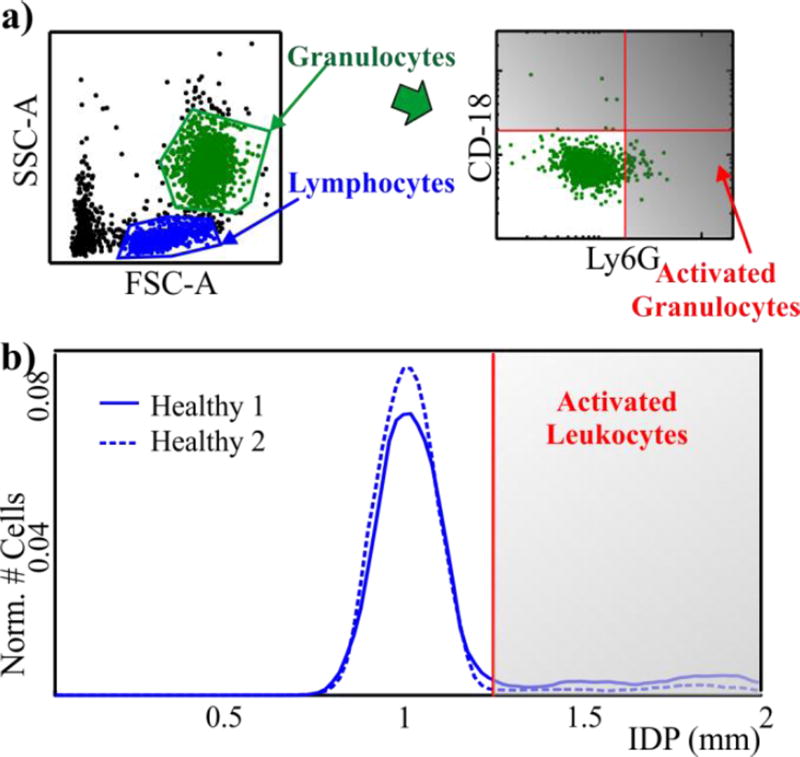
In order to compare the results provided by IDS and FC we defined classification gates for both cases. In FC the number of activated cells is evaluated by setting a gate for CD-18+ and Ly6G+ cells for two healthy animals (Figure 5a).
Figure 5.
(a) Strategy for classification via FC scatter plots from healthy samples. We first use forward and side scatter to identify granulocytes and then gate on CD-18 and Ly6G to classify cells as activated. (b) IDS histograms from two healthy animals show a clear peak in the distribution around 1.04mm. A gate is set to delimit the main peak. Cells to the right of the gate will be considered activated.
We used a similar approach to set the gate for IDS. Samples from healthy animals have a main peak in their IDP distribution at 1.04 ± 0.05 mm with a few cells in secondary peaks with higher IDP (Figure 3b). Based on the results obtained from activated human granulocytes (Figure 2), we expected activation to increase the IDP for of mouse leukocytes. We therefore set the IDS gate to delineate the two populations by analyzing two healthy animals and visually setting a gate close to the main peak in the distribution (Figure 5b). This follows from the assumption that the main peak in the healthy animals (Figure 3b) represented un-activated cells and cells with higher IDP were activated cells. Importantly, after selecting these gates we used them without alteration for all animals across all experiments.
Using our gating strategy, we counted the number of putative activated leukocytes in CLP mice samples. The values varied, even for the same nominal injury, due to the inherent variability of the animals and the CLP procedure. Examining the IDP distributions for samples from CLP animals, we see that they generally have a main peak at IDP ≈ 1 mm, similar to healthy animals.
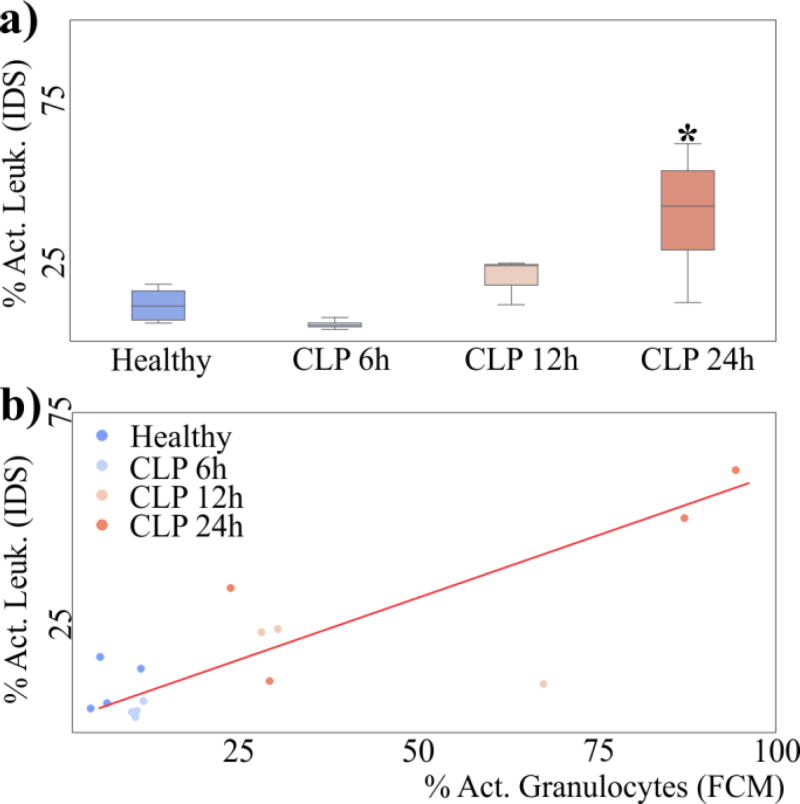
IDP distributions from CLP mice, however, have a higher fraction of cells at high IDP. The percentage of activated cells according to our gating strategy in IDP confirms that CLP animals have an increased percentage of activated cells as time progresses (Figure 6a, p<0.05 at 24h). These results are consistent with our hypothesis that cells with higher IDP represent activated cells, and that this percentage should increase as sepsis progresses.
Figure 6.
(a) Box-and-whiskers plot of the percentage of activated cells in CLP mice as classified by our gating strategy in IDP. (b) Scatter plot of the percentage of cells classified as being activated in IDP and FCM. Both quantities are correlated (Pearson R=0.86, p=0.0005)
We aggregated results across 3 different weeks for a total of 15 animals (4 healthy, 4 CLP 6h, 3 CLP 12h and 4 CLP 24h), and comparing the putative activated cells from IDS as compared to activation as measured with FC, we obtained a linear correlation with a Pearson correlation coefficient of 0.86 (Figure 6b). Overall, our results represent the first quantitative correlation between traditional assessment of leukocyte activation and electrical assessment of activation in diseased samples.
Discussion
Blood samples from critically ill subjects are heterogeneous and change rapidly with the progression of sepsis. Activated immune cells in particular change rapidly during the first hours of the disease. This is well-modeled in CLP septic mice shown above, where we see a significant increase of activated cells beginning at 6h after the intervention.
To expedite sepsis detection and improve targeted treatments, it is important to quickly characterize blood while quantifying activated cells that might allow treatment decisions to be made in real-time at the bedside. A measure of the intrinsic electrical properties of cells could reduce the characterization time when compared to flow cytometry since there is no need for cell labeling. Moreover, monitoring the number of activated circulating leukocytes can provide a marker that could be used to monitor the progression of sepsis.
We have shown that the electrical properties of artificially activated and non-activated human granulocytes are different and could therefore be used to stratify subjects with sepsis. Using a single-sided IDS device we have characterized the electrical properties of hundreds of individual cells. This characterization shows that the IDP of activated cells is displaced to a higher effective conductivity. These results are consistent with previous results that showed that the effective conductivity of cells increases with activation16,17.
Differences in the electrical properties of cells are due to different biophysical mechanisms. Previous work and models have suggested that as frequency increases, differences in inner cellular compartments become more apparent because at higher frequencies the plasma membrane impedance decreases, exposing the cell interior to the electric field28. Activated and non-activated human granulocytes have different IDP at mid-frequencies (5–15 MHz). Differences at these frequencies are usually associated with changes in cell membrane morphology, membrane permeability and cytoplasm conductivity. Although study of the underlying biophysics is not the main focus of this paper it is likely that some or all of these processes play a role in these electrical properties differences.
Importantly, these electrical properties differences are discernable in a CLP mouse model of sepsis. Using a double-sided IDS, we showed that it is possible to measure the percentage of cells with high IDP and that this percentage correlates with the percentage of activated cells as measured by flow cytometry. Both percentages increase with time as measured in mice at 6h, 12h and 24h after the CLP intervention, which suggests that IDS could be used to monitor the progress of the disease.
The correlation between IDS and FC has a non-zero offset, possibly due to specific differences in how we set the gates for both methods. The slope was <1, likely because changes in IDP are due to biophysical changes that might change at a different rate than CD-18 and Ly6G expression. This is consistent with the observation that differences in IDP become statistically significant later during the progression of sepsis.
The double-sided IDS is a robust platform that can be used for extended periods of time. Cells are pushed to the middle of the channel to avoid cell fouling. Moreover, the double-sided IDS is a flow-through platform that does not require cells to be re-suspended in multiple low conductivity buffers. The double-sided IDS therefore speeds up the process of electrically characterizing thousands of cells in a short amount of time and can potentially enable real time tracking of granulocyte activation as sepsis progresses.
Clinical deployment of IDS for monitoring sepsis, however, would require sampling within minutes rather than several hours as demonstrated here. Even though we did not sample at earlier time points due to logistical constraints with the animal models, the current implementation of the double-sided IDS allows analyzing a sample within 30 min of collection. Most of this time is required for the necessary step of separating leukocytes from red blood cells (RBC) prior to loading into the IDS platform. The actual analysis of the cells only requires about 10 minutes (5 minutes of video acquisition and 5 minutes of nuclear cell stain and video processing).
In order to further decrease the sampling time and advance the automation of the system one could integrate the removal of RBCs from the samples in the system and avoid staining cells with a nuclear stain. Other flow-through microfluidic platforms have shown that inertial sorting of cells can be used to separate leukocytes from RBCs29. Such platforms could be integrated with IDS for rapid sample preparation and separation of nucleated cells. The characterization of the IDP downstream would most likely not be affected even if these platforms do not separate cells with 100% efficiency. RBCs are in general smaller than nucleated cells and would therefore experience a smaller DEP force and would not be displaced using operating conditions similar to the ones shown in this paper. This would avoid disturbing the IDP characterization due to an increased cell density. The integration of these two flow-through technologies would therefore reduce sample preparation even further to the point where it might be possible to monitor IDP position in real time and therefore monitor sepsis in pseudo-real time (except for video processing delays).
Conclusions
We have demonstrated that the IDP classifies activated and non-activated human granulocytes and can be used to quantify each population at a single-cell level. This technique could be used to monitor the evolution of septic blood by quantifying the percentage of activated leukocytes.
To deal with complex samples from septic blood we have implemented a double-sided version of the IDS platform that allows increased flow rate operation and avoids cell fouling by vertically focusing cells at the middle of the channel. This new platform allowed us to quadruple the number of cells characterized per sample as compared to traditional IDS.
Finally, we have shown IDS can be used to monitor septic blood from CLP mice. We demonstrated that setting gates for cells with high IDP as a way to quantify activated leukocytes that correlates with FC assays. Importantly, this correlation held across mice, across interventions, and across weeks. Thus, these results suggest that IDP profiling can quickly quantify activated leukocytes in clinically relevant animal models, and represents the first example of the use of electrical cell profiling that provides a clinically relevant metric.
Footnotes
Electronic Supplementary Information (ESI) available: [details of any supplementary information available should be included here]. See DOI: 10.1039/b000000x/
Footnotes should appear here. These might include comments relevant to but not central to the matter under discussion, limited experimental and spectral data, and crystallographic data.
References
- 1.Riedemann NC, Guo R-F, Ward PA. J Clin. Invest. 2003;112:460–467. doi: 10.1172/JCI19523. [DOI] [PMC free article] [PubMed] [Google Scholar]
- 2.Singer M, Deutschman CS, Seymour CW, Shankar-Hari M, Annane D, Bauer M, Bellomo R, Bernard GR, Chiche JD, Coopersmith CM, Hotchkiss RS, Levy MM, Marshall JC, Martin GS, Opal SM, Rubenfeld GD, Poll T, Vincent JL, Angus DC. JAMA. 2016;315(8):801–810. doi: 10.1001/jama.2016.0287. [DOI] [PMC free article] [PubMed] [Google Scholar]
- 3.Cohen J. Nature. 2002;420:885–891. doi: 10.1038/nature01326. [DOI] [PubMed] [Google Scholar]
- 4.Alves-Filho JC, Spiller F, Cunha FQ. Shock. 2010;34:15–21. doi: 10.1097/SHK.0b013e3181e7e61b. [DOI] [PubMed] [Google Scholar]
- 5.Furze RC, Rankin SM. Immunology. 2008;125:281–288. doi: 10.1111/j.1365-2567.2008.02950.x. [DOI] [PMC free article] [PubMed] [Google Scholar]
- 6.Dixon LR. J Perinat Neonatal Nurs. 1997;11:1–18. doi: 10.1097/00005237-199712000-00003. [DOI] [PubMed] [Google Scholar]
- 7.Gossett DR, Weaver WM, Mach AJ, Hur SC, Tse HTK, Lee W, Amini H, Di Carlo D. Anal Bioanal Chem. 2010;397:3249–3267. doi: 10.1007/s00216-010-3721-9. [DOI] [PMC free article] [PubMed] [Google Scholar]
- 8.Li P, Stratton ZS, Dao M, Ritz J, Huang TJ. Lab Chip. 2013;13:602–609. doi: 10.1039/c2lc90148j. [DOI] [PMC free article] [PubMed] [Google Scholar]
- 9.Morgan H, Sun T, Holmes D, Gawad S, Green NG. J Phys. D: Appl. Phys. 2006;40:61–70. [Google Scholar]
- 10.Voldman J. Annu Rev Biomed Eng. 2006;8:425–454. doi: 10.1146/annurev.bioeng.8.061505.095739. [DOI] [PubMed] [Google Scholar]
- 11.Pethig R, Bressler V, Carswell Crumpton C, Chen Y, Foster Haje L, García Ojeda ME, Lee RS, Lock GM, Talary MS, Tate KM. Electrophoresis. 2002;23:2057–2063. doi: 10.1002/1522-2683(200207)23:13<2057::AID-ELPS2057>3.0.CO;2-X. [DOI] [PubMed] [Google Scholar]
- 12.Asami K, Takahashi Y, Takashima S. Biochimica et Biophysica Acta (BBA) - General Subjects. 1989;1010:49–55. doi: 10.1016/0167-4889(89)90183-3. [DOI] [PubMed] [Google Scholar]
- 13.Vykoukal DM, Gascoyne PRC, Vykoukal J. Integr. Biol. 2009;1:477–484. doi: 10.1039/b906137a. [DOI] [PubMed] [Google Scholar]
- 14.Bordi F, Cametti C, Rosi A, Calcabrini A. Biochimica et Biophysica Acta (BBA) - General Subjects. 1993;1153:77–88. doi: 10.1016/0005-2736(93)90278-8. [DOI] [PubMed] [Google Scholar]
- 15.Chan KL, Morgan H, Morgan E, Cameron IT, Thomas MR. Biochimica et Biophysica Acta (BBA) - General Subjects. 2000;1500:313–322. doi: 10.1016/s0925-4439(99)00115-5. [DOI] [PubMed] [Google Scholar]
- 16.Hu X, Arnold WM, Zimmermann U. Biochimica et Biophysica Acta (BBA) - General Subjects. 1990;1021:191–200. doi: 10.1016/0005-2736(90)90033-k. [DOI] [PubMed] [Google Scholar]
- 17.Lacy F, Kadima-Nzuji M, Malveaux FJ, Carter EL. IEEE Trans Biomed Eng. 1996;43:218–221. doi: 10.1109/10.481991. [DOI] [PubMed] [Google Scholar]
- 18.Polevaya Y, Ermolina I, Schlesinger M, Ginzburg BZ, Feldman Y. Biochimica et Biophysica Acta (BBA) - General Subjects. 1999;1419:257–271. doi: 10.1016/s0005-2736(99)00072-3. [DOI] [PubMed] [Google Scholar]
- 19.Griffith AW, Cooper JM. Anal. Chem. 1998;70:2607–2612. doi: 10.1021/ac980070c. [DOI] [PubMed] [Google Scholar]
- 20.Vahey MD, Voldman J. Anal. Chem. 2008;80:3135–3143. doi: 10.1021/ac7020568. [DOI] [PubMed] [Google Scholar]
- 21.Evander M, Ricco AJ, Morser J, Kovacs GTA, K. Leung LL, Giovangrandi L. Lab Chip. 2013;13:722–729. doi: 10.1039/c2lc40896a. [DOI] [PubMed] [Google Scholar]
- 22.Hou HW, Wu L, Amador-Munoz DP, Vera MP, Coronata A, Englert JA, Levy BD, Baron RM, Han J. Lab Chip. 2016;16:688–699. doi: 10.1039/c5lc01110h. [DOI] [PMC free article] [PubMed] [Google Scholar]
- 23.Zweig MH, Campbell G. Receiver-Operating Characteristic (Roc) Plots: A Fundamental Evaluation Tool in Clinical Medicine. Clin. Chem. 1993;39:561–577. [PubMed] [Google Scholar]
- 24.Schnelle T, Hagedorn R, Fuhr G, Fiedler S, Müller T. Biochimica et Biophysica Acta (BBA) - General Subjects. 1993;1157:127–140. doi: 10.1016/0304-4165(93)90056-e. [DOI] [PubMed] [Google Scholar]
- 25.Suehiro J, Pethig R. J Phys. D: Appl. Phys. 1998;31:3298. [Google Scholar]
- 26.Müller T, Gradl G, Howitz S, Shirley S, Schnelle T, Fuhr G. Biosensors and Bioelectronics. 1999;14:247–256. [Google Scholar]
- 27.Honegger T, Peyrade D. J Appl. Phys. 2013;113:194702. [Google Scholar]
- 28.Schwan HP. Biological Effects of Non-Ionizing Radiations: Cellular Properties and Interactions. (the Lauriston Taylor Lecture) Ann. Biomed. Eng. 1988;16:245–263. doi: 10.1007/BF02368002. [DOI] [PubMed] [Google Scholar]
- 29.Nivedita N, Papautsky I. Biomicrofluidics. 2013;7:054101. doi: 10.1063/1.4819275. [DOI] [PMC free article] [PubMed] [Google Scholar]


