

Abstract
Background
As mechanisms of neoplasia in patients with ulcerative colitis (UC) remain poorly understood, we sought to identify pathways of carcinogenesis in this high-risk population.
Methods
miRNA and mRNA expression was examined in non-dysplastic rectosigmoid mucosa from UC patients with (n=19) or without remote colon neoplasia (n=23). We developed a method to identify miRNA-regulated pathways based on differentially expressed miRNAs and their putative mRNAs targets in the same samples. One key pathway identified in the analysis, miR-4728-3p regulation of focal adhesion signaling, was further evaluated in vitro as well as through examination of expression in UC-cancers.
Results
There were 101 significantly down-regulated and 97 up-regulated miRNAs (adjusted p<0.05) in the rectal mucosa of UC patients harboring proximal neoplasia. Bioinformatic analysis identified miR-4728-3p as a regulator of 3 proteins involved in focal adhesion signaling, CAV1, THBS2, and COL1A2. Real-time PCR validated down-regulation of miR-4728-3p in non-dysplastic tissue remote from UC-neoplasia as well as in UC-associated colon cancers. miR-4728-3p transfection into colon cancer cells down-regulated expression levels and decreased luciferase activities in cells expressing a wild type 3′ UTR compared to a mutant 3′ UTR for all three genes. Exogenous transfected miR-4728-3p also delayed wound healing and decreased formation of focal adhesion complexes.
Conclusions
Patients with long-standing UC who harbor neoplasia can be identified based on miRNA and mRNA profiles in non-dysplastic tissue. Using a method to analyze miRNA and mRNA expression from the same tissues, we identified that miR-4728-3p is likely an important tumor-suppressor in UC-associated colon carcinogenesis.
Keywords: miRNA, ulcerative colitis, inflammatory bowel disease, focal adhesion, colon cancer, dysplasia
Introduction
Patients with long-standing colonic inflammation secondary to ulcerative colitis (UC) are at increased risk to develop colonic neoplasia. Many clinical risk factors for colorectal neoplasia in this population have been well defined, including long-standing disease, extensive colitis, uncontrolled inflammation, a family history of colorectal cancer (CRC), and primary sclerosing cholangitis (1–5). In contrast, little is known regarding biological mechanisms driving carcinogenesis in ulcerative colitis. Because of this, biological predictors and strategies to prevent neoplasia remain elusive despite recent advances in endoscopic detection of neoplastic lesions.
MicroRNAs (miRNAs) are short non-coding RNAs that bind to the 3′ untranslated region of mRNA and alter protein expression, most frequently by inducing mRNA degradation or inhibiting translation (6). Through these mechanisms, miRNAs are critical to normal cellular function and when altered can contribute to the pathogenesis of multiple diseases, including cancer and inflammatory conditions (7, 8). Along these lines, prior studies indicate that the miRNA profile changes in chronic UC-associated inflammation (9–12). Several small studies have also demonstrated dysregulation of several miRNAs, including miR-31, miR-21, miR-214, and miR-224 in IBD-associated neoplastic tissue (13–16). However, miRNA changes have not been described in non-dysplastic tissue adjacent to a neoplastic lesion. Given their abundance and stability, miRNAs represent good candidates as biomarkers in this high-risk population.
Previous studies have demonstrated that several molecular changes, including aneuploidy, chromosomal instability, p53 mutations, and p53 loss of heterozygosity occur in non-dysplastic mucosa in patients with UC harboring colorectal neoplasia (17–20). Similarly, we reported that UC patients harboring remote dysplasia can be identified based on gene expression profiles in non-dysplastic rectal mucosa (21). As miRNAs are known to regulate over 60% of all genes (22), we hypothesized that a signature of miRNAs obtained from non-dysplastic tissue could be used to identify UC patients harboring remote dysplasia in an independent cohort of patients. We also sought to use concordant miRNA and mRNA expression levels from the same tissue as a tool to uncover miRNA-regulated mechanisms of carcinogenesis in this high-risk population.
Material and Methods
Patient enrollment
A sample size calculation performed prior to subject enrollment based on methodology described by Dobbin and Simon (23) using previously collected gene expression data to estimate variation (21) demonstrated that 42 patients were required to detect a 2-fold change in gene expression between UC patients with and without dysplasia with a significance level α=0.0005 while controlling for false discovery rate (FDR) at 5% level. Enrollment criteria included a previous diagnosis of ulcerative colitis, as confirmed by an expert gastrointestinal pathologist, in patients who had > 8 years of disease duration and quiescent disease at the time of sample collection based on review of their pathology.
A second cohort of patients with ulcerative colitis-associated colon cancer or sporadic colon cancer (n=11/group) were enrolled to evaluate expression of key genes in UC-cancer and adjacent tissues compared to normal controls (normal-appearing tissue adjacent to a sporadic colon cancer). The groups were matched for location of the cancer within the colon. Informed consent was obtained from subjects in both cohorts under University of Chicago IRB #10-209A.
Tissue collection and processing
Tissue samples were obtained at the time of colonoscopy or surgery with biopsies of the rectosigmoid colon (10–20cm proximal to the anus). Tissue obtained at the time of colonoscopy was collected with four jumbo forceps and immediately placed in RNAlater or flash frozen. Tissue from patients with colon cancer was obtained at the time of surgery from the cancer and adjacent tissue. Surgical samples were procured by the Human Tissue Research Core by striping the mucosa shortly following resection of the colon and placed in RNAlater or flash frozen. After 2–4 weeks at 4°C, excess RNAlater was removed, and the tissue was store at −80°C. Tissue was homogenized using the Bullet Blender with RNAase-free beads (Next Advance, Averill Park, New York) and total RNA extracted using the Qiagen Allprep DNA/RNA/miRNA extraction kit (Hilden, Germany). RNA integrity was measured using the Agilent 2100 Bioanalyzer. All samples used in the analysis had a RNA integrity number >6.
Array Analysis
miRNA expression was evaluated using 400ng of total RNA with the miRCURY 7th generation LNA-based array (Exiqon, Denmark) per the manufacturer’s specifications. The quantified signals were background corrected and normalized using the global Lowess (LOcally WEighted Scatterplot Smoothing) regression algorithm(24). Messenger RNA (mRNA) was analyzed using the Illumina HumanHT-12 v4 BeadChip. Normalization and two-group comparison for both miRNA and mRNA datasets were performed using the R/Bioconductor package ‘limma’ (25). P values were based on moderated t-statistics and adjusted for multiple testing (26). Functional enrichment analysis of the identified differentially expressed genes or self-organizing map clusters was performed using Onto-Express software (http://vortex.cs.wayne.edu/projects.htm#Onto-Express).
miRNA target prediction
Co-variance across samples of the differentially expressed miRNA and mRNA was assessed. The co-variances were then transformed into a Topological Overlap Matrix, and a correlative network was constructed using the method by Horvath and Zhang (27). Hierarchical clustering was used to assemble the network into modules, which were then separately assessed for enrichment in Gene Ontology annotations for molecular functions and biological processes. Genes that belonged to these ontologies and were in the same module as miRNAs that were potential regulators (as predicted by TargetScan v6.2) were identified. These genes were then analyzed for their locations on Kyoto Encyclopedia of Genes and Genomes (KEGG) pathways, to assess their potential important functional roles in regulatory sub-networks.
Real Time PCR
For miRNA PCR, cDNA was prepared from 250ng total RNA, using the Universal cDNA Synthesis Kit (Exiqon). Primers for miR-4728-3p and RNU48 were designed and synthesized by Exiqon. Quantitative real-time reverse transcription-polymerase chain reaction (qPCR) was performed with the Roche Light Cycler 480 (Roche, Indianapolis, IN) using the ExiLENT SYBR® Green master mix (Exiqon). For mRNA PCR, cDNA was prepared from 150ng total RNA using the High-Capacity cDNA Reverse Transcription Kit with RNase Inhibitor (Life Technologies). To measure transcript expression of erb-b2 receptor tyrosine kinase 2 (ERBB2), caveolin-1 (CAV1), thrombospondin-2 (THBS2), and collagen 1 alpha 2 (COL1A2), primers were synthesized by IDT, and qPCR performed following cDNA synthesis using the Fast SYBR Green Master Mix in the Roche Light Cycler 480. The following primers were utilized: CAV1 (F: CCTCAACGATGACGTGGTCAA, R: TCGTCACAGTGAAGGTGGTGAAG), COL1A2 (F: ACTGTAAGAAAGGGCCCAGC, R: CAGCAGGTCCTTGGAAACCT), ERBB2 (F: GTCCTTCCTGCAGGATATCCA, R: CACTTGGTTGTGAGCGATGAG), and THBS2 (F: CGTGGACAATGACCTTGTTG, R: GCCATCGTTGTCATCATCAG). Results were normalized to RNU48 for miRNA and beta actin for mRNA, and comparisons were made between groups using the 2−ΔΔCT method(28).
Cell Culture
HCT116, CaCo2, HT29, and RKO colon cancer cells were obtained from ATCC and authenticated by short tandem repeat analysis (29). miRNA transfection experiments were conducted on pre-confluent cells. HCT116 cells were seeded on 6 well plates and transfected the following day with 50 nM of mature miR-4728-3p or control oligonucleotides (Ambion) and cells harvested 24 hrs later to examine protein expression. HT29, CaCO2, and RKO cells were seeded on 6 well plates and transfected 24 hours later with 50nM of miR-4728-3p or control oligonucleotides, then treated 48 hours later with 4ng/mL of TGFβ1, and 72 hours later with 50nM of miR-4728-3p or control, and harvested 24 hours after the final transfection. TGFβ1 treatment was used in these experiments to increase baseline expression of the proteins of interest.
A cDNA was designed to contain the putative binding site for miR-4728-3p in the 3′ untranslated region (UTR) or a mutated seed sequence for CAV1 (72bp), COL1A2 (80bp), and THBS2 (232bp). cDNA containing either the wild-type or mutant 3′UTR for each gene was inserted in a pmirGLO dual-luciferase vector (Promega, Madison, WI). HCT116 cells were transfected with the vector containing the wildtype or mutant 3′UTR of CAV1, COL1A2, and THBS2. Cells were then transfected with a mature mimic of miR-4728-3p (Thermo Fisher Scientific, Waltham, MA) and harvested 48 hours later. Firefly luciferase activity was normalized to renilla expression and differences in expression between groups was assessed using the Student’s T-test.
To assess wound healing, HCT116 cells were plated in a monolayer on a 50mm 6 well dish coated with collagen and transfected with 50nM of miR-4728-3p or a scrambled probe (n=6). Forty-eight hours after transfection, a linear scratch in the monolayer was performed. Photos were taken to measure the migration of cells using the Olympus IX81 Inverted Widefield Microscope every 3 hours for 24 hours. The gap distance was quantitatively evaluated using ImageJ [http://imagej.nih.gov/ij/] and mean percent gap closure was compared between treatment groups using a two-sample T test.
To assess the effects of miR-4728 on focal adhesions, HCT116 cells were plated on collagen-coated dishes and transfected with 50nM of miR-4728-3p or a scrambled probe. Forty-eight hours later, cells were fixed, permeabilized, and blocked. Primary anti-vinculin antibody (1:250, Sigma Aldrich, St. Louis, MO) was added to cells and incubated for 1 hour at room temperature to stain focal adhesions. Alexafluor anti-mouse 488 secondary antibody (Life Technologies) was diluted to a concentration of 1: 250 for a 30-minute incubation period at room temperature. Double labeling of actin filaments with TRICTC-conjugated phalloidin (1:250, Sigma Aldrich) was performed simultaneously for 30 minutes at room temperature at dilution recommended by the manufacturer. Samples were visualized in PBS using Leica GSD/TIRFM Ground State Depletion Superresolution Microscope. Intensity and areas of focal adhesion complexes were quantified using the Focal Adhesion Analysis Server (30).
Western Blotting
Protein extraction and Western blotting were performed as previously described (31). Primary antibodies were diluted to 1:100 for CAV1 (Santa Cruz Biotechnology), 1:500 for COL1A2 (Novus Biologicals), 1:200 for THBS2 (Santa Cruz Biotechnology), and 1:5000 for beta actin (Sigma Aldrich). Anti-mouse (beta actin), anti-goat (THBS2), and anti-rabbit (CAV1, COL1A2) secondary antibodies were used at a concentration of 1:300 (Santa Cruz Biotechnology). Proteins were visualized by xerography on XOMAT™ AR film using an enhanced chemiluminescence system. Xerograms were digitized with an Epson flat-bed scanner and ImageJ software was used to quantify expression. A Student’s T-test was used to compare protein expression between treatment groups.
Immunohistochemistry
Immunostaining was performed on surgical samples obtained at colectomy from normal controls, UC-associated colon cancer, and adjacent non-dysplastic ulcerative colitis mucosa as previously described (21). Antigen retrieval was performed with 0.01 mol/L citrate buffer (pH 6) in a steamer for 20 min, and tissues stained with primary antibodies for CAV1 (1:200), COL1A2 (1:75), and THBS2 (1:50). Envison dual-link system-HRP (Dako, Glostrup Municipality, Denmark) was used for detection of primary antibodies to CAV1 and COL1A2 or 1:500 anti-goat IgG (R and D systems, Minneapolis, MN) for detection of antibodies to THBS2 and slides were stained with DAB to assess protein expression levels and localization.
Results
Subjects
Nineteen subjects with neoplastic lesions and 23 subjects without neoplasia were included in the analysis. Of the patients with neoplasia, 11 had neoplasia located in the left colon alone, 6 in the right colon alone, and 2 had neoplastic lesions in both the right and left colon. Four of these subjects had unresectable flat low-grade dysplasia, 7 had high-grade dysplasia, and 8 had colorectal cancers as the most severe histology in the colon. As shown in Table 1, there were no significant differences in the sex, race, ethnicity, age, disease duration, disease extent, or medication usage between those with neoplastic lesions and those without neoplasia.
Table 1.
Demographic and disease-specific characteristics of subjects included in the analysis.
| UC with neoplasia (n=19) | UC without neoplasia (n=23) | |
|---|---|---|
| Sex | ||
| Female | 5 (26%) | 11(48%) |
| Male | 14 (74%) | 12(52%) |
|
| ||
| Race | ||
| African American | 2 (11%) | 2 (9%) |
| Asian | 1 (5%) | 1 (4%) |
| Caucasian | 16 (84%) | 20(87%) |
|
| ||
| Ethnicity | ||
| Hispanic | 0 | 2 (9%) |
| Not Hispanic | 19 (100%) | 21 (91%) |
|
| ||
| Median Age (IQR) | 49.1 years (40.4–59.3) | 51.7 years (38.5–57.1) |
|
| ||
| Median Disease | 17.3 (12.9–23.7) | 22.1 years (13–33.3) |
| Duration | ||
|
| ||
| PSC | 3 (16%) | 0 |
|
| ||
| Medications | ||
| Mesalamine | 12 | 15 |
| Immunomodulator | 2 | 6 |
| Anti-TNF | 0 | 4 |
| Anti-integrin | 1 | 0 |
| None | 4 | 1 |
|
| ||
| Disease Extent | ||
| Left-sided | 3 (16%) | 5 (22%) |
| Pancolitis | 16 (84%) | 18 (78%) |
mRNA Analysis
As shown in Figure 1A, there was clear separation between the two groups using two-way unsupervised hierarchical clustering. There were, however, two subjects with neoplasia who clustered with the group without neoplasia and two subjects without neoplasia who clustered with the groups with neoplasia based on mRNA expression. There were 117 significantly up-regulated genes and 62 significantly down-regulated genes with a |logFC| > 1 and an adjusted p-value <0.05 in IBD patients harboring proximal neoplasia compared to those without neoplasia. Expression of mRNAs included in the array analysis is presented in Supplementary Table 1. In total, there were 62 significantly up-regulated and 7 significantly down-regulated gene ontology pathways in IBD patients harboring proximal neoplasia (p<0.05; Supplementary Tables 2 and 3) The top 12 enriched Gene Ontology and KEGG pathways in IBD-neoplasia are listed in Figure 1B.
Figure 1. mRNAs and miRNAs are differentially expressed in nondysplastic rectal mucosa from patients with ulcerative colitis who harbor remote neoplasia.
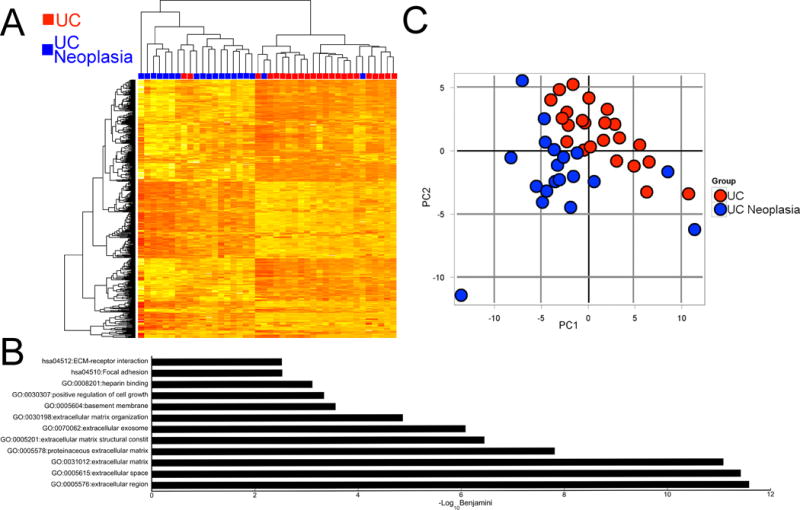
A) Heat map representing two-way unsupervised hierarchical clustering of global mRNA array data. Genes included in the heatmap had an interquartile range across samples of >1. The red squares represent UC patients without neoplasia and the blue squares represent UC patients harboring a proximal neoplastic lesion. B) The top 12 enriched Gene Ontology and KEGG pathways that were enriched in UC patients harboring remote neoplasia. C) Principal component analysis of global miRNA expression. Each red circle represents a UC patient without neoplasia and each blue circle represents a single UC patient harboring remote neoplasia.
miRNA Analysis
The phenotypic groups also clustered by global miRNA expression profile as demonstrated by PCA analysis (Figure 1C). There were 198 significantly dysregulated miRNAs between UCN and UC (adjusted p value <0.05). Of these, 97 were down-regulated and 101 were up-regulated. A list of the top 50 dysregulated miRNAs is shown in Table 2, and expression of all miRNAs included in the array analysis is presented in Supplementary Table 4.
Table 2.
Top 50 dysregulated miRNAs as assessed by array analysis between UC harboring neoplasia and UC without neoplasia based on the calculated adjusted P value.
| microRNA | LogFC | P | Adj P | microRNA | LogFC | P | Adj P |
|---|---|---|---|---|---|---|---|
| hsa-miR-4521 | −0.597 | 9.98E-08 | 3.95E-05 | hsa-miR-3621 | 0.71 | 6.73E-05 | 1.60E-03 |
| hsa-miR-642b-3p | 0.810 | 1.28E-07 | 3.95E-05 | hsv2-miR-H7-5p | 0.84 | 7.42E-05 | 1.69E-03 |
| hsa-miR-4497 | 0.884 | 3.66E-07 | 7.53E-05 | hsa-miR-144-3p | 1.22 | 1.04E-04 | 2.28E-03 |
| hsa-miR-210 | −0.619 | 1.32E-06 | 2.03E-04 | hsa-miR-4531 | 0.60 | 1.11E-04 | 2.34E-03 |
| hsa-miR-204-3p | 0.767 | 3.20E-06 | 3.95E-04 | hsa-miR-4653-3p | 0.91 | 1.14E-04 | 2.34E-03 |
| hsa-miR-193a-3p | 0.736 | 6.19E-06 | 5.61E-04 | hsa-miR-3654 | −0.39 | 1.35E-04 | 2.69E-03 |
| hsv2-miR-H7-3p | −0.901 | 6.36E-06 | 5.61E-04 | hsa-miR-551a | 0.28 | 1.66E-04 | 3.20E-03 |
| hsa-miR-3178 | 0.749 | 7.86E-06 | 6.07E-04 | hsa-miR-25-5p | 0.42 | 1.72E-04 | 3.22E-03 |
| ebv-miR-BART13-3p | 0.628 | 1.20E-05 | 6.77E-04 | hsa-miR-4728-3p | −0.42 | 1.92E-04 | 3.48E-03 |
| hsv1-miR-H7-3p | −0.942 | 1.21E-05 | 6.77E-04 | hsv1-miR-H18 | 0.42 | 2.10E-04 | 3.61E-03 |
| hsv2-miR-H25 | −0.743 | 1.19E-05 | 6.77E-04 | SNORD3@ | 0.44 | 2.11E-04 | 3.61E-03 |
| hsa-miR-99a-5p | 1.026 | 1.53E-05 | 7.87E-04 | hsa-miR-4290 | −0.47 | 2.31E-04 | 3.76E-03 |
| hsa-miR-3646 | 0.712 | 1.66E-05 | 7.88E-04 | hsa-miR-874 | 0.33 | 2.25E-04 | 3.76E-03 |
| hsa-miR-4788 | 1.092 | 1.98E-05 | 8.74E-04 | hsa-miR-100-5p | 0.72 | 2.77E-04 | 4.31E-03 |
| hsa-miR-125b-5p | 1.140 | 2.92E-05 | 1.07E-03 | hsa-miR-452-5p | 0.21 | 2.80E-04 | 4.31E-03 |
| hsa-miR-3685 | 1.236 | 2.85E-05 | 1.07E-03 | hsa-miR-4484 | 0.74 | 3.22E-04 | 4.73E-03 |
| hsv1-miR-H14-3p | 0.204 | 2.96E-05 | 1.07E-03 | hsa-miR-574-5p | −0.27 | 3.22E-04 | 4.73E-03 |
| hsa-miR-5581-3p | −0.433 | 3.39E-05 | 1.16E-03 | hsa-miR-2113 | 0.51 | 3.40E-04 | 4.87E-03 |
| hsa-miR-711 | 0.461 | 3.86E-05 | 1.25E-03 | hsa-miR-140-5p | 0.40 | 4.29E-04 | 5.29E-03 |
| hsa-miR-147b | −0.457 | 4.30E-05 | 1.33E-03 | hsa-miR-1908 | −0.57 | 4.36E-04 | 5.29E-03 |
| hsa-miR-126-5p | 0.646 | 6.25E-05 | 1.54E-03 | hsa-miR-200c-3p | −0.94 | 4.37E-04 | 5.29E-03 |
| hsa-miR-183-3p | 0.571 | 5.79E-05 | 1.54E-03 | hsa-miR-3195 | 0.27 | 4.26E-04 | 5.29E-03 |
| hsa-miR-4285 | −0.700 | 5.95E-05 | 1.54E-03 | hsa-miR-4268 | −0.52 | 3.94E-04 | 5.29E-03 |
| hsa-miR-4300 | −0.29 | 6.23E-05 | 1.54E-03 | hsa-miR-4635 | 0.50 | 4.31E-04 | 5.29E-03 |
| hsa-miR-451a | 1.91 | 5.25E-05 | 1.54E-03 | hsa-miR-5580-5p | −0.35 | 3.93E-04 | 5.29E-03 |
Bioinformatics analysis identified miR-4728-3p as a key dysregulated miRNA involved in focal adhesion complexes that is down-regulated remotely in patients with UC neoplasia
Dysregulated mRNAs were grouped into modules based on functional annotation. Genes that belonged to these modules that were identified as predicted targets of dysregulated miRNA were identified. In this analysis, three genes in the focal adhesion pathway, caveolin-1 (CAV1), collagen 1 (COL1A2), and thrombospondin-2 (THBS2), all of which were up-regulated, were predicted to be targets of miR-4728-3p, which was significantly down-regulated in the rectal mucosa of UC patients harboring proximal neoplasia. As the focal adhesion pathway was one of the most significantly enriched KEGG pathway in the mucosa of UC patients with neoplasia (Figure 1B), we focused on the interaction between miR-4728-3p and these three genes in additional experiments. In a correlation analysis, expression of miR-4728-3p was inversely related to all three genes as measured in the microarray: CAV1 (r=−0.42, p=0.005), COL1A2 (r=−0.48, p=0.001) and THBS2 (r=−0.51, p<0.001) (Figures 2A–C).
Figure 2. miR-4728-3p is decreased, whereas target genes CAV1, COL1A2, and THBS2 are increased in IBD patients with neoplasia.
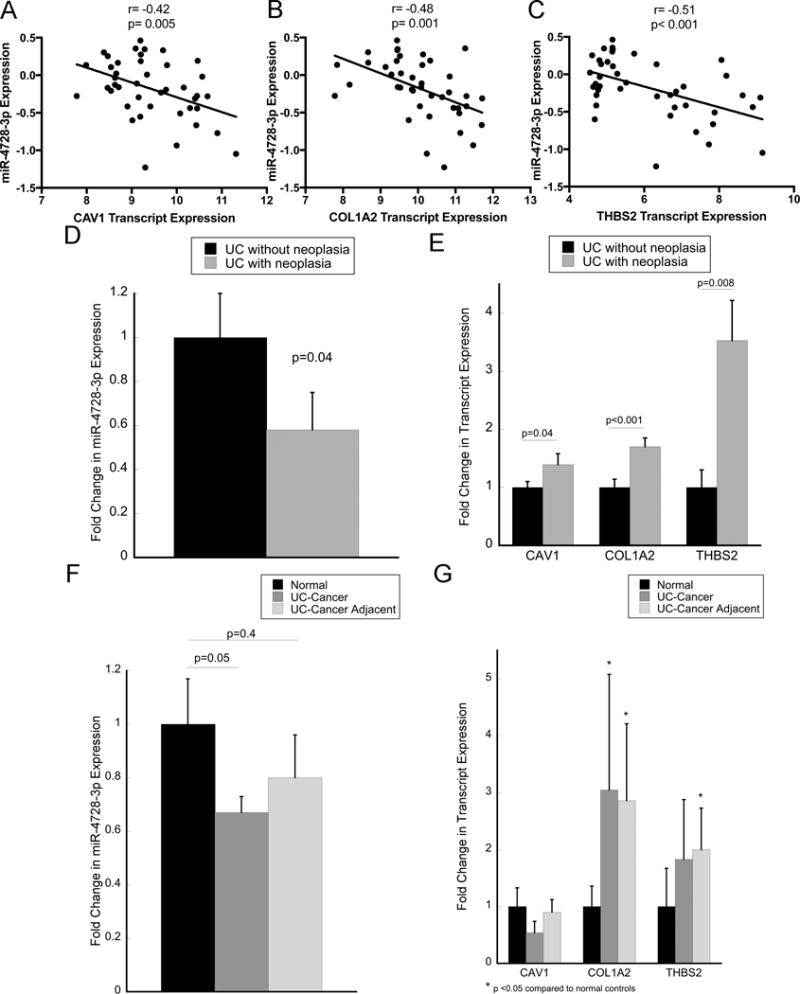
Expression correlation between miR-4728-3p and CAV1 (A), COL1A2 (B), and THBS2 (C) by microarray analysis. Quantitative real-time PCR was performed to validate expression of miR-4728-3p (D) as well as CAV1, COL1A2, and THBS2 (E) in the same 42 patients analyzed by microarray. Quantitative real-time PCR was also performed in 11 UC-associated cancers, nondysplastic adjacent tissue, and normal-appearing control tissues for miR-4728-3p (F) as well as CAV1, COL1A2, and THBS2 (G). Error bars represent standard error of the mean.
Expression of miR-4728-3p, CAV1, COL1A2, and THBS2 were validated in the same patient samples by real-time PCR. Compared to subjects without neoplasia, miR-4728-3p was down-regulated 1.7-fold (p=0.04, Figure 2D), whereas CAV1 (1.4-fold increased, p=0.04), COL1A2 (1.7-fold increased, p=0.008), and THBS2 (3.5-fold increased, p<0.001) were all increased in subjects harboring a proximal neoplastic lesion (Figure 2E).
miR-4728-3p is down-regulated, and COL1A2 and THBS2 are upregulated in UC-associated cancers and adjacent non-dysplastic tissue
The expression of miR-4728-3p was subsequently evaluated in an independent cohort of 11 ulcerative colitis-associated colon cancers, nondysplastic UC-tissue adjacent to the same colon cancers, and 11 normal controls (normal-appearing tissue adjacent to sporadic colon cancers). Patient demographics and site of sample collection for this analysis is included in supplementary table 5. Compared to normal tissue, miR-4728-3p was decreased 1.67-fold in UC-associated cancer (p=0.05) and 1.25-fold in non-dysplastic tissue adjacent to the cancer (p=n.s) (Figure 2F). COL1A2 was increased 3.1-fold (p=0.04) in UC-associated cancer and 2.9-fold (p=0.02) in non-dysplastic adjacent tissue compared to normal tissue. In agreement, THBS2 was trended towards increased expression (1.8-fold; p=0.1) in UC-associated cancer and 2-fold in adjacent tissue (p=0.03). In contrast, CAV1 expression was not altered in UC-associated neoplastic tissue compared to normal (Figure 2G). By immunohistochemistry, expression of all 3 proteins appeared to be localized predominantly to stromal components in normal tissue. In UC-cancer, intensity was increased overall for both CAV1 and COL1A2. In addition, there was positive staining of all 3 proteins in both the stroma and cancer cells in the UC-associated cancers (supplementary figure 1)
miR-4728-3p targets CAV1, CO1A2, and THBS2
HCT116, HT29, CaCo2, or RKO human colon cancer cells were chosen for miRNA transfection experiments based on adequate baseline expression of the protein of interest. Following transfection of miR-4728-3p, CAV1 expression decreased 2.3-fold in HCT116 cells (p<0.001) and 1.6-fold in CaCo2 cells (p=0.01), COL1A2 decreased 1.4-fold in HT29 (p=0.01) and 1.5-fold in RKO cells (p<0.001), and THBS2 was decreased 1.5-fold in HT29 (p=0.1) and down-regulated 1.4-fold (p=0.1) in CaCo2 cells (Figure 3A and 3B). HCT116 cells were co-transfected with the miRNA and either wild type or mutant 3′UTR of the 3 target genes. Following this, luciferase activity significantly decreased in miR-4728-3p treated cells transfected with the wild type 3′UTR compared to the mutant 3′UTR for all three genes (Figure 3C).
Figure 3. miR-4728-3p targets CAV1, COL1A2, and THBS2, decreases cellular migration, and controls focal adhesion complexes in colon cancer cells.
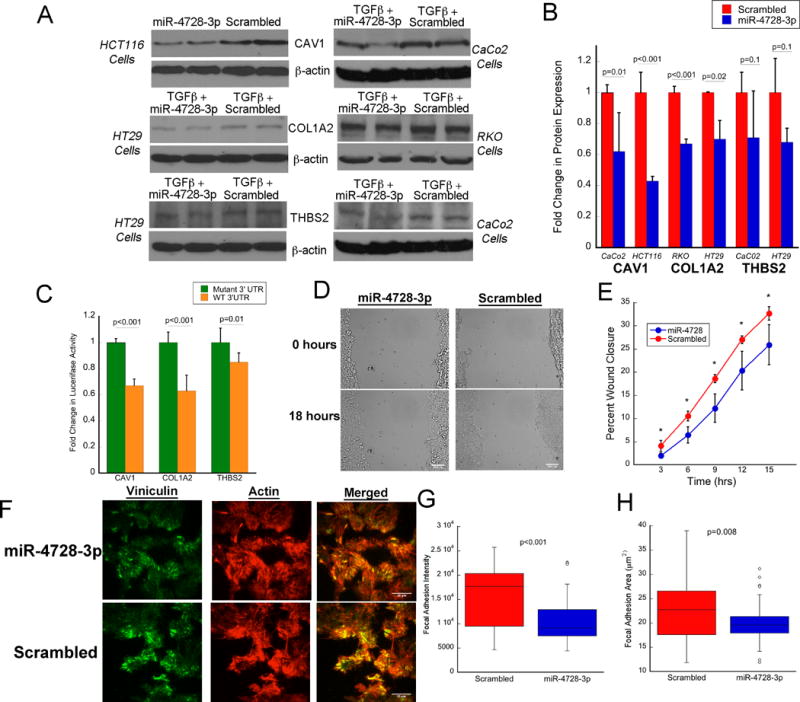
A) Representative Western blots and B) quantitative expression by densitometry of CAV1, COL1A2, and THBS2 in the indicated colon cancer cell line following transfection with miR-4728-3p or scrambled oligo (n=3/treatment group). C) Firefly luciferase activity after transfection with miR-4728-3p and following treatment of indicated genes regulated by wild type or mutant 3′UTR (n=6/treatment group). To control for transfection efficiency, firefly luciferase activity was normalized to renilla luciferase activity. D) Representative images of wound healing in HCT116 cells treated with miR-4728-3p or a scrambled probe. E) Quantitative measurement of cell migration to assess wound closure in HCT116 cells treated with miR-4728-3p or a scrambled probe (values are means ± SD of 3 independent platings). F) Representative immunofluorescence images of vinculin and actin to assess focal adhesion complexes and actin cytoskeleton in HCT116 cells following treatment with miR-4728-3p or a scrambled probe. G) Focal adhesion intensity and H) area following treatment with miR-4728-3p or a scrambled probe (n=3 wells with 12 measurements each/treatment group). Error bars represent standard deviation.
miR-4728-3p decreases cellular migration and reduces focal adhesion complexes
In order to examine the functional properties of miR-4728-3p, cellular migration and focal adhesion complexes were assessed following transfection of the miRNA or a scrambled oligonucleotide in HCT116 colon cancer cells. As shown in a representative image in Figure 3D, transfection of miR-4728-3p delayed wound healing as assessed by delayed migration in the in vitro scratch test. At each 3-hour time point between 3 hrs and 15 hrs following transfection, miR-4728-3p significantly decreased wound closure (p<0.05) (n=3/group) (Figure 3E).
Levels of viniculin and actin were measured immunofluorescence staining to assess focal adhesion area and expression (i.e., intensity) (Figure 3F) in HCT116 cells, 48 hours after treatment with miR-4728-3p or a scrambled probe. miR-4728-3p decreased focal adhesion intensity (p<0.001, Figure 3G) and area (p=0.008, Figure 3H) compared to cells transfected with a scrambled probe (n=3/group).
miR-4728-3p is expression is correlated with expression of ERBB2
miR-4728-3p is located within an intron of the ERBB2 gene. As such, it is hypothesized that these two genes are co-transcribed. In order to explore the relationship between miR-4728-3p expression and that of ERBB2, we examined ERBB2 expression by real time PCR. Similar to miR-4728-3p, ERBB2 was down-regulated 3.3-fold (p<0.001) in UC patients harboring a remote neoplastic lesion (Figure 4A). In addition, there was a direct correlation within samples between transcript expression by qPCR of the miRNA and expression of ERBB2 (r=0.51, p<0.001) (Figure 4B).
Figure 4. Expression levels of miR-4728-3p and ERBB2 are correlated.
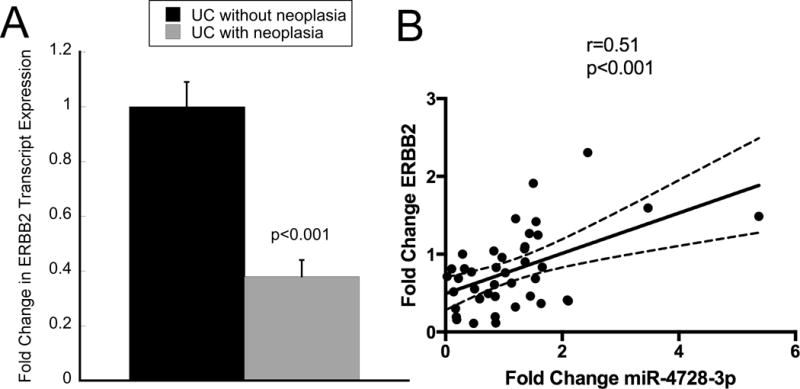
Expression of ERBB2 was analyzed as miR-4728-3p is located in an intron in the ERBB2 gene. A) ERBB2 expression by quantitative real-time PCR from nondysplastic rectal mucosa in ulcerative colitis patients harboring proximal neoplasia compared to those without neoplasia. B) Correlation analysis comparing PCR transcript expression of miR-4728-3p to ERBB2. Fold Change is expressed for each individual patient compared to the mean of expression of subjects without neoplasia. Error bars represent standard error of the mean.
Discussion
Prior studies have reported the occurrence of several molecular and genetic changes in nondysplastic mucosa remote from a neoplastic lesion in patients with long-standing ulcerative colitis (17–20). Similarly, we previously described gene expression changes occurring in the rectal mucosa of patients harboring a remote (proximal) neoplastic lesion (21). The current study validates many of the previously identified dysregulated genes in an independent and larger cohort of patients. In addition, we demonstrate for the first time that miRNA expression changes likewise occur in non-dysplastic mucosa that could successfully identify UC patients who harbor more proximal neoplastic lesions. Given miRNA stability, including in formalin-fixed paraffin-embedded tissues, and the fact that they can be accurately quantified by multiple methods, miRNAs are attractive biomarkers for clinical use. As such, miRNAs with altered expression in nondysplastic mucosa from UC patients harboring a remote neoplastic lesion have the potential to be used to risk-stratify individuals with long-standing ulcerative colitis.
As miRNAs are key mediators in many cellular processes, identification of miRNA-regulated pathways could also provide insights into the pathogenesis of neoplasia in the setting of chronic inflammation. Previous work has demonstrated dysregulation of several miRNAs, including miR-31, miR-21, miR-214, and miR-224 in IBD-associated neoplastic tissue (13–16). Although we did not examine these miRNAs in neoplastic tissue, we did identify significant up-regulation of miR-31, 21, and 214 in non-dysplastic mucosa in patients who harbor proximal neoplasia compared to patients without neoplasia (Supplementary Table 4). In this study, we focused on the functional importance of miR-4728-3p based on its predicted regulation of the focal adhesion pathway and report on the down-regulation of the miRNA as well as provide in vivo and in vitro supporting data that this miRNA negatively regulates focal adhesion complexes in UC patients harboring neoplasia. Three genes involved in focal adhesion complexes, CAV1, COL1A2, and THBS2, were up-regulated in UC patients harboring remote neoplasia as well as UC-associated cancer (32–34). In addition, these genes exhibited inverse expression levels compared to miR-4728-3p in the same tissues, and were confirmed experimentally as direct targets of miR-4728-3p in colon cancer cells. Focal adhesion complexes mediate intracellular signaling by binding to the extracellular matrix, a process that increases cancer cell adhesion, migration, and invasion (35–37). The focal adhesion pathway was one of the most significantly enriched genomic pathway in UC patients harboring proximal neoplasia. Hence, the fact that miR-4728-3p regulates focal adhesion complexes and cell migration supports its role as a tumor suppressor in ulcerative colitis.
miR-4728-3p is located within an intron in the unspliced ERRB2 precursor mRNA. Although little is known regarding the function of miR-4728-3p in cancer, previous work in breast cancer has demonstrated a strong correlation between miR-4728-3p expression and HER2 status (38–40). Similarly, we found that expression of miR-4728-3p was highly correlated with that of ERBB2 in our analysis. Although ERBB2 has been described to have oncogenic properties, we demonstrated that expression was significantly down-regulated in UC patients who harbored neoplastic lesions. This is consistent with findings from previous studies which concluded that a low percentage of sporadic colon cancers are HER2 positive as well as a recently published analysis that identified a low rate of ERBB2-activating mutations in IBD-associated neoplasia (41–43).
This study had several limitations. In our analysis, we identified concordant changes in miR-4728-3p and target genes in tissue remote from neoplastic lesions. Although these findings are consistent with the notion of field effects or field cancerization that is supported in colonic tumorigenesis and applicable for biomarker discovery, we are not able to demonstrate clear causality in the development of neoplasia involving this miRNA-regulated pathway. In addition, we were unable to evaluate time-dependent changes in expression or the predictive nature of miR-4728-3p or that of its putative targets in patients with long-standing ulcerative colitis. Although the two patient groups did not show a significant difference in medication usage or disease-specific variables, the impact of these factors on miRNA expression could not be assessed secondary to the sample size. As such, these findings will need to be validated in a larger independent cohort of patients. To address causality, we will also need to follow levels of this miRNA over time with serial biopsies preceding neoplastic transformation. To our knowledge, there is no data examining the functional properties of CAV1, COL1A2, or THBS2 on mucosal inflammation or carcinogenesis in IBD. As such, future studies will focus on examining if each of these genes individually mediate the impact of miR-4728-3p on cellular focal adhesions and tumor growth.
In conclusion, we have identified miRNA and mRNA changes that occur in the non-dysplastic distal colonic mucosa of patients with long-standing ulcerative colitis who harbor more proximal neoplastic lesions. Although our results will need to be confirmed in a larger prospective analysis, these findings have the potential to be used clinically as a less invasive method for improved detection and risk-stratification in patients with IBD. The miR-4728-3p pathway, regulating focal adhesion complexes and occurring as a field effect in UC-associated colonic neoplasia, may be useful as a biomarker and a chemopreventive target as it may both disclose underlying neoplastic transformation and drive further neoplastic progression.
Supplementary Material
Supplementary Figure 1. CAV1, COL1A2, and THBS2 expression in UC-associated neoplasia. Immunostaining was performed for the indicated proteins in normal controls, UC-associated cancer, and non-dysplastic adjacent mucosa as described in the Methods. Note the higher expression levels of these proteins in adjacent and cancers compared to controls. Images are taken at 10× magnification.
Acknowledgments
Crohn’s and Colitis Foundation of America, National Institutes of Health, P30DK42086, K08DK090152 (JP)
Footnotes
Conflicts of interest: The authors declare no potential conflicts of interest
References
- 1.Beaugerie L, Svrcek M, Seksik P, et al. Risk of colorectal high-grade dysplasia and cancer in a prospective observational cohort of patients with inflammatory bowel disease. Gastroenterology. 2013;145:166–175 e168. doi: 10.1053/j.gastro.2013.03.044. [DOI] [PubMed] [Google Scholar]
- 2.Rutter M, Saunders B, Wilkinson K, et al. Severity of inflammation is a risk factor for colorectal neoplasia in ulcerative colitis. Gastroenterology. 2004;126:451–459. doi: 10.1053/j.gastro.2003.11.010. [DOI] [PubMed] [Google Scholar]
- 3.Gupta RB, Harpaz N, Itzkowitz S, et al. Histologic inflammation is a risk factor for progression to colorectal neoplasia in ulcerative colitis: a cohort study. Gastroenterology. 2007;133:1099–1105. doi: 10.1053/j.gastro.2007.08.001. quiz 1340–1091. [DOI] [PMC free article] [PubMed] [Google Scholar]
- 4.Shetty K, Rybicki L, Brzezinski A, et al. The risk for cancer or dysplasia in ulcerative colitis patients with primary sclerosing cholangitis. Am J Gastroenterol. 1999;94:1643–1649. doi: 10.1111/j.1572-0241.1999.01156.x. [DOI] [PubMed] [Google Scholar]
- 5.Bergeron V, Vienne A, Sokol H, et al. Risk factors for neoplasia in inflammatory bowel disease patients with pancolitis. Am J Gastroenterol. 2010;105:2405–2411. doi: 10.1038/ajg.2010.248. [DOI] [PubMed] [Google Scholar]
- 6.Bartel DP. MicroRNAs: genomics, biogenesis, mechanism, and function. Cell. 2004;116:281–297. doi: 10.1016/s0092-8674(04)00045-5. [DOI] [PubMed] [Google Scholar]
- 7.Croce CM. Oncogenes and cancer. N Engl J Med. 2008;358:502–511. doi: 10.1056/NEJMra072367. [DOI] [PubMed] [Google Scholar]
- 8.Chapman CG, Pekow J. The emerging role of miRNAs in inflammatory bowel disease: a review. Therap Adv Gastroenterol. 2015;8:4–22. doi: 10.1177/1756283X14547360. [DOI] [PMC free article] [PubMed] [Google Scholar]
- 9.O’Connell RM, Taganov KD, Boldin MP, et al. MicroRNA-155 is induced during the macrophage inflammatory response. Proc Natl Acad Sci U S A. 2007;104:1604–1609. doi: 10.1073/pnas.0610731104. [DOI] [PMC free article] [PubMed] [Google Scholar]
- 10.Wu F, Zikusoka M, Trindade A, et al. MicroRNAs are differentially expressed in ulcerative colitis and alter expression of macrophage inflammatory peptide-2 alpha. Gastroenterology. 2008;135:1624–1635 e1624. doi: 10.1053/j.gastro.2008.07.068. [DOI] [PubMed] [Google Scholar]
- 11.Pekow JR, Dougherty U, Mustafi R, et al. miR-143 and miR-145 are downregulated in ulcerative colitis: Putative regulators of inflammation and protooncogenes. Inflamm Bowel Dis. 2011 doi: 10.1002/ibd.21742. [DOI] [PMC free article] [PubMed] [Google Scholar]
- 12.Pekow JR, Kwon JH. MicroRNAs in inflammatory bowel disease. Inflamm Bowel Dis. 2011 doi: 10.1002/ibd.21691. [DOI] [PMC free article] [PubMed] [Google Scholar]
- 13.Olaru AV, Selaru FM, Mori Y, et al. Dynamic changes in the expression of MicroRNA-31 during inflammatory bowel disease-associated neoplastic transformation. Inflamm Bowel Dis. 2011;17:221–231. doi: 10.1002/ibd.21359. [DOI] [PMC free article] [PubMed] [Google Scholar]
- 14.Kanaan Z, Rai SN, Eichenberger MR, et al. Differential microRNA expression tracks neoplastic progression in inflammatory bowel disease-associated colorectal cancer. Hum Mutat. 2012;33:551–560. doi: 10.1002/humu.22021. [DOI] [PMC free article] [PubMed] [Google Scholar]
- 15.Svrcek M, El-Murr N, Wanherdrick K, et al. Overexpression of microRNAs-155 and 21 targeting mismatch repair proteins in inflammatory bowel diseases. Carcinogenesis. 2013;34:828–834. doi: 10.1093/carcin/bgs408. [DOI] [PubMed] [Google Scholar]
- 16.Olaru AV, Yamanaka S, Vazquez C, et al. MicroRNA-224 negatively regulates p21 expression during late neoplastic progression in inflammatory bowel disease. Inflammatory bowel diseases. 2013;19:471–480. doi: 10.1097/MIB.0b013e31827e78eb. [DOI] [PMC free article] [PubMed] [Google Scholar]
- 17.Rubin CE, Haggitt RC, Burmer GC, et al. DNA aneuploidy in colonic biopsies predicts future development of dysplasia in ulcerative colitis. Gastroenterology. 1992;103:1611–1620. doi: 10.1016/0016-5085(92)91185-7. [DOI] [PubMed] [Google Scholar]
- 18.Brentnall TA, Crispin DA, Rabinovitch PS, et al. Mutations in the p53 gene: an early marker of neoplastic progression in ulcerative colitis. Gastroenterology. 1994;107:369–378. doi: 10.1016/0016-5085(94)90161-9. [DOI] [PubMed] [Google Scholar]
- 19.Chen R, Rabinovitch PS, Crispin DA, et al. DNA fingerprinting abnormalities can distinguish ulcerative colitis patients with dysplasia and cancer from those who are dysplasia/cancer-free. Am J Pathol. 2003;162:665–672. doi: 10.1016/S0002-9440(10)63860-6. [DOI] [PMC free article] [PubMed] [Google Scholar]
- 20.Rabinovitch PS, Dziadon S, Brentnall TA, et al. Pancolonic chromosomal instability precedes dysplasia and cancer in ulcerative colitis. Cancer Res. 1999;59:5148–5153. [PubMed] [Google Scholar]
- 21.Pekow J, Dougherty U, Huang Y, et al. Gene signature distinguishes patients with chronic ulcerative colitis harboring remote neoplastic lesions. Inflamm Bowel Dis. 2013;19:461–470. doi: 10.1097/MIB.0b013e3182802bac. [DOI] [PMC free article] [PubMed] [Google Scholar]
- 22.Friedman RC, Farh KK, Burge CB, et al. Most mammalian mRNAs are conserved targets of microRNAs. Genome Res. 2009;19:92–105. doi: 10.1101/gr.082701.108. [DOI] [PMC free article] [PubMed] [Google Scholar]
- 23.Dobbin K, Simon R. Sample size determination in microarray experiments for class comparison and prognostic classification. Biostatistics. 2005;6:27–38. doi: 10.1093/biostatistics/kxh015. [DOI] [PubMed] [Google Scholar]
- 24.Ritchie ME, Silver J, Oshlack A, et al. A comparison of background correction methods for two-colour microarrays. Bioinformatics. 2007;23:2700–2707. doi: 10.1093/bioinformatics/btm412. [DOI] [PubMed] [Google Scholar]
- 25.Ritchie ME, Phipson B, Wu D, et al. limma powers differential expression analyses for RNA-sequencing and microarray studies. Nucleic Acids Res. 2015;43:e47. doi: 10.1093/nar/gkv007. [DOI] [PMC free article] [PubMed] [Google Scholar]
- 26.Benjamini Y, Hochberg Y. Controlling the False Discovery Rate: A Practical and Powerful Approach to Multiple Testing. J Roy Stat Soc B. 1995;57:289–300. [Google Scholar]
- 27.Zhang B, Horvath S. A general framework for weighted gene co-expression network analysis. Stat Appl Genet Mol Biol. 2005;4 doi: 10.2202/1544-6115.1128. Article17. [DOI] [PubMed] [Google Scholar]
- 28.Livak KJ, Schmittgen TD. Analysis of relative gene expression data using real-time quantitative PCR and the 2(-Delta Delta C(T)) Method. Methods. 2001;25:402–408. doi: 10.1006/meth.2001.1262. [DOI] [PubMed] [Google Scholar]
- 29.Reid Y, Storts D, Riss T, et al. In: Authentication of Human Cell Lines by STR DNA Profiling Analysis. Sittampalam GS, Coussens NP, Nelson H, et al., editors. Assay Guidance Manual; Bethesda (MD): 2004. [Google Scholar]
- 30.Berginski ME, Gomez SM. The Focal Adhesion Analysis Server: a web tool for analyzing focal adhesion dynamics. F1000Research. 2013;2:68. doi: 10.12688/f1000research.2-68.v1. [DOI] [PMC free article] [PubMed] [Google Scholar]
- 31.Pekow JR, Dougherty U, Mustafi R, et al. miR-143 and miR-145 are downregulated in ulcerative colitis: putative regulators of inflammation and protooncogenes. Inflammatory bowel diseases. 2012;18:94–100. doi: 10.1002/ibd.21742. [DOI] [PMC free article] [PubMed] [Google Scholar]
- 32.Wei Y, Yang X, Liu Q, et al. A role for caveolin and the urokinase receptor in integrin-mediated adhesion and signaling. J Cell Biol. 1999;144:1285–1294. doi: 10.1083/jcb.144.6.1285. [DOI] [PMC free article] [PubMed] [Google Scholar]
- 33.Kramer RH, Bensch KG, Wong J. Invasion of reconstituted basement membrane matrix by metastatic human tumor cells. Cancer Res. 1986;46:1980–1989. [PubMed] [Google Scholar]
- 34.Yang Z, Kyriakides TR, Bornstein P. Matricellular proteins as modulators of cell-matrix interactions: adhesive defect in thrombospondin 2-null fibroblasts is a consequence of increased levels of matrix metalloproteinase-2. Mol Biol Cell. 2000;11:3353–3364. doi: 10.1091/mbc.11.10.3353. [DOI] [PMC free article] [PubMed] [Google Scholar]
- 35.Basson MD. An intracellular signal pathway that regulates cancer cell adhesion in response to extracellular forces. Cancer Res. 2008;68:2–4. doi: 10.1158/0008-5472.CAN-07-2992. [DOI] [PubMed] [Google Scholar]
- 36.Bartolome RA, Garcia-Palmero I, Torres S, et al. IL13 Receptor alpha2 Signaling Requires a Scaffold Protein, FAM120A, to Activate the FAK and PI3K Pathways in Colon Cancer Metastasis. Cancer Res. 2015;75:2434–2444. doi: 10.1158/0008-5472.CAN-14-3650. [DOI] [PubMed] [Google Scholar]
- 37.Santos MF, McCormack SA, Guo Z, et al. Rho proteins play a critical role in cell migration during the early phase of mucosal restitution. J Clin Invest. 1997;100:216–225. doi: 10.1172/JCI119515. [DOI] [PMC free article] [PubMed] [Google Scholar]
- 38.Persson H, Kvist A, Rego N, et al. Identification of new microRNAs in paired normal and tumor breast tissue suggests a dual role for the ERBB2/Her2 gene. Cancer Res. 2011;71:78–86. doi: 10.1158/0008-5472.CAN-10-1869. [DOI] [PubMed] [Google Scholar]
- 39.Newie I, Sokilde R, Persson H, et al. The HER2-encoded miR-4728-3p regulates ESR1 through a non-canonical internal seed interaction. PLoS One. 2014;9:e97200. doi: 10.1371/journal.pone.0097200. [DOI] [PMC free article] [PubMed] [Google Scholar]
- 40.Li H, Zhou X, Zhu J, et al. MiR-4728-3p could act as a marker of HER2 status. Cancer biomarkers: section A of Disease markers. 2015;15:807–814. doi: 10.3233/CBM-150524. [DOI] [PMC free article] [PubMed] [Google Scholar]
- 41.Styczen H, Nagelmeier I, Beissbarth T, et al. HER-2 and HER-3 expression in liver metastases of patients with colorectal cancer. Oncotarget. 2015;6:15065–15076. doi: 10.18632/oncotarget.3527. [DOI] [PMC free article] [PubMed] [Google Scholar]
- 42.Seo AN, Kwak Y, Kim DW, et al. HER2 status in colorectal cancer: its clinical significance and the relationship between HER2 gene amplification and expression. PLoS One. 2014;9:e98528. doi: 10.1371/journal.pone.0098528. [DOI] [PMC free article] [PubMed] [Google Scholar]
- 43.Yaeger R, Shah MA, Miller VA, et al. Genomic Alterations Observed in Colitis-Associated Cancers Are Distinct From Those Found in Sporadic Colorectal Cancers and Vary by Type of Inflammatory Bowel Disease. Gastroenterology. 2016;151:278–287 e276. doi: 10.1053/j.gastro.2016.04.001. [DOI] [PMC free article] [PubMed] [Google Scholar]
Associated Data
This section collects any data citations, data availability statements, or supplementary materials included in this article.
Supplementary Materials
Supplementary Figure 1. CAV1, COL1A2, and THBS2 expression in UC-associated neoplasia. Immunostaining was performed for the indicated proteins in normal controls, UC-associated cancer, and non-dysplastic adjacent mucosa as described in the Methods. Note the higher expression levels of these proteins in adjacent and cancers compared to controls. Images are taken at 10× magnification.