Abstract
Poaching of elephants is now occurring at rates that threaten African populations with extinction. Identifying the number and location of Africa’s major poaching hotspots may assist efforts to end poaching and facilitate recovery of elephant populations. We genetically assign origin to 28 large ivory seizures (≥0.5 metric tons) made between 1996 and 2014, also testing assignment accuracy. Results suggest that the major poaching hotspots in Africa may be currently concentrated in as few as two areas. Increasing law enforcement in these two hotspots could help curtail future elephant losses across Africa and disrupt this organized transnational crime.
The illegal wildlife trade has become the world’s fourth largest transnational organized crime, and African elephant ivory is a major part of that trade (1). An estimated 40,000 African elephants were killed in 2011 (2), with 41 tons of illegal ivory seized (3). Given the 51 tons of ivory seized in 2013, the number of elephants killed that year could have exceeded 50,000, out of an estimated 434,000 elephants remaining (4). Such losses would exacerbate the already serious ecological, economic, and security impacts from rapid decline of this keystone species (2, 3, 5–8).
Here we use DNA-based methods to assign population of origin to African elephant ivory from 28 large seizures (≥0.5 metric tons) made across Africa and Asia from 1996 to 2014 (table S1). Large seizures of raw ivory constitute over 70% of the total weight of ivory shipped since 2006 (7). Our results reveal recurrent patterns that can help guide law enforcement effort to diminish organized trade in ivory and protect vulnerable elephant populations.
We assign geographic origin of large ivory seizures by statistically matching ivory genotypes from savanna or forest elephants to a geographic-specific allele frequency map of 16 microsatellite DNA loci (9–12), assembled separately for each of these two subspecies. We use a Markov chain Monte Carlo algorithm with spatial smoothing (13, 14) to compute separate continuous allele frequency maps across Africa from savanna or forest elephant reference samples. A total of 1350 reference samples, 1001 savanna and 349 forest, were collected at 71 locations across 29 African countries, with 1 to 95 samples per location (table S2). The respective allele frequency maps are then used to assign geographic origin to unknown savanna or forest ivory samples, one sample at a time with a uniform prior (13), or as part of a group with a Voronoi prior (15). We test the accuracy of these results by assigning each of the reference samples, treating them as samples of unknown origin, under several cross-validation scenarios (table S3).
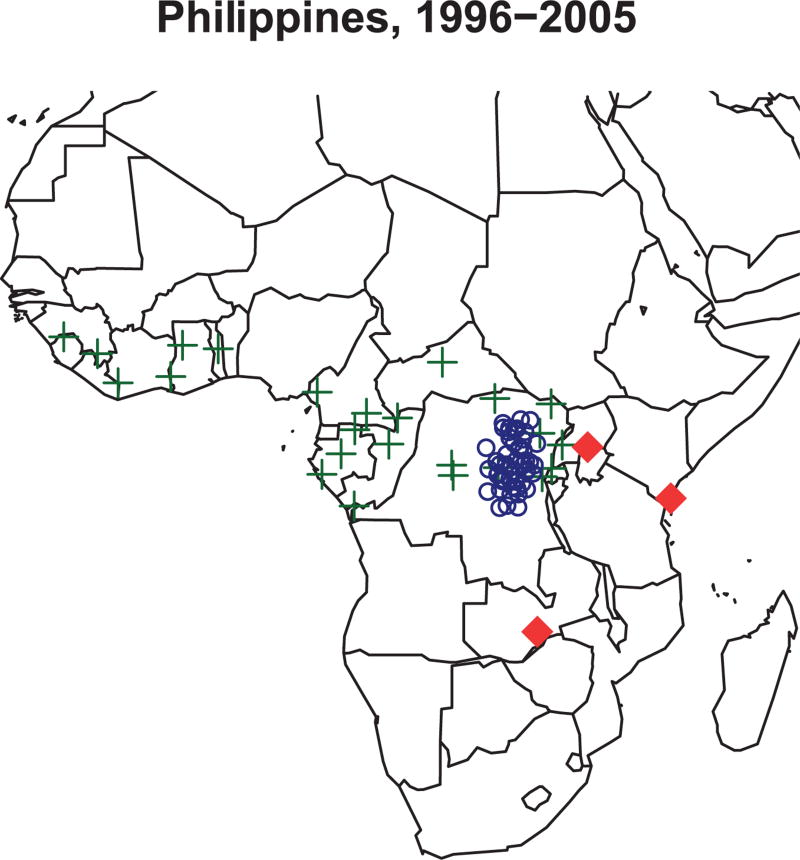
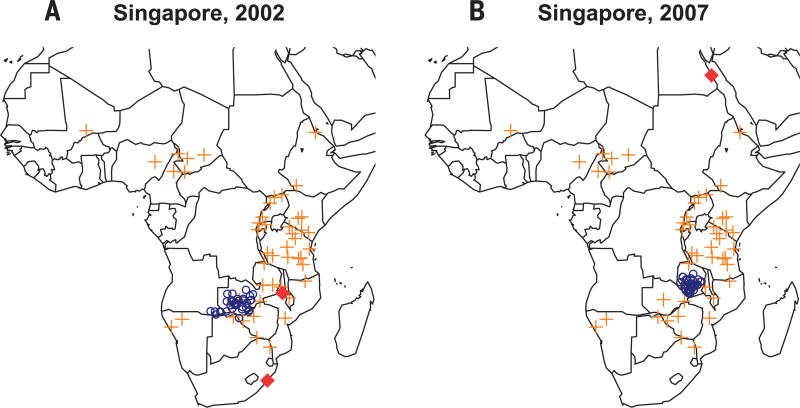
We acquired 20% of all large seizures made between 1996 and 2005, 28% made between 2006 and 2011 (7), and 61% made between 2012 and 2014. All but one of the 28 large ivory seizures (96%) that we assigned were geographically concentrated in a total of four areas, and seizures made after 2007 were concentrated in just two areas (Figs. 1 to 4). Forest elephant ivory in the five consignments seized between 1996 and 2005 were all assigned to eastern Democratic Republic of Congo (DRC) (Fig. 1). Two seizures of savanna elephant ivory made in 2002 and 2007 were both largely assigned to Zambia. The first was concentrated in Kifue National Park, southwestern Zambia, and was the largest seizure (6.5 tons) since the 1989 ivory ban. The second was concentrated in the Luangwa Valley (Fig. 2). Samples from DRC and Zambia were absent in origin assignments of seizures made after that time.
Fig. 1. Philippines seizures from 1996 to 2005 were assigned to eastern DRC.
Blue circles represent ivory assignments. Green crosses represent locations of forest elephant reference samples used in the assignments. Red diamonds represent initial transit locations out of Africa: Uganda, Kenya, Zambia.
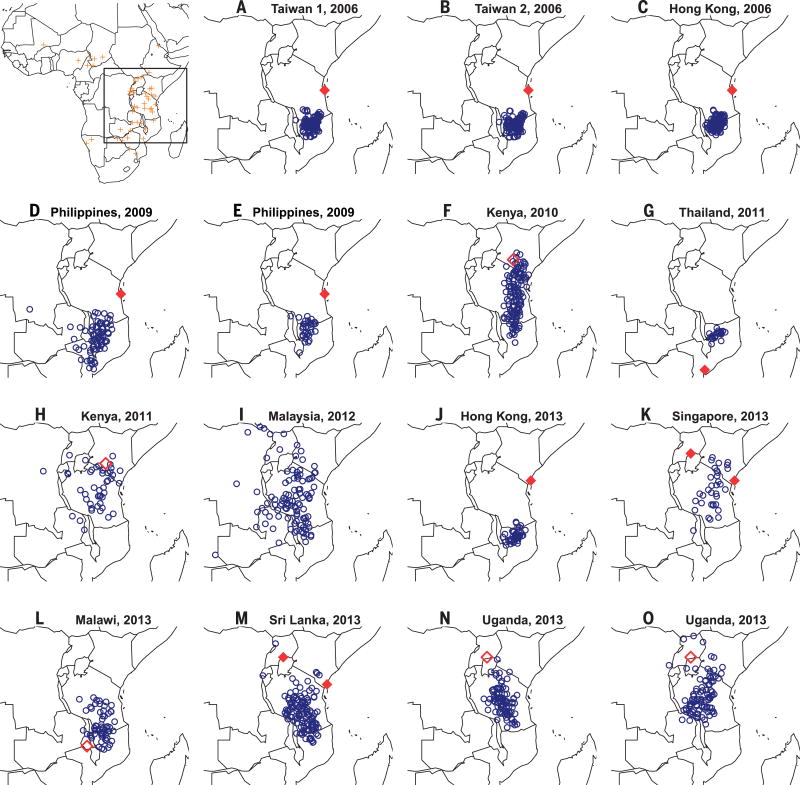
Fig. 4. Savanna elephant seizures from 2006 to 2014 were largely assigned to southeastern Tanzania and adjacent northern Mozambique, but eventually shifted northward within Tanzania.
Savanna elephant reference sample locations (orange crosses) are shown in the first map only, along with a box designating the magnified areas displayed in all subsequent maps. Blue circles represent ivory assignments. Most savanna ivory transited (solid diamonds) or was seized (open diamonds) from East African countries: seizures (A) to (E) = Tanzania; seizures (F), (H), and (J) = Kenya; seizure (G) = Mozambique; seizures (K) and (M) = Uganda to Kenya, seizure (L) = Malawi, and seizures (N) and (O) = Uganda. Seizure (I) was exceptional, transiting Togo, West Africa.
Fig. 2. Singapore seizures from 2002 and 2007 were largely assigned to Zambia.
Blue circles represent ivory assignments. Orange crosses represent locations of savanna elephant reference samples used in the assignments. Red diamonds represent initial transit locations out of Africa: seizure (A) = Malawi via South Africa; seizure (B) = Egypt.
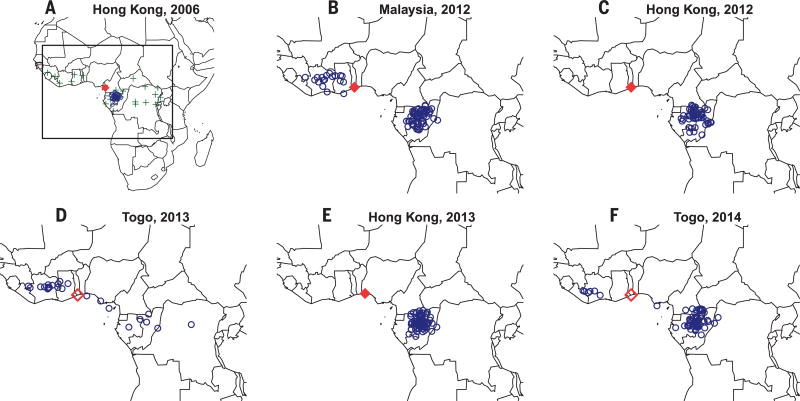
Six of the seven forest elephant ivory consignments seized between 2006 and 2014 were largely assigned to the area within or in close proximity to the Tridom (Tri-National Dja-Odzala-Minkébé) protected ecosystem that spans northeastern Gabon, northwestern Republic of Congo, and southeastern Cameroon, and the adjacent Dzanga Sangha Reserve in southwestern Central African Republic (CAR) (Fig. 3). The seventh seizure was made during the 2013 warehouse raid in Togo, allegedly belonging to a major ivory dealer in West Africa, and thus was not part of a transiting shipment. The 60 whole tusks from that raid were broadly assigned to West Africa (Ghana, the Ivory Coast, and possibly Togo) and the Tridom and Dzanga Sangha in Central Africa, with a few samples assigned to areas in between those two locales. Consistently, all but one (Fig. 3C) of the other seizures that transited or were seized in Togo included a smaller portion of samples from those same West Africa countries (primarily from Ghana and Côte d’Ivoire). The massive 6-ton seizure made in Malaysia during 2012 (Fig. 3B), which transited through Togo, also included a large portion (61%) of savanna ivory (see below).
Fig. 3. Forest elephant seizures from 2006 to 2014 were largely assigned to the TRIDOM in northeastern Gabon, northwestern Republic of Congo, and southeastern Cameroon and neighboring Dzanga Sanga in southwestern CAR.
Forest elephant reference sample locations (green crosses) are shown in the first map only, along with a box designating the magnified areas displayed in all subsequent maps. Blue circles represent ivory assignments. Initial transit locations out of Africa (solid diamonds) and areas where ivory was seized prior to transit out of Africa (open diamonds) include the following: seizure (A) = Cameroon; seizures (B) to (D) and (F) = Togo; seizure (E) = Nigeria.
Excluding the single 2007 seizure assigned to Zambia (Fig. 2), all of the 15 remaining savanna elephant seizures made between 2006 and 2014 were largely assigned to Tanzania, but spanning into northern Mozambique (Fig. 4). Seven out of the first 10 seizures made between 2006 and 2011 were almost entirely concentrated in the cross-border ecosystem of the Selous and Niassa Game Reserves, respectively spanning southeastern Tanzania and northern Mozambique. The three exceptional seizures (Fig. 4, F, H, and I) each had distinctly more diffuse geographic distributions, as well as atypical transit locations. The 2010 and 2011 Kenya seizures were both made in Jomo Kenyatta International Airport; port seizures of such large size are more commonly made at shipping ports. The 2010 Kenya seizure also included a high concentration of tusks spanning north-south along eastern Tanzania, which is now devoid of elephants. The third exceptional seizure was the massive 6-ton seizure made in Malaysia (Fig. 4I). This seizure transited through Togo in West Africa, making it the only seizure of savanna ivory in our data set that did not transit eastern Africa. It was also the same seizure that contained a large portion (40%) of forest elephant tusks from the Tridom and surrounding area (Fig. 3B). Thus, large quantities of forest and savanna ivory from the two major hotspot areas identified in Figs. 3 and 4 were consolidated, prior to this consignment being smuggled out of Togo.
The next seizure in this sequence (Fig. 4J) was again concentrated in the Selous-Niassa ecosystem. However, all subsequent seizures showed a progressive shift several hundred kilometers northwest of the Selous, eventually centered around Ruaha National Park and the adjacent Rungwa Game Reserve (Fig. 4), where Tanzania’s next-largest elephant population is located. Some of the samples from those latter seizures were also assigned to areas north of Ruaha, creeping toward southern Kenya.
Finally, we note that 23 of the 28 seizures that we examined were shipped (or about to be shipped) out of a different country from where they were assigned (table S1). The first five seizures were shipped out of Tanzania, with the shift occurring just after Tanzania was identified as a potential hotspot (8, 16).
The results of this study have implications for law-enforcement efforts aimed at tackling transnational organized trade in ivory and the increasing poaching of elephants, provided that our assignments have sufficient accuracy. Accuracy was evaluated by assigning our 1001 savanna and 349 forest reference as unknowns. We either removed one sample, half the samples, or all reference samples for assignment from a sampling location, recalculating allele frequencies in their absence prior to their assignment. Accuracy is expressed as the distance in kilometers between inferred and actual site of geographic origin. Table S3 summarizes these results for each of the 71 reference locations, subdivided into the three savanna elephant and two forest elephant geographic regions (13). Results also detail how accuracy varies with population structure (i.e., the extent to which populations can be genetically subdivided), the type of prior used [uniform (13), analyzing a single sample assignment at a time, or Voronoi (15), for group assignment], and sample size.
Half-location-out assignments using a Voronoi prior displayed higher accuracy and less variation than any other assignment combination (table S3). This is the type of assignment portrayed in Figs. 1 to 4 and is most applicable to cases where a moderate to large group of tusks are assigned to a location with multiple reference samples. We find that 50% of forest elephant samples were assigned to within 301 km of their actual origin for anywhere in Africa and the majority (75%) of samples within 416 km of their actual origin. For savanna elephants, 50% of samples were assigned to within 267 km of their actual origin for anywhere in Africa, and the majority within 430 km of their actual origin. The highest accuracy occurred in the most isolated populations, presumably because of population differentiation associated with isolation. These were the West African forest elephant samples (50% within 161 km, majority within 270 km) and the North African savanna elephant samples (50% within 180 km, majority within 396 km) (table S3). Figure S4, A and B, details assignment results for each of the 42 (out of 71) forest and savanna elephant reference locations with sample sizes ≥ 10.
All of the above precision estimates are conservative because the leave-half-out validations used only half of the reference samples from each area in order to assign the other half as unknowns. The large numbers of ivory samples typically assigned from a large seizure would further increase precision due to the benefits of group assignment using a Voronoi prior (supplementary materials, fig. S2, and table S3).
Our work suggests that the majority of ivory in large seizures since 2006 was poached in just two key areas. We did not obtain all seizures made during that period, but there was only one seizure that deviated from this pattern among the 22 seizures that we analyzed. The exceptional seizure was from Zambia. DRC and Zambia were hotspots prior to 2006 (see also supplementary materials), but seizures of poached ivory from these areas markedly dissipated thereafter. All other large seizures made between 2006 and 2014 consisted of ivory assigned to essentially two areas: Between 86 and 93% of the savanna elephant ivory from that period was predominantly assigned to southeastern Tanzania and adjacent northern Mozambique; 86 to 93% of the forest elephant ivory from that period was predominantly assigned to the Tridom in northern Gabon and Republic of Congo and the adjacent Dzanga Sangha of southwestern CAR.
Maisels et al. (17) report a 61% decline in Central African forest elephant populations over the past decade, with the last remaining elephant stronghold in Gabon and other areas surrounding the “Tridom.” The high concentration of elephants restricted to this part of Central Africa helps explain why it constituted the only forest elephant hotspot in our data set since 2006. By contrast, the greater number of savanna elephants distributed across Africa raises questions about why Tanzania has so consistently remained the primary poaching hotspot for savanna elephants.
If the numbers of hotspots are as few and concentrated as our data suggest, a focus of major international law-enforcement efforts on these key areas could result in substantial reductions in elephant poaching. Targeting those areas would choke the biggest flow of contraband ivory entering the ballooning criminal networks that allow this transnational crime to operate (1). We acknowledge the possibility that poaching areas may shift on a shorter time scale than the seizure and processing of illegal ivory, and are taking measures to shorten that time lag.
Other data sets also complement these efforts. MIKE (monitoring illegal killing of elephants) collects country-specific data on change in elephant population sizes (4) and the proportion of illegally killed elephants (PIKE) (3). ETIS (elephant trade information system) provides data on weights and sizes of all ivory seized along with details on transit locations (7). MIKE and ETIS data pertain to all elephant poaching, large and small. Our data are based solely on the sources of large ivory seizures that bear the signature of large-scale organized crime, and these sources are most often different from the country out of which the ivory transited.
Collectively, these combined data sets could provide a comprehensive picture of the illegal ivory trade over time. However, the PIKE data are limited by the small proportion of available carcasses counted (as low as 1% in some of the most heavily poached areas) (2) and marked variation in carcass detection probabilities between countries. Data are largely collected by rangers during patrols, and effort—as well as areas covered—varies by year, available funds, and ranger motivation (2, 7). Such unaccounted for variation in detection probabilities limits interpretation of carcass occurrence estimates (18). PIKE models also suffer from holding natural mortality constant between populations in order to pull out the impacts of poaching (2). Poaching causes tremendous variation in age structure, which in turn affects reproductive and mortality rates (19). Fortunately, all of these issues can be resolved by training and additional quality controls.
DNA assignment data can be similarly constrained by variation in a country’s willingness to provide seizures for analysis in a timely manner, particularly since all seizures are assumed to represent only 10% of what is smuggled (15). If this were a serious problem in our study, we would have expected at least some seizures in our analyses to fall outside the small number of hotspots that we identified. Fortunately, our results found virtually no such exceptions. More importantly, in 2013, delegates to the Convention on International Trade in Endangered Species of Wild Fauna and Flora (CITES) unanimously passed Decision 16.83, urging countries to turn over their large seizures for origin analysis within 90 days of the seizure. That decision has greatly increased the rate at which large seizures are now arriving in our lab, substantially improving our ability to track major shifts in poaching pressure on a real-time basis.
Methods that determine geographic origin of seized wildlife contraband offer powerful law-enforcement tools for a variety of forensic applications. This approach requires development of species-specific DNA reference maps, and acquisition of reference DNA from readily available dung samples makes this possible for a variety of species. Only a small number (~25) of reference samples are needed to characterize the allele frequencies from any given protected area, and efficient techniques such as detection dogs can be used to readily locate samples across the target species range (20). This study illustrates the value of this relatively inexpensive technology for combating the illegal wildlife trade.
Supplementary Material
Acknowledgments
This work was supported by the U.S. Fish and Wildlife Service African Elephant Conservation Act, the Bosack Kruger Charitable Foundation, Paul and Yaffa Maritz, the U.N. Office on Drugs and Crime, World Bank, Woodtiger Fund, Paul G. Allen Family Foundation, INTERPOL, the Bureau of International Narcotics and Law Enforcement Affairs of the U.S. State Department, Wildcat Foundation, the Fulbright-Nehru Doctoral and Professional Fellowship, and the National Institute of Justice (grant 2011-DN-13X-K541). Disclaimer: The opinions, findings, conclusions, and recommendations expressed in this publication are those of the authors and do not necessarily reflect those of the agencies or donors that funded this work. The following governments agreed to provide and share results from their ivory seizures: Malaysia, Thailand, the Philippines, Singapore, Cameroon, Taiwan, Hong Kong, Kenya, Uganda, Sri Lanka, Malawi, and Togo. A. Torkelson, S. Tucker, and M. Winters provided lab assistance. M. Stephens provided statistical advice. C. Klumb and H. J. Kim assisted in manuscript preparation. All microsatellite data are available on DRYAD with the accession no. doi:10.5061/dryad.435p4. Ivory samples are subject to restricted access (see www.whitehouse.gov/the-press-office/2014/02/11/fact-sheet-national-strategy-combating-wildlife-trafficking-commercial-b for the U.S. regulatory conditions currently governing trade in ivory, which may also apply to availability of samples). The idea for the study was conceived by S.K.W. Samples were acquired by S.K.W. and W.C. Genotyping was conducted by C.M. Statistical analyses were done by L.B., C.L., S.K.W., S.M., and B.S.W. Manuscript preparation was done by S.K.W. and L.B. Manuscript edits were done by S.K.W., L.B., S.M., W.C., C.L., and B.S.W. All microsatellite data are available on Dryad Digital Repository (http://dx.doi.org/10.5061/dryad.435p4).
Footnotes
References
- 1.United Nations. The Globalization of Crime. United Nations Office on Drugs and Crime; New York: 2010. http://unodc.org/unodc/en/data-and-analysis/tocta-2010.html. [Google Scholar]
- 2.Wittemyer G, et al. Proc. Natl. Acad. Sci. U.S.A. 2014;111:13117–13121. doi: 10.1073/pnas.1403984111. [DOI] [PMC free article] [PubMed] [Google Scholar]
- 3.Convention on International Trade in Endangered Species of Wild Fauna and Flora (CITES) SC65 Doc. 42.1. 2014 doi: 10.1159/000459796. http://cites.org/sites/default/files/eng/com/sc/65/E-SC65-42-01_2.pdf. [DOI] [PubMed]
- 4.www.elephantdatabase.org/preview_report/2013_africa/Loxodonta_africana/2012/Africa
- 5.Blake S, Deem SL, Mossimbo E, Maisels F, Walsh P. Biotropica. 2009;41:459–468. [Google Scholar]
- 6.Western D. In the Dust of Kilimanjaro. Island Press; Washington, DC: 2001. [Google Scholar]
- 7.Underwood FM, Burn RW, Milliken T. PLOS ONE. 2013;8:e76539. doi: 10.1371/journal.pone.0076539. [DOI] [PMC free article] [PubMed] [Google Scholar]
- 8.Wasser S, et al. Science. 2010;327:1331–1332. doi: 10.1126/science.1187811. [DOI] [PubMed] [Google Scholar]
- 9.Roca AL, Georgiadis N, Pecon-Slattery J, O’Brien SJ. Science. 2001;293:1473–1477. doi: 10.1126/science.1059936. [DOI] [PubMed] [Google Scholar]
- 10.Comstock KE, Wasser SK, Ostrander EA. Mol. Ecol. 2000;9:1004–1006. doi: 10.1046/j.1365-294x.2000.00939-8.x. [DOI] [PubMed] [Google Scholar]
- 11.Comstock KE, et al. Mol. Ecol. 2002;11:2489–2498. doi: 10.1046/j.1365-294x.2002.01615.x. [DOI] [PubMed] [Google Scholar]
- 12.Nyakaana S, Arctander P. Mol. Ecol. 1998;7:1436–1437. [PubMed] [Google Scholar]
- 13.Wasser SK, et al. Proc. Natl. Acad. Sci. U.S.A. 2004;101:14847–14852. doi: 10.1073/pnas.0403170101. [DOI] [PMC free article] [PubMed] [Google Scholar]
- 14.Vounatsou P, Smith T, Gelfand AE. Biostatistics. 2000;1:177–189. doi: 10.1093/biostatistics/1.2.177. [DOI] [PubMed] [Google Scholar]
- 15.Wasser SK, et al. Proc. Natl. Acad. Sci. U.S.A. 2007;104:4228–4233. doi: 10.1073/pnas.0609714104. [DOI] [PMC free article] [PubMed] [Google Scholar]
- 16.Wasser SK, Clark B, Laurie C. Sci. Am. 2009 Jul;301:68–76. doi: 10.1038/scientificamerican0709-68. [DOI] [PubMed] [Google Scholar]
- 17.Maisels F, et al. PLOS ONE. 2013;8:e59469. doi: 10.1371/journal.pone.0059469. [DOI] [PMC free article] [PubMed] [Google Scholar]
- 18.MacKenzie DI, et al. Ecology. 2002;83:2248–2255. [Google Scholar]
- 19.Gobush KS, Mutayoba BM, Wasser SK. Conserv. Biol. 2008;22:1590–1599. doi: 10.1111/j.1523-1739.2008.01035.x. [DOI] [PubMed] [Google Scholar]
- 20.Wasser SK, et al. Can. J. Zool. 2004;82:475–492. [Google Scholar]
Associated Data
This section collects any data citations, data availability statements, or supplementary materials included in this article.


