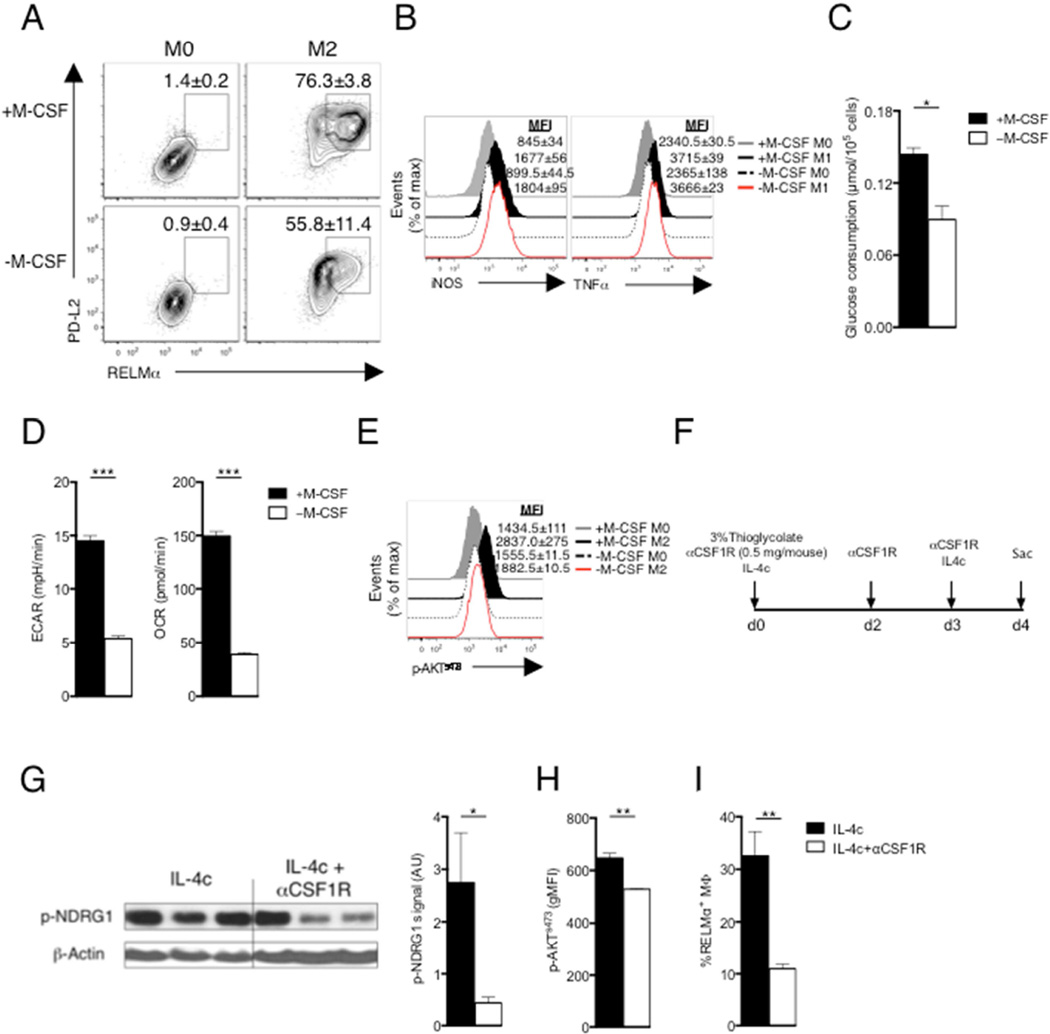
Figure 4. M-CSF is essential to regulate mTORC2 signaling in M2 macrophages.
(A) Expression of PD-L2 and RELMα in macrophages cultured for 24 hr with (M2) or without (M0) IL-4 or M-CSF. (B) Expression of iNOS and TNF-α in macrophages cultured for 24 hr with (M1) or without (M0) IFN-γ + LPS or M-CSF. (C) Glucose consumption, and (D) basal ECAR and basal OCR of M2 macrophages treated as in (A). (E) Level of phosphorylated AKTs473 in macrophages as in A, assessed by flow cytometry. MFI values are shown. (F) Scheme to examine the effect of blocking M-CSF/CSF1R interaction on M2 activation in vivo. (G) Phosphorylated NDRG1 (p-NDRG1) in pMacs was measured by immunoblot; band density was normalized to loading controls and is presented in arbitrary units (AU). (H) Level of AKTs473, phosphorylation, and (I) frequency of RELMα+ cells, in pMacs. Data in A,B, E, H and I are from, flow cytometry and in A, B and E are from one experiment representative, but numbers represent mean % (A) or MFI (B,E) values, ± s.e.m, from three independent experiments. In C,D and G–I, data are mean ± s.e.m. of technical replicates from one experiment representative of three or more independent experiments. *P < 0.05, **P < 0.005 and ***P < 0.0001.

