Abstract
The highly ordered crystal structure of crambin has been solved at 1.5 Å resolution directly from the diffraction data of a native crystal at a wavelength remote from the sulphur absorption edge. The molecule has three disulphide bridges among its 46 amino acid residues, of which 46% are in helices and 17% are in a β-sheet. Crambin is shown to be an amphipathic protein, inasmuch as its six charged groups are segregated from hydrophobic surface elements. Phasing methods used here will also apply elsewhere.
Bijvoet’s observation1 that anomalous scattering might aid in solving the phase problem has had many implications2, including suggestions that departures from Friedel’s law of diffraction symmetry might suffice to determine directly the atomic structures of crystals containing heavy atoms3–5. Anomalous-scattering methods have also been widely used in protein crystallography6–11, particularly as an adjunct to isomorphous-replacement phasing. We have now combined elements from these two traditions to solve the structure of crambin by exploiting the anomalous scattering of sulphur atoms at a single wavelength (1.54 Å of CuKα) far removed from the absorption edge of sulphur (5.02 Å).
Crambin is a small protein found in the embryonic tissue (cotyledons and hypocotyledons) of seeds from Crambe abyssinica, a relative of mustard and rape commonly known as Abyssinian cabbage. It is hydrophobic in that organic solvents are required to solubilize it, Van Etten et al.12 characterized crambin after noticing that crystals formed during evaporation of an aqueous acetone extract of defatted seed meal. The remarkable crystalline order observed by Teeter for this protein (strong diffraction from spacings <0.88 Å)13 correlates well with the unprecedented structural stability seen in solution by Llinás et al.14 using NMR spectroscopy. The function of crambin is not known. However, the recently completed chemical sequence15 reveals an unmistakable homology with the plant toxins purothionin16 and viscotoxin17. Crambin itself is not toxic when fed to rats18.
We set out to solve the crystal structure of crambin in view of its exceptional potential for providing detailed structural information and in the hope of shedding light on the function of this hydrophobic protein. When our efforts to prepare heavy-atom derivatives failed, we explored alternatives to isomorphous replacement for phase determination. Our experience in using anomalous scattering to locate the iron atoms in myohaemerythrin19 led us to contemplate an attempt based on the six sulphur atoms in crambin. An estimate of the magnitude of Bijvoet differences to be expected from crambin gave a value about half that found with myohaemerythrin and showed that sulphur scattering would account for 98% of the expected anomalous signal. The expected contribution of the sulphur partial structure to the protein diffraction pattern proved to be 29% (〈|FS|〉/〈|FP|〉), or 9% based on |F|2 ratios. This seemed to provide a plausible, albeit marginal, basis for the crystal structure analysis.
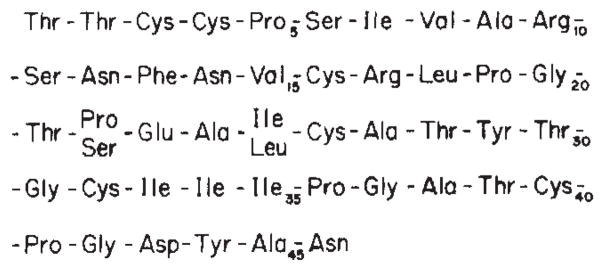
The amino acid sequence determination, begun to aid the crystallographic analysis, was about 65% complete when the first electron-density maps were obtained. Completion of the chemical sequencing was aided by, proceeded alongside and helped to verify the structure solution. The sequence, as reported elsewhere15, is shown in Fig. 1.
Fig. 1.
The amino acid sequence of crambin. Details of the sequence analysis are given in ref. 15.
Diffraction measurements
The diffraction data were measured from a single crambin crystal, grown and mounted as described before13, in equilibrium with its mother liquor of 60% aqueous ethanol (v/v). This crystal had approximate dimensions of 0.2 × 0.5 × 0.4 mm and gave unit cell parameters of a = 40.96, b = 18.65, c = 22.52 Å and β = 90.77°. The space group is P21. X-ray reflections from Ni-filtered CuKα radiation were recorded at room temperature (22–24 °C) as peak-top ω step-scans on a Picker FACS-1 diffractometer that is controlled by the Vanderbilt program system20. For spacings greater than 1.5 Å, both Ih and I−h were measured. Care was taken to reduce systematic errors in the Bijvoet differences by successively collecting blocks of 25 reflections at (ϕ, χ, 2θ) and then their Friedel counterparts at (ϕ, χ, −2θ). After completing the 1.5 Å data set, +2θ measurements were continued in shells out to 0.95 Å spacings. At this point the crystal slipped and further measurements were abandoned.
The scans for the 1.5 Å data comprised 4-s counts at each of seven steps in 0.03° intervals in ω and at a single background point. Counts were corrected for possible coincidence losses. These data were then reduced to integrated intensities using the procedure of Hanson et al.21, which fits gaussian profiles over smoothly varying backgrounds. Standard corrections were made for Lorentz and polarization factors, absorption22 and scale23. No correction was made for radiation damage. (A monitor reflection showed only 3% decay in I after 150 h exposure.) Residual systematic errors in the Bijvoet differences
| (1) |
were minimized by applying local scale factors24 parameterized to be anisotropic. These scale factors, applied to |F−h|, ranged from 0.97 to 1.01 and eliminated errors that swamp the signal. After scaling, r.m.s. (ΔF) is 2.3e for acentric data as compared with 1.4e for the centric (h0l) data where there is no signal. This symmetry estimate or error agrees well with that obtained from counting statistics and instrumental instability, r.m.s. (σΔF) = 1.6e. Thus, on average the anomalous-scattering signal is about 1.7e, , which is 2.1% of the r.m.s.(F).
This work concerns only the 1.5 Å data. The data from beyond 1.5 Å have not been processed.
Sulphur structure
The first task of the analysis, to locate the sulphur atoms, was accomplished by interpreting Patterson maps computed with coefficients of (ΔF)2 as suggested by Rossmann8. Peaks in such maps correspond to inter-atomic vectors between anomalous scatterers. However, because the coefficients involve small differences, the maps are very sensitive to erroneous measurements. Hence, differences with |ΔF| > 5 r.m.s. (ΔF) were rejected as distribution outliers (four reflections) and the more error-prone weak data with |Fh| or |F−h|<5σF were also excluded (127 reflections). Small Bijvoet differences, |ΔF|<1.2σΔF, were also left out (3,038 reflections) but this had little impact on the maps.
These anomalous-difference Patterson maps were remarkably clean. The first map was computed at 3 A resolution and could readily be interpreted as arising from three sites that correspond to unresolved disulphide units. When the data to 1.5 Å spacings were also included, the disulphide Patterson peaks became resolved into clusters of peaks from which the six-atom sulphur structure was deduced.
It is easy to show9–11 that for a structure containing relatively weak anomalous scatterers all of one kind, for example, sulphur in crambin,
| (2) |
Here, F exp (iϕ), where , is a structure factor from the real parts of the scattering and δ exp (iψ) is calculated from the anomalous scatterers when given the imaginary components, Δf″, for scattering factors. This relationship, which also explains the effectiveness of the (ΔF)2 Patterson synthesis, provides a basis for refining the structure of anomalous scatterers and ultimately for phasing the whole structure. As |ΔF| becomes large the sine factor must approach ±1 so that |ΔF| ≃ 2δ. Thus, atomic parameters of anomalous scatterers can be refined against |ΔF| values if only the largest differences are included. This was first done for myohaemerythrin to give a quite precise Fe–Fe distance19.
Refinement of the crambin sulphur structure was against a data set restricted, by rejection criteria described above, to the 1,910 strongest from among a total of 5,017 Bijvoet differences. The value of Δf″ for sulphur was taken to be 0.557 (ref. 25). The refinement reduced R to 0.33. Disulphide distances, unrestrained, in the resulting structure were in good agreement with expectation: d = 2.00, 2.02 and 2.04 Å with σd = 0.06 Å.
Phase determination from partial-structure resolved anomalous scattering
Phase information from anomalous scattering at a single wavelength, like that from a single isomorphous replacement experiment, is intrinsically ambiguous. Given an observed ΔF and the values of δ and ψ calculated from refined atomic parameters, equation (2) can be solved for the desired phase, ϕ, for the reflection. However, the possible solutions at ϕ = ψ + π/2±θ, θ = cos−1 (ΔF/2δ), are equally likely. Moreover, due to the substantial errors in ΔF, other phases may also be plausible or, quite possibly, a formal solution will be precluded. This ambiguity and imprecision in phases can be taken into account by using a probability treatment of the kind introduced by Blow and Crick26. We have used an error model11 whereby the probability distribution, Pano(ϕ), for phase information from anomalous scattering is
| (3) |
The standard error, , is composed of the error in ΔF and a residual lack-of-closure error, E0 (ref. 27). N is a normalization factor.
The phase ambiguities, ±θ, must be resolved for the anomalous scattering to be of use. If the anomalous scatterers are sufficiently heavy, then phases for the total structure, ϕ, will tend to be close to those for the heavy-atom structure, ψ. One can then simply take the anomalous alternative that is nearer to the heavy-atom phase3–5. However, this process is often not valid if, as in the case of crambin, the partial structure of anomalous scatterers is not a dominating influence. Thus, we have used a probability treatment where the distribution, Ppar(ϕ), for phase information for the sulphur partial structure is based on that given by Sim28
| (4) |
Here, 〈 〉 is the expected value of the scattering contribution from the unknown part of the structure; |FP| and |FS| are the structure factor moduli observed for the protein and calculated from the sulphur structure, respectively; Q is an arbitrary sharpening factor.
These probability representations were used to combine the phase information from anomalous scattering with that from the sulphur partial structure and also to compute figures-of-merit, m, for weighting the Fourier synthesis. After some experimentation we settled on a scheme for probabilistic choices29. A choice was made if the partial-structure probabilities (equation (4)) discriminated well between alternative maxima in the anomalous scattering distribution (equation (2)). Sharp unimodal distributions were used directly. Otherwise, Pano(ϕ) and Ppar(ϕ) were multiplicatively combined30.
There remains one further ambiguity. The sulphur structure deduced from Patterson maps could equally well be of either hand. Nothing in the anomalous-scattering and partial-structure information decides directly between enantiomers, but resulting phases will only be sensible when based on the correct choice. Independent information is required. Chemical reasonableness in a Fourier synthesis seemed to favour one sulphur enantiomer. This choice was corroborated by Sayre phase refinements31 on both hands. (This ‘refinement’ reduced the residuals to R = 0.23, but it actually degraded the map.)
Interpretation of the electron-density map
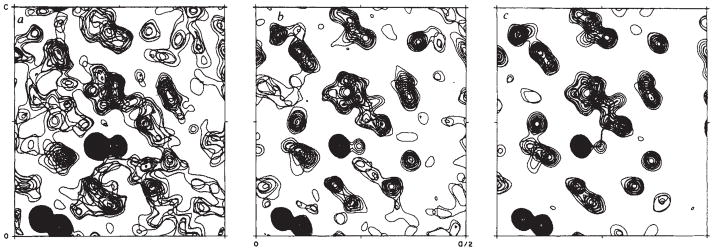
A part of the Fourier synthesis in the proper hand is shown in Fig. 2a. The most striking density in this map comes from the known sulphur atoms, but other rather atomistic features are also evident. Yet, the map has quite an uneven quality. In an initial survey we correctly identified four side groups (later to be Pro 5, Tyr 44, Phe 13 and Asn 14), but peptide linkages to adjacent residues were not readily apparent even with knowledge of a tentative sequence for the first 33 residues. However, it did prove possible to fit the prominent proline ring (Fig. 2) and two sulphur atoms with a model of the unique –Cys 3–Cys 4–Pro 5–peptide, albeit through some weak density.
Fig. 2.
A portion of the electron-density distribution for crambin at three stages in the analysis. Each frame encloses an area bounded by 0 < x < a/2 and 0 < z < c and is a composite of the sections at y = (19–21)b/40. The adjacent, dense spherical features at the lower left are the sulphur atoms of Cys 16–Cys 26. The dense spheroid near the centre of each frame is Sγ of Cys 32. Sγ of Cys 4 lies just to the right of this and is centred above these sections. The ring of Pro 5 is seen in the plane of these sections. All the maps are at 1.5 Å resolution. Frame a is part of the initial Fourier synthesis from which the structure was interpreted. Coefficients of were used with figures of merit and phases determined as follows. Bimodal anomalous distributions for which the partial-structure choice-probability29 exceeded 0.7 were given the phase of the chosen mode and weighted by the intrinsic figure of merit29 (30% of the 5,660 reflections). Phasing for relatively sharp unimodal distributions, mano>0.4 and mano>mcombine, was kept at ϕano and mano (8%). For the remaining cases, the centroid phases and weights, mcombine, were determined from multiplicatively combined distributions30. These included the centric zonals (11%) and error rejects (2%), for which there was no anomalous phasing, as well as the other general reflections (48%). Partial structure probabilities were computed with Q = 2. Overall, m̄ = 0.55. Frame b is from the first (2Fobs–Fcalc), ϕcalc map after direct refinement of the initial model to an agreement factor of R = 0.322. Frame c is the latest (2Fobs – Fcalc), ϕcalc map from the model at R = 0.104.
The seeming reasonableness of these parts of the map encouraged us to attempt a complete interpretation. The fitting was made without recourse to graphic sophistication. Rather, we simply followed density features contoured on paper (5 mm Å−1), proceeding outward from the disulphide bridges while bearing in mind standard stereochemical rules. Putative atomic positions were marked on the sheets. Several polypeptide segments evolved and eventually joined up. The last connections, residues 18–22 and 37–41, were rather tenuous but they did complete the chain. It was a heartening verification of the model when helices were finally recognized. Atomic coordinates were read off the map with the aid of a gridwork overlay.
Model refinement and revision
The initial model included 338 non-hydrogen atoms from 45 amino acid residues and 18 water molecules. This model fitted the diffraction pattern with a reliability index R = Σ|Fobs – Fcalc|/ΣFobs| of 0.43 for the data from spacings between 5 and 1.5 Å. Twelve cycles of stereochemically restrained refinement32 reduced R to 0.32 while imposing moderately good geometry as typified by the r.m.s. deviation from bond ideality of 0.04 Å. Individual isotropic thermal parameters were varied but with tight restraints33.
Several iterations of map interpretation, model revision and continued refinement followed. Inspection of the first (2F0–Fc) synthesis (Fig. 2b) and the corresponding (F–Fc) difference map revealed a number of misplaced atoms, particularly in segments 18–22 and 37–41. A model with the polypeptide backbone revised in these segments then refined to an R of 0.27. Repair of side chains (40% were wrongly identified initially in the unsequenced C-terminal portion), addition of water molecules to a total of 39, and further refinement brought R down to 0.17. It then became apparent that some of the supposed water sites actually constituted a 46th residue.
Finally, special attention was paid to solvent regions and to side-group assignments. Another ~40 solvent molecules were located on inclusion of the 5–10 Å shell of data and, after release of thermal restraints, residue identifications were completed down to the distinctions between N and O needed to assign Asp 43 and Asn 46. This took R to 0.12. Side-group assignments were confirmed at this point by the completed chemical sequence analysis. A model was then devised to account for the conformational and compositional heterogeneity at three residue positions. Isotropic refinement of this model (414 atomic sites including 72 water and 4 ethanol molecules) against all 5,638 data in the 10–1.5 Å shell gave R = 0.114 with bond ideality of 0.018 Å. Anisotropic refinement with restraints33 such that the r.m.s. bond-distance fluctuation was kept to 0.05 Å gave R = 0.104 (see Fig. 2c). The resulting coordinates will be deposited in the Protein Data Bank.
Molecular conformation
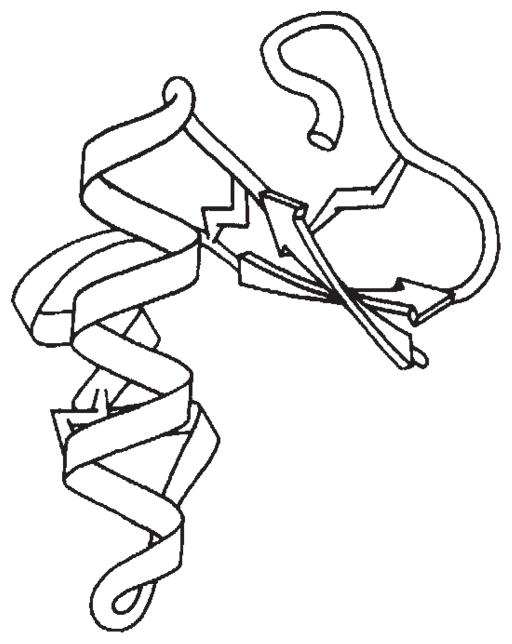
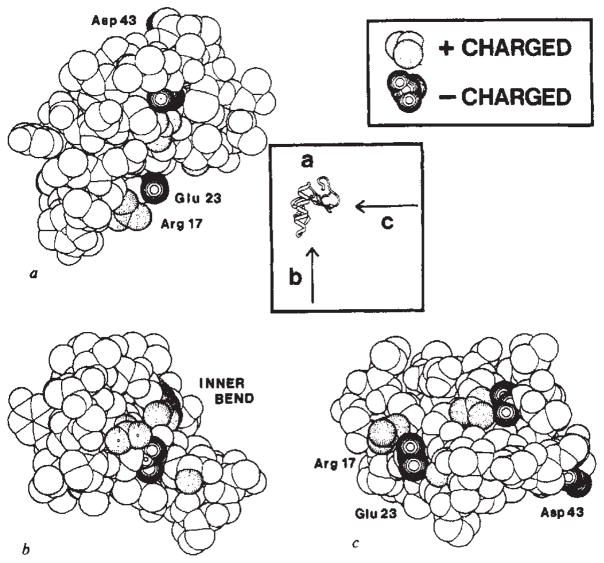
Crambin has the shape of the Greek capital letter gamma (Γ) when viewed as in Fig. 3. (We describe crambin in terms of a model so oriented lying on a table before the reader.) The stem of the Γ is an antiparallel pair of helices and the cross-arm consists of two antiparallel β-strands, an irregular strand and a classic β-turn. The backbone skeleton of crambin (Fig. 3) gives an impression that the relatively thin β-arm is only tenuously connected to the helical stem. This belies the exceptional degree of rigidity in crambin14. In fact, side chains fill the axillary juncture, or inner bend, between the stem and the arm with numerous stabilizing salt bridges, hydrogen bonds and other contacts (Figs 4, 5). The disulphide bridges further fix the internal structure of the sub-domains.
Fig. 3.
A schematic drawing of the backbone of crambin. This representation of crambin was drawn by Jane Richardson to be faithful to computer drawings of the skeleton. Arrows depict β-strands. The disulphides are drawn as ‘lightning flashes’. The reader looks down along b; a* runs from left to right and c runs from page bottom to page top.
Fig. 4.
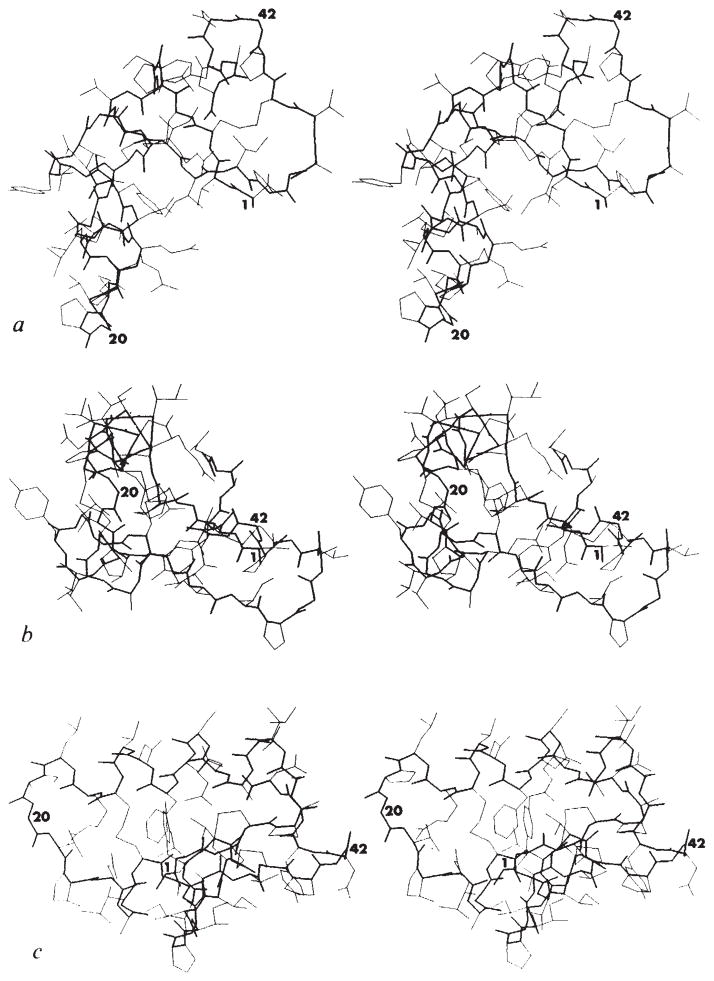
Stereo drawings of the crambin atomic structures. Bonds along the main-chain backbone are enhanced. The conformational and compositional heterogeneity at positions 7, 22 and 25 is included. Residue numbers are given near the Cα positions of Thr 1, Gly 20 and Gly 42 in each of the views. a, View, as in Fig. 3, through the thinnest dimension. b, View along c with a* running from left to right. This is approximately along the helical stem and perpendicular to the β-sheet (towards the back at the right). c, View into a* with c running from left to right. This is approximately perpendicular to the helix axes as seen from the β-arm side. These stick figures and the surface diagrams (Figs 5 and 6) were all drawn using the program PLT1 written by G. J. Quigley.
Fig. 5.
Ionic surface of crambin. These surface representations of crambin have the following Van der Waals radii: C, 1.7 Å; N, 1.4 Å; O, 1.4 Å and S, 2.1 Å. No hydrogen atoms are included. Positively charged groups of atoms are shaded with dotted circles and negatively charged groups are shaded with solid circles. a, View of the molecule as in Fig. 3 and in Fig. 4a. b, View looking into the inner bend of the Γ from along the helix axes as in Fig. 4b. c, View looking into the inner bend perpendicular to the helix axes as in Fig. 4c.
The local conformational parameters of crambin fit remarkably well with accepted principles of secondary structure34. Backbone conformation angles are all within allowed regions of the (ϕ, ψ) plot, although the conformations at three glycine residues (20, 31 and 37) would be disallowed for any other residue. All the peptide bonds are trans. The present restrained model has an r.m.s. deviation of 3.8° from peptide planarity. Only the ω angles following residues 29–31 and 44–45 deviate from planarity by more than 5°, the greatest deviation being 11°. Side-chain conformation angles also lie close to ‘ideal’ values. The 43 χ angles that are expected to be staggered have an r.m.s. deviation of only 9.5°. Two of the three aromatic residues are within 4° of the expected transverse conformation at χ2, but Tyr 29 has χ2 = 55°. The disulphide torsion angles, which are also expected to favour ±90°, are −79° (3–40), 106° (4–32) and −86° (16–26).
Residues 1–4 and 32–35 produce β-strands linked by four hydrogen bonds. The (ϕ, ψ) angles in these segments average (−121°, 148°). This two-stranded β-sheet has the usual left-handed twist when viewed perpendicular to the strands. Residues in extended conformations at 39–41 form a third strand that is not in the β-sheet.
Residues 7–19 and 23–30 are in helices. The first 10 residues in the upper helix have (ϕ, ψ) angles that average (−62°, 42°) and only vary by σϕ = σψ = 4°. A disruptive proline at the C-terminus of this helix is accommodated by 310-helix conformations at positions 17 and 19. The last residue in the lower helix, Thr 30, has a distorted 310-like conformation, but otherwise this helix is also α-helical. Its (ϕ, ψ) angles average (−65°, 37°) but it is somewhat less regular than the upper α-helix, σϕ = 6° and σψ = 8°. The angle between helix axes is 139°.
Residues 5–6, 20–22, 31, 36–38 and 42–43 produce the five turns in the crambin tertiary fold. Four of these segments contain or are immediately preceded by proline residues and four include glycines. The first four turns are relatively gradual and each is negotiated in a characteristic way. However, the last turn is a sharp reversal, with a carbonyl-41 to amide-44 hydrogen bond. It is a type I β-turn, the most common kind, and has (ϕ, ψ) angles of (−62°, −23°)42 → (−90°, −2°)43.
Conformational heterogeneity exists at Ile 7 and Ile 25 where Cδ1 atoms take either of two staggered possibilities. Compositional heterogeneity also exists at positions 22 and 25. Refinement parameters suggest that residue 22 is ~60:40 Pro/Ser and that residue 25 is ~60:40 Ile/Leu. The heterogeneity at residue 22 apparently causes a disorder in Tyr 29; the refined position of its Oη makes an impossibly short contact of 2.6 Å with Cδ of Pro 22 on a screw-related molecule.
Amphipathic protein surface
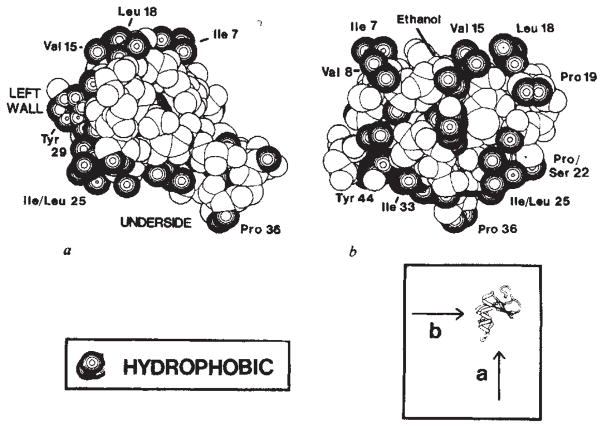
The surface of crambin has an amphipathic character. The six charged groups ( , 10 Arg+, 17 Arg+, 23 Glu−, 43 Asp− and 46 COO−) as well as several other hydrophilic side chains are clearly segregated from what otherwise is largely a hydrophobic molecular surface. The surface of crambin can be understood as comprising three components. The face of the inner bend between the helical stem and the β-arm is a sloping surface that is almost entirely hydrophilic (Fig. 5). The other two surface elements, namely the left wall of the helical stem and the underside of the molecule, are primarily hydrophobic (Fig. 6). The left-wall surface curves gently around the outer bend while the underside surface is relatively flat.
Fig. 6.
Hydrophobic surface of crambin. The radii used here are the same as those in Fig. 5. Atoms designated as hydrophobic here only include the side-chain carbon atoms of Ala, Val, Leu, Ile, Phe and Tyr residues, Cβ and Cγ of Pro and Cγ2 of Thr. a, View looking into the hydrophilic inner bend, as in Figs 4b and 5b, showing hydrophobic residues that line the left-wall and underside surfaces. b, View looking into the left-wall surface along a* with c running from right to left. Note that the polar side chain of Asn 12 is partially covered by the hydrophobic cloak of an ethanol molecule.
All but one of the charged groups are clustered on the face of the inner bend. Six of the 13 other polar side chains also line or rim this surface. These groups are highly interconnected. For example, the guanidinium group of Arg 10 makes a salt bridge to the terminal carboxyl oxygens of Asn 46, forms hydrogen bonds to the hydroxyl and carbonyl oxygens of Thr 2, and interacts with the amide oxygen of Asn 14 through a tightly bound water molecule. Bridging water molecules also link the carboxyl group of Glu 23 to the terminal amino group of Thr 1 and the guanidinium group of Arg 17. In the crystal this chain of alternating charges continues to the carboxyl group of Asp 43 in a molecule related by lattice translation.
Unlike the inner-bend surface, or the surfaces of water-soluble proteins in general, the remainder of crambin is interspersed with hydrophobic groups. The left-wall surface includes eight fully exposed leucine, isoleucine, valine, proline and tyrosine side groups and the underside surface contains seven such exposed groups. There are also exposed polar side groups on these surfaces, but several of these are hydrogen-bonded back to the main chain.
The most extensive packing contacts in the crystal involve Van der Waals interactions between juxtaposed left-wall surfaces. There are only four direct intermolecular hydrogen bonds in the asymmetric unit, all other lattice interactions being mediated through water molecules. Although water is excluded from the left-wall contacts, it surrounds the remaining available surface. Most of the water molecules are associated with the hydrophilic inner bend, but elsewhere a number are actually in contact with hydrophobic side chains. Surprisingly little of the ethanol is bound detectably. Only four ethanol sites with a total occupancy of 2.3 have been located, whereas the 72 identified water sites have occupancies totalling 52.7. If the solvent space (34% of the crystal) had the composition of the mother liquor (60% ethanol), we would expect 18 ethanol and 39 water molecules per asymmetric unit.
It is likely that the amphipathic character of the crambin surface has significance for the physiological activity of the molecule. Unfortunately, the biological role of crambin is unknown.
Prospective applications
It might seem that anomalous-scattering methods as used here would apply solely to special, highly ordered structures like crambin. However, estimates of phasing power suggest that these methods may have broad applicability. Expected diffraction ratios related to anomalous-scattering and partial-structure strengths have been calculated for various crystals of known structure (Table 1). Many of these problems give ratios that compare favourably with those for crambin and probably they too could have been solved from partial-structure resolved anomalous scattering. This is true both for structures with native anomalous scatterers and for heavy-atom complexes.
Table 1.
Expected diffraction ratios for potential applications of resolved anomalous phasing
| Molecule | NP | NA |
|
|
||
|---|---|---|---|---|---|---|
| Sulphur-rich proteins: | ||||||
| Crambin | 400 | 6S | 1.4% | 29% | ||
| Snake neurotoxin38 | 500 | 8S | 1.5% | 30% | ||
| Metalloproteins: | ||||||
| Hi PIP39 | 700 | 4Fe/8S | 5.3% | 38% | ||
| Haemerythrin19 | 1,000n | 2nFe | 3.0%* | 17%* | ||
| Oligonucleotides: | ||||||
| d(CPGPCPGPCPG)40 | 300 | 10P | 1.6% | 39% | ||
| Oligopeptides: | ||||||
| Antamanide41 | 100 | 10O | 0.5%† | 37% | ||
| Heavy-atom complexes: | ||||||
| Myoglobin42 | 1,300 | 1Hg | 4.5% | 31% | ||
| Lysozyme43 | 1,100 | 1U | 8.5% | 39% | ||
NP is the approximate number of non-hydrogen atoms in the total molecule and NA is the number of anomalous scatterers. (Omission of hydrogen atoms has a negligible effect on these calculations: 〈FP〉 with hydrogens is ~1.01〈FP〉 without hydrogens.) The diffraction ratios are estimates for zero scattering angle. In the case of only one kind of anomalous scatterer these ratios are and where Zeff is the effective atomic number (~6.7 for non-hydrogen protein atoms) and is . FP and FA are structure-factor magnitudes of real contributions from the complete molecule and from anomalous scatterers only, respectively. Of course, the diffraction ratios will vary with scattering angle in the same way as the ratio of thermal and scattering factors for the anomalous scatterers to those of the other atoms. Except where noted all estimates are for CuKα radiation.
At low resolution (for example, 5.5 Å) these values are enhanced by a factor of 21/2 because the dimeric iron centre is then unresolved.
Oxygen anomalous scattering is computed for CrKα radiation.
Although Bijvoet differences may be small, with appropriate experimental design most systematic errors can be eliminated. Moreover, as only a single crystalline species is used, derivatives need not be isomorphous. Also, phasing power carries on well to high resolution, although high resolution is not a requirement. We have recently solved the structure of a trimeric haemerythrin at 5.5 Å resolution using Fe-resolved anomalous phasing followed by molecular averaging for phase refinement (J. L. Smith and W. A. H., unpublished). The possibility of performing multi-wavelength experiments at synchrotrons35–37 enhances the promise for anomalous-scattering applications.
The crystal structure of crambin should be a good model for exploring protein conformations, fluctuations and solvent interactions in extraordinary detail. Further diffraction studies and toxicity analyses are in progress.
Acknowledgments
We thank Jane Richardson for her drawings, Gary Quigley for his plotting programs, and Janet Smith and Jerome Karle for discussions. This work was supported in part by NSF grant PCM80-03929 to M.M.T.
Contributor Information
Wayne A. Hendrickson, Laboratory for the Structure of Matter, Naval Research Laboratory 6030, Washington DC 20375, USA
Martha M. Teeter, Department of Chemistry, Boston University, 685 Commonwealth Avenue, Boston, Massachusetts 02215, USA
References
- 1.Bijvoet JM. Proc Acad Sci Arnst. 1949;B52:313–314. [Google Scholar]
- 2.Ramaseshan S, Abrahams SC, editors. Anomalous Scattering. Munksgaard; Copenhagen: 1975. [Google Scholar]
- 3.Peerdeman AF, Bijvoet JM. Acta crystallogr. 1956;9:1012–1015. [Google Scholar]
- 4.Ramachandran GN, Raman S. Curr Sci. 1956;25:348–351. [Google Scholar]
- 5.Okaya Y, Pepinsky R. Phys Rev. 1956;103:1645–1647. [Google Scholar]
- 6.Blundell TL, Johnson LN. Protein Crystallography. Academic; London: 1976. [Google Scholar]
- 7.Blow DM. Proc R Soc. 1958;A247:303–336. [Google Scholar]
- 8.Rossmann MG. Acta crystallogr. 1961;14:383–388. [Google Scholar]
- 9.North ATC. Acta crystallogr. 1965;18:212–216. [Google Scholar]
- 10.Matthews BW. Acta crystallogr. 1966;20:82–86. [Google Scholar]
- 11.Hendrickson WA. Acta crystallogr. 1979;A35:245–247. [Google Scholar]
- 12.Van Etten CH, Nielsen HC, Peters JE. Phytochemistry. 1965;4:467–473. [Google Scholar]
- 13.Teeter MM, Hendrickson WA. J molec Biol. 1979;127:219–223. doi: 10.1016/0022-2836(79)90242-0. [DOI] [PubMed] [Google Scholar]
- 14.Llinás M, De Marco A, Lecomte JTJ. Biochemistry. 1980;19:1140–1145. doi: 10.1021/bi00547a016. [DOI] [PubMed] [Google Scholar]
- 15.Teeter MM, Mazer JA, L’Italien JJ. Biochemistry. doi: 10.1021/bi00522a013. (submitted) [DOI] [PubMed] [Google Scholar]
- 16.Mak AS, Jones BL. Can J Biochem. 1976;22:835–842. doi: 10.1139/o76-120. [DOI] [PubMed] [Google Scholar]
- 17.Samuelsson G, Seger L, Olson T. Acta chem Scand. 1968;22:2624–2642. doi: 10.3891/acta.chem.scand.22-2624. [DOI] [PubMed] [Google Scholar]
- 18.Van Etten CH, et al. Cereal Chem. 1969;46:145–155. [Google Scholar]
- 19.Hendrickson WA, Klippenstein GL, Ward KB. Proc natn Acad Sci USA. 1975;72:2160–2164. doi: 10.1073/pnas.72.6.2160. [DOI] [PMC free article] [PubMed] [Google Scholar]
- 20.Lenhert PG. J appl Crystallogr. 1975;8:568–570. [Google Scholar]
- 21.Hanson JC, Watenpaugh KD, Sieker L, Jensen LH. Acta crystallogr. 1979;A35:616–621. [Google Scholar]
- 22.North ACT, Phillips DC, Mathews FS. Acta crystallogr. 1968;A24:351–359. [Google Scholar]
- 23.Karle J, Hauptman H. Acta crystallogr. 1953;6:473–476. [Google Scholar]
- 24.Matthews BW, Czerwinski EW. Acta crystallogr. 1975;A31:480–487. [Google Scholar]
- 25.Cramer DT. International Tables of X-ray Crystallography. Vol. 4. Kynoch; Birmingham: 1974. pp. 148–151. [Google Scholar]
- 26.Blow DM, Crick FHC. Acta crystallogr. 1959;12:794–802. [Google Scholar]
- 27.Ten Eyck LF, Arnone A. J molec Biol. 1976;100:3–11. [Google Scholar]
- 28.Sim GA. Acta crystallogr. 1959;12:813–815. [Google Scholar]
- 29.Hendrickson WA. Acta crystallogr. 1971;B27:1474–1475. [Google Scholar]
- 30.Hendrickson WA, Lattman EE. Acta crystallogr. 1970;B26:136–143. [Google Scholar]
- 31.Sayre D. Acta crystallogr. 1974;A30:180–184. [Google Scholar]
- 32.Hendrickson WA, Konnert JH. In: Computing in Crystallography. Diamond R, Ramaseshan S, Venkatesan K, editors. Indian Academy of Sciences; Bangalore: 1980. pp. 13.01–13.23. [Google Scholar]
- 33.Konnert JH, Hendrickson WA. Acta crystallogr. 1980;A36:344–350. [Google Scholar]
- 34.Schulz GE, Schirmer RH. Principles of Protein Structure. Springer; New York: 1979. [Google Scholar]
- 35.Templeton DH, Templeton LK, Phillips JC, Hodgson KO. Acta crystallogr. 1980;A36:436–442. [Google Scholar]
- 36.Phillips JC, Hodgson KO. Acta crystallogr. 1980;A36:856–864. [Google Scholar]
- 37.Karle J. Int J quant Chem. (in the press) [Google Scholar]
- 38.Tsernoglou D, Petsko GA. FEBS Lett. 1976;68:1–4. doi: 10.1016/0014-5793(76)80390-0. [DOI] [PubMed] [Google Scholar]
- 39.Carter CW, Jr, Kraut J, Freer ST, Alden RA. J biol Chem. 1974;249:6339–6346. [PubMed] [Google Scholar]
- 40.Wang AHJ, et al. Nature. 1979;282:680–686. doi: 10.1038/282680a0. [DOI] [PubMed] [Google Scholar]
- 41.Karle IL, Wieland T, Schermer D, Ottenheym HCJ. Proc natn Acad Sci USA. 1979;76:1532–1536. doi: 10.1073/pnas.76.4.1532. [DOI] [PMC free article] [PubMed] [Google Scholar]
- 42.Kendrew JC, et al. Nature. 1960;185:422–427. doi: 10.1038/185422a0. [DOI] [PubMed] [Google Scholar]
- 43.Blake CCF, et al. Nature. 1965;206:757–761. doi: 10.1038/206757a0. [DOI] [PubMed] [Google Scholar]


