Abstract
Emotional experience changes visual perception, leading to the prioritization of sensory information associated with threats and opportunities. These emotional biases have been extensively studied by basic and clinical scientists, but their underlying mechanism is not known. The present study combined measures of brain-electric activity and autonomic physiology to establish how threat biases emerge in human observers. Participants viewed stimuli designed to differentially challenge known properties of different neuronal populations along the visual pathway: location-, eye-, and orientation-specificity. Biases were induced using aversive conditioning with only one combination of eye, orientation, and location predicting a noxious loud noise and replicated in a separate group of participants. Selective heart-rate orienting responses for the conditioned threat stimulus indicated bias formation. Retinotopic visual brain responses were persistently and selectively enhanced after massive aversive learning for only the threat stimulus and dissipated after extinction training. These changes were location-, eye-, and orientation-specific, supporting the hypothesis that short-term plasticity in primary visual neurons mediates the formation of perceptual biases to threat.
Keywords: Perception, bias, threat, aversive learning, V1
Introduction
The accurate and efficient perception of threat facilitates adaptive behavior and thus promotes survival of the individual and the species. Accordingly, the human brain has evolved mechanisms that bias the limited capacity of perceptual systems towards danger (Bradley, Keil, & Lang, 2012). Threat biases—defined as the facilitated perception of threat stimuli, compared to neutral stimuli—are documented in experimental psychology (e.g., Öhman, Flykt, & Esteves, 2001), cognitive neuroscience (Markovic, Anderson, & Todd, 2014), and emotion psychopathology (Bar-Haim, Lamy, Pergamin, Bakermans-Kranenburg, & Van Ijzendoorn, 2007). Altering threat biases through training is also considered a treatment option for psychiatric disorders in the anxiety and depression spectrum (Amir, Beard, Burns, & Bomyea, 2009). The neurocognitive mechanisms underlying the formation of threat biases are unknown, however. Based on work in the rodent model (e.g., Bakin & Weinberger, 1990), it has been hypothesized that one potential mechanism involves neurons in primary visual cortex (V1) altering their tuning behavior, to selectively amplify visual stimuli that are reliably associated with noxious outcomes (Miskovic & Keil, 2012; Stolarova, Keil, & Moratti, 2006). This hypothesis is tested in the current brief report.
Experience-dependent plasticity in visual neurons has been documented in various non-human species (Shuler & Bear, 2006; Dragoi, Sharma, & Sur, 2000; Schummers, Sharma, & Sur, 2005; Li, Piëch, & Gilbert, 2004), and human observers (Gutnisky, Hansen, Iliescu, & Dragoi, 2009). Corroborating these findings, research on perceptual learning has demonstrated alterations of early brain potentials after extensive training of contrast detection (Bao, Yang, Rios, He, & Engel, 2010) or texture discrimination (Pourtois, Rauss, Vuilleumier, & Schwartz, 2008). These changes are specific to retinal location, traditionally taken as evidence of visual plasticity when accompanied by eye-specificity and orientation-specificity (Fahle, 2005; Karni & Sagi, 1991). The question arises whether plastic changes in V1 neurons are also observed when participants learn that a visual stimulus predicts aversive outcomes.
The C1 component (Jeffreys & Axford, 1972) of the event-related brain potential (ERP) reflects electrophysiological activity produced by the first afferent volley from the thalamus to V1 (Di Russo, Martínez, Sereno, Pitzalis, & Hillyard, 2002; Foxe & Simpson, 2002; Martínez et al., 1999). It reliably differs from baseline at latencies around 50 milliseconds and reverses polarity when stimulating the upper versus lower visual field, reflecting the retinotopic organization of the human primary visual cortex (Jeffreys & Axford, 1972; Clark, Fan, & Hillyard, 1994). Based on evidence that the C1 is potentiated after evaluative conditioning (Stolarova et al., 2006), we utilize this signal to examine changes in afferent visuo-cortical responses during threat bias formation. Specifically, the present study tests the hypothesis that extensive associative pairing of a neutral visual stimulus with a noxious outcome leads to plastic changes in location-, eye-, and orientation-specific visual neurons, found predominantly in V1. We fully crossed three stimulus parameters that differentially challenge known properties of different neuronal populations along the visual pathway: location, viewing eye (ocular channel), and orientation. A loud noise (unconditioned stimulus, US) was paired with one combination of these parameters (CS+), while all other combinations served as unpaired control stimuli (CS-). Analyses were conducted on the rising slope of the C1 component (Ales, Yates, & Norcia, 2010; Kelly, Schroeder, & Lalor, 2013) to maximize sensitivity to early afferent processes. Together, this experimental setup allows identification of the locus of threat bias formation, with effects at the thalamic (eye- and location specific, but not orientation specific), primary visual (eye-, location- and orientation specific), and post-primary visual processes (not affecting the C1 component) readily identified by unique patterns of results.
Method
Participants
Forty-nine healthy volunteers (41% women; mean age = 22; SD = 3.6) participated. Experiment 1 involved electrocardiogram (ECG) recordings from 17 participants, and Experiment 2 involved EEG recordings from 27 participants. Five additional participants were excluded due to excessive EEG artifacts (i.e. more than 50% bad trials). Sample size was based on previous experiments (Moratti & Keil, 2005; Stolarova et al., 2006). Procedures were consistent with the Declaration of Helsinki and approved by the institutional review board of the University of Florida.
Stimuli
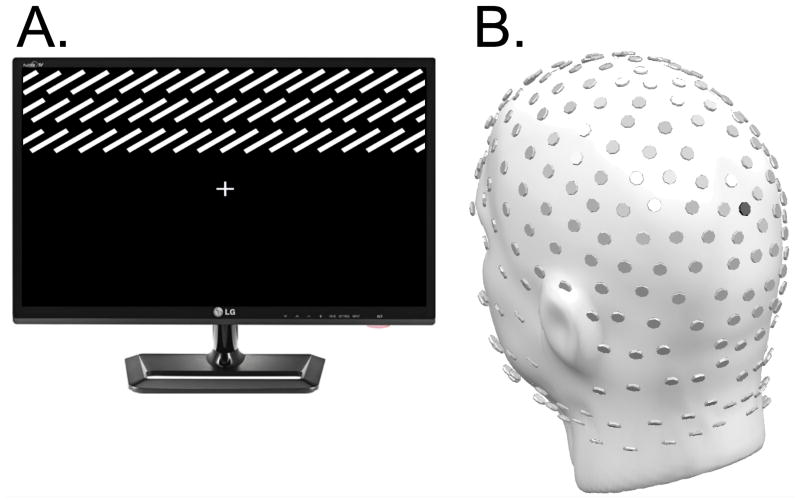
Four gradient field textures (Figure 1a) comprising 250 white parallel lines (luminance 117 cd/m2) were displayed on a black background (luminance 0.35 cd/m2). Textures occupied a visual angle of 3.3° vertically and 13.3° horizontally. They appeared in the upper or lower visual field, their inner edge being either 1.7° above or 1.7° below a central fixation cross. Textures differed in orientation, achieved by rotating lines relative to a vertical axis: either +75° or -75°.
Figure 1.
Example Stimulus and EEG sensor array: (A) Representation of one of four gradient field stimuli (individual lines are enlarged for demonstration purposes, and thus there are fewer lines than were presented to participants). Gradient fields comprised lines oriented either at -75° or +75° relative to a vertical axis, and were located in either the upper or lower visual field relative to the fixation cross. The example illustrates a stimulus with a +75° orientation located in the upper visual field. (B) Layout of the 256-channel HydroCel Geodesic Sensor Array used for data acquisition in the current study. For reference, sensor POz is highlighted in black.
Procedure
Participants were seated in a dimly lit Faraday chamber, using a head rest keeping eyes 1.2 meters away from a 23-inch 3-D LED monitor (Samsung S23A750D), viewed through a shielded window. The sound-attenuated chamber contained two 15-watt speakers, located behind the participant. A detection task at fixation was implemented to encourage vigilance and promote fixation compliance. Participants clicked the left mouse button upon noticing an occasional (5–15 seconds) color change in the fixation cross from white to red.
Experiment 1: Selective heart-rate changes during hemifield-specific differential classical conditioning: Pilot
Experiment 1 (n = 17) aimed to establish whether aversive conditioning with gradient field textures results in biased reactivity. The cardiac orienting response on CS+ trials, compared to CS- trials, was used as an index of threat bias formation (Bradley et al., 2012; Moratti & Keil, 2005). The experiment comprised three phases: habituation (36 trials), acquisition (53 trials), and extinction (10 trials). Stimuli appeared pseudo-randomly for 566.6 milliseconds every 8–12 seconds. Each stimulus appeared the same number of times in each phase and did not occur more than twice consecutively.
During acquisition, the CS+ was paired with the US: a 92 dB (SPL) white noise burst lasting 500 ms. The US was presented for 500 milliseconds, 66.6 milliseconds after CS+ onset, such that the CS+ and US co-terminated. The first 9 trials of acquisition began with 100% reinforcement, and the rest of acquisition had 25% reinforcement. None of the paired trials were used for analysis.
Experiments 2a and 2b: Conditioning-related changes in retinotopic visual cortex
Experiment 2 followed the structure of Experiment 1, with adjustments made to obtain sufficient signal-to-noise ratios for the small-amplitude C1 component. Experimental phases contained 960 trials each, with a 45% reinforcement rate during acquisition. To reduce the length of the experiment to 80 minutes, the stimulus appeared every .5-2 seconds and presentation was shortened to 66.67 milliseconds, except on paired CS+ trials where presentation was 566.66 milliseconds to accommodate the US, which were not analyzed. This prevented us from obtaining slow autonomic signals such as heart-rate or skin conductance. Viewing eye was manipulated by means of adjustable occlusion goggles blocking one eye. Occluded eye alternated every block (240 trials, 12 blocks total) with block order counterbalanced across participants.
During acquisition, Experiment 2a (n = 17) paired the US with a CS+ of -75° orientation, presented in the lower location, to the right eye, while Experiment 2b (n = 10), paired the US to a CS+ of +75° orientation, presented in the upper location, to the left eye. To control for US-induced changes in arousal, negative affect, or attention, which influence C1 amplitude (Rossi & Pourtois, 2012; Vanlessen, Rossi, De Raedt, & Pourtois, 2013), the same number of USs were presented randomly during the inter-trial-interval in CS- ocular channel blocks.
Data acquisition and reduction
Heart-Rate
ECG was recorded from medial portions of the lower arm using a Biopac system, digitized at 200Hz and filtered with a passband of 0.1 to 50Hz. R-waves were detected off-line and heart-rate change waveforms calculated as described by Graham (1978).
Brain Electrophysiology
In Experiment 2, EEG was continuously recorded with a 257-channel sensor array (Electrical Geodesics, Eugene, OR; Figure 1b). Impedance was kept below 50 kΩ, and the vertex electrode (Cz) was used as the recording reference. All channels were digitized at a rate of 500 Hz and filtered online using a low-pass elliptical filter with a 3 dB point (cut-off) set at 200 Hz, and a high-pass elliptical filter with a 3 dB point (cut-off) set at .01 Hz.
Filtering and Channel Interpolation
Off-line filtering was performed on the continuous EEG data using a 2nd order Butterworth high-pass filter with a 1 dB point (cut-off) at .5 Hz and 18 dB attenuation at 0.05 Hz, and a 23rd order Butterworth low-pass filter with a 3 dB point at 40 Hz, and 45 dB attenuation at 50 Hz. Bad channels were detected based on the recording reference (Junghöfer, Elbert, Tucker, & Rockstroh, 2000) and interpolated for channels showing outlying (5 SD outside the median) three statistical metrics: absolute voltage, SD of the voltage, and maximum gradient between subsequent sample points (Junghöfer, Elbert, Leiderer, Berg, & Rockstroh, 1997). The resulting data were converted to an average reference.
Trial Segmentation and Rejection
Epochs were segmented between -200 and 800 milliseconds relative to texture onset. Epochs underwent semi-automatic artifact rejection (Junghöfer et al., 2000), leaving an average of 102 (SD = 9) trials per condition. The artifact rejection procedure aimed to exclude any trials containing blinks or eye movements, as detected by electrooculogram (EOG) sensors, as well as other sources of artifact.
Statistical analyses
Heart-rate
Orienting to threat is characterized by cardiac deceleration following the onset of the threat stimulus (Graham & Clifton, 1966). Heart-rate deceleration was compared 2-5 seconds after stimulus onset for the CS+ with each of the three CS- (Panitz, Hermann, & Mueller, 2015) using t-tests. 95% Confidence intervals and Cohen's d effect size estimates are also reported.
C1 Amplitude
The rising slope of the C1 component was quantified by measuring the mean voltage from 64 to 90 milliseconds after stimulus-onset at sensor POz. F-values and effect sizes (partial eta squared) were obtained by repeated-measures analysis of variance (ANOVA) containing within-factors of orientation, location, and eye. Only values from acquisition entered the ANOVA. Significant (p<0.05) effects in this omnibus ANOVA were followed by post-hoc ANOVAs (all corrected for deviations in sphericity; Greenhouse & Geisser, 1959), or by paired t-tests. To enable combined analysis of Experiments 2a and 2b (with opposite location of the CS+), the C1 amplitude in Experiment 2b was multiplied by -1 before entering the ANOVA. To assess the robustness of differences between the multiple CS- and the CS+ within each visual field separately (accommodating systematic differences in C1 morphology for upper/lower field stimuli), comparisons were modeled in a GLM with weights [-.5, -.5, -.5, 1.5] in a planned contrast, based on the prediction that aversive conditioning prompts orientation-specific and eye-specific changes, selectively for the CS+ visual field. To examine the temporal specificity of the predicted effects, a paired-samples t-test was conducted for every sample point in the ERP epoch, comparing the CS+ and the CS- sharing stimulated location and eye but differing in orientation. To correct for multiple comparisons and provide a conservative test of significance, significance thresholds were determined by calculating 1,000 t-tests on randomly permuted data sets (Groppe, Urbach, & Kutas, 2011), resulting in a critical t-value of 2.7 (0.025 tails) of the empirical permutation distribution.
Results
Behavioral Data
Contingency Awareness
After the experiment, participants answered questions regarding the contingencies (Weike et al., 2005). None of the participants correctly reported awareness of the pairing between the CS+ and US, although 8 participants correctly noticed a relation between stimulus location and the US.
Fixation Task
Mean detection accuracy for the color change of the fixation cross was 93.7% (SD = 9.5%). Mean response latency was 490 milliseconds (SD = 30).
Experiment 1. Aversive conditioning potentiates heart-rate deceleration to the threat stimulus
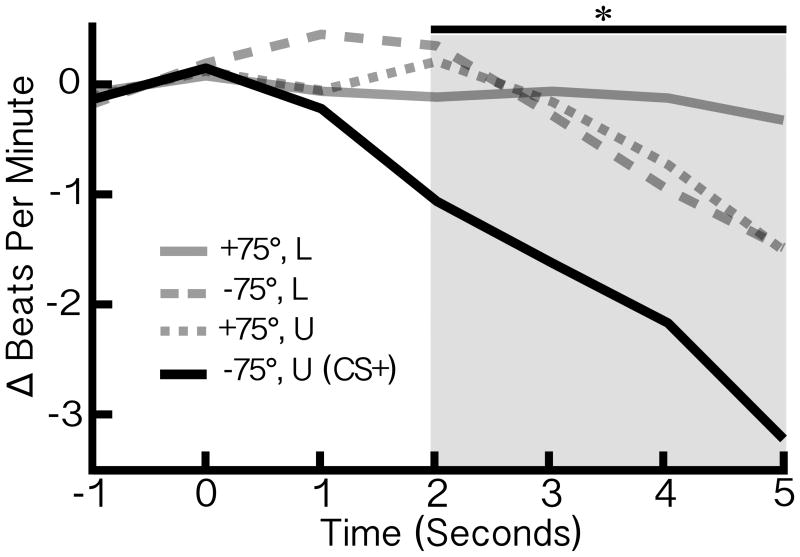
As shown in Figure 2, the CS+ prompted greater HR deceleration (orienting), compared to CS- textures: the CS- sharing location but not orientation, t(16) = -3.792, p = .002, 95% CI = [-1.353, -.383], d = 1.145, the CS- sharing orientation but not location, t(16) = -4.211, p = .001, 95% CI = [-1.080, -.357], d = .9479, and the CS- sharing neither property, t(16) = -2.390, p = .030, 95% CI = [-1.230, -.074], d = .8598.
Figure 2.
Experiment 1: Heart-Rate. Grand averaged ΔBPM (n = 17), during the acquisition phase. Labels represent the gradient field stimuli, in terms of (1) orientation relative to a vertical axis and (2) visual field, either lower (L) or upper (U). The stimulus paired with the noxious sound evoked a significantly larger heart-rate deceleration compared to all three unpaired stimuli, as indicated by the shaded window.
Experiment 2: Aversive conditioning selectively potentiates the C1 amplitude
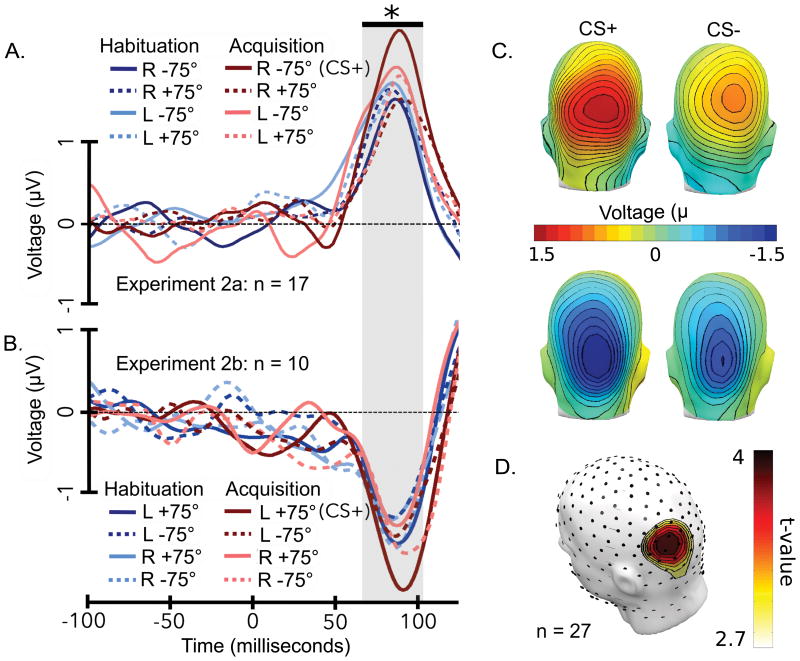
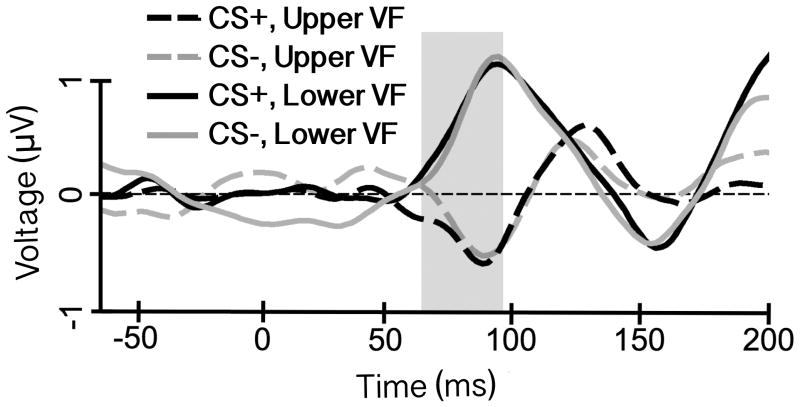
The C1 peaked 95 milliseconds post-stimulus at parieto-occipital sensors as a function of stimulus location (Figure 3), its small magnitude being consistent with previous C1 studies (Martínez et al., 1999; Di Russo et al., 2002; Stolarova et al., 2006). As expected, the ANOVA indicated a main effect of location, reflecting the polarity reversal of the C1 component, F(1,26) = 10.831, p = .003, ηp2 = .294. A three-way interaction was observed between factors EYE, LOCATION, and ORIENTATION, F(1,26) = 4.422, p = .045, ηp2 = .145.
Figure 3.
C1 component. Grand mean ERPs are shown both as waveforms (sensor POz) and as topographies (mean across the rising slope of the C1 window, which is thought to reflect the afferent response to early visual cortex). For Experiment 2a, all lower visual field stimuli are shown (A) for acquisition and habituation, to compare the stimulus paired with a loud noise (CS+), against seven unpaired control conditions. (B) For Experiment 2b, all upper visual field stimuli are shown for acquisition and habituation. Note that opposite-field ERPs were also available in each experiment, but are not shown here. A black bar and grey box denote the time window during which the C1 elicited by the CS+ was significantly heightened (p < .05, permutation controlled test, to provide a more conservative test of significance) compared to control conditions. (C) To visualize the spatial distribution of the early C1 component, the mean across the time points highlighted by the grey box are shown as topographical distributions of voltage covering the scalp for Experiment 2a and Experiment 2b. (D) The topographical distribution of t-values that exceed the permutation controlled critical t-value is depicted for the rising slope of the C1 component.
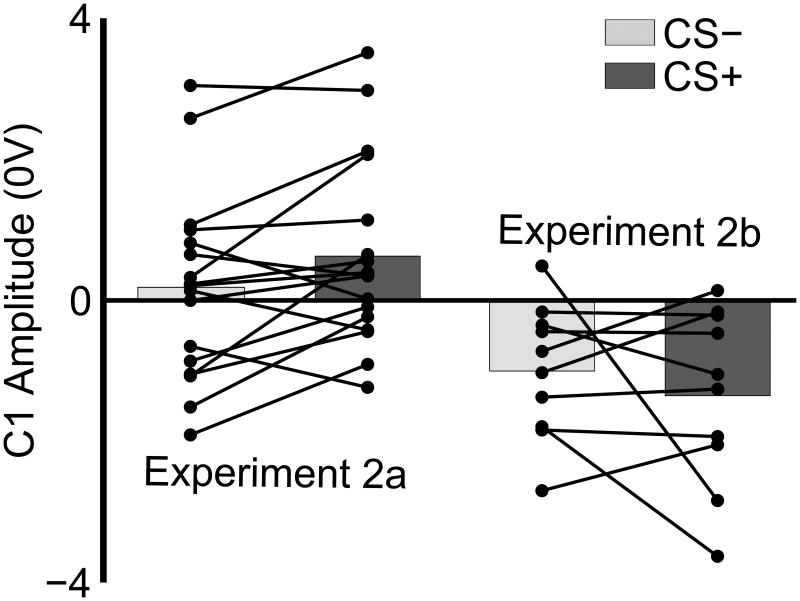
Follow-up ANOVAs for each location demonstrated that the CS+ location was sensitive to the interaction of eye and orientation, F(1,26) = 5.880, p = .023, ηp2 = .184, while the CS- location was not. Within the CS+ location, t-tests on either eye revealed heightened amplitudes for the CS+ orientation relative to the CS- orientation, for the CS+ eye, t(26) = 2.199, p = .037, d = 0.334, but not for the CS- eye. Relative amplification of the C1 magnitude for the CS+ compared to the CS- sharing all features except orientation was consistently seen across subjects when scored at the same standard sensor POz (Figure 4).
Figure 4.
Aversive learning augments early neurophysiological responses: Individual participants. The mean rising slope of the C1 evoked by CS- and unpaired CS+ trials are shown for individual participants (each black line). In both cases, the CS+ was significantly augmented relative to the CS-. The CS- shown here shares location and eye, but not orientation with the CS+. Note that the CS+ was presented in the lower visual field during Experiment 2a, and the upper visual field during Experiment 2b, reflected in the polarity reversal. Thus, across two groups of participants, aversive learning selectively augmented the neurophysiological response in the targeted afferent pathways to primary visual cortex.
The CS+ difference was robust relative to multiple control conditions, as demonstrated by the F-contrast, F(1,26) = 5.04, p = .028, r = .397. In habituation and extinction, no interactions between eye, location, or orientation were found (Figure 5). Thus, a threat bias in the C1 did not exist during habituation and dissipated during extinction, supporting the specificity of the small but reliable C1 effect observed during acquisition.
Figure 5.
Extinction. ERPs represent averaged activity following two stimuli during the extinction phase of the experiment. The CS+ and a representative CS- are shown from Experiment 2a (lower visual field) and Experiment 2b (upper visual field). The CS- shown here shares location and eye, but not orientation with the CS+. Unlike in the acquisition phase, the rising slope of the C1 component was not significantly different (p > .05) between CS- and CS+ conditions in the extinction phase.
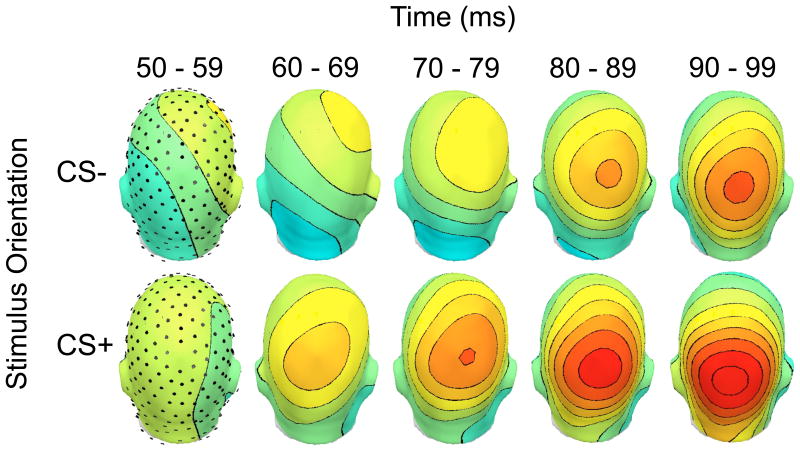
Finally, permutation-controlled running t-tests at each sample point indicated an increase in amplitude for the CS+ during the early C1 time range, between 64-104 milliseconds post-stimulus at parieto-occipital sensors (Figure 3). The topographical distribution of the rising slope of the C1 component was stable during this period, with a parietal maximum (Figure 6). These permutation-controlled tests reached significance for Experiments 2a and 2b individually, indicating replication across the two groups.
Figure 6.
Stability of the topographical distribution during the rising slope of the C1. To demonstrate the stability of the topography, a back view of the rising slope of the C1 component is shown for participants in Experiment 2a (n = 17), comparing the CS+ (lower visual field, right eye, -75°) to an example CS- (lower visual field, right eye, +75°). The CS+ elicited a larger C1 component than the CS-. Voltage topographies are shown for five 10 millisecond bins from 50-99 milliseconds post-stimulus. The color axis ranges from -2 (blue) to 2 (red) μV.
Discussion
The present studies tested the hypothesis that aversive learning selectively changes the sensitivity of afferent connections in V1. First, we established that the present aversive conditioning paradigm was successful in producing a conditioned heart-rate orienting response, suggesting a selective threat bias for the CS+. Second, two strategies established a primary visual locus of the ERP changes observed: (1) We quantified the rising slope of the C1 visual ERP component, which largely reflects the initial afferent activity of the visual cortex (Foxe & Simpson, 2002). (2) We manipulated stimulus orientation, location, and viewing eye, with only one combination of these factors (the CS+) reliably predicting a noxious noise (the US). Consistent with a hypothesis of early visual cortical plasticity, the rising slope of the C1 deflection was selectively heightened for stimuli that matched the ocular channel, visual field, and orientation consistent with the CS+, compared to all unpaired control stimuli. Effects emerged during massive conditioning, and dissipated during extinction learning, thus representing a potential laboratory model of perceptual biases acquired through emotional learning in daily life.
The observed neurophysiological changes support the notion of short-term plasticity in the afferent information flow reaching V1 from the retina through the lateral geniculate nucleus (LGN) of the thalamus (Gilbert & Li, 2012). Specifically, the heightened C1 amplitude for CS+ only in the conditioned ocular channel suggests that experience-related changes occurred no later than early visual cortex, as subsequent areas are not retinotopically organized in ocular dominance columns (Ts'o, Frostig, Lieke, & Grinvald, 1990). Furthermore, orientation-specific amplification indicates that plastic changes occurred beyond the thalamus, as thalamic neurons are considered not orientation-specific without corticofugal input (Sillito, Cudeiro, & Murphy, 1993), even though this broad view has recently been challenged (Sun, Tan, Mensh, & Ji, 2016). Our results are broadly consistent with a Hebbian process in which V1 neurons that are engaged during exposure to a noxious outcome change their sensitivity (Cooke & Bear, 2010), likely via synaptic plasticity in layer 4 of striate cortex (McLaughlin, Shapley, Shelley, & Wielaard, 2000). Such a mechanism is consistent with rodent data showing that sensory neurons in infragranular layers of V1 change their connectivity to represent acquired intermodal associations between motivationally neutral stimuli (Headley & Weinberger, 2015).
The amygdaloid complex possesses bi-directional connections with V1 in primates and rodents (Pessoa & Adolphs, 2010) and may be involved in altering the tuning properties of V1 (Dejean et al., 2016). In addition, several local mechanisms for experience-dependent cortical reorganization in visual neurons have been proposed, including dopamine and acetylcholine release (Chen et al., 2012), which may cause a persistent potentiating or unmasking of recently active connections (Shuler & Bear, 2006). Overall, the present results support the notion that the formation of an aversively conditioned memory initially involves a widespread brain network, which over time may be sharpened to involve fewer, more specialized units, including sensory neurons (Miskovic & Keil, 2012). Although contingency awareness does not seem to be necessary to observe this sharpened response in sensory neurons (Moratti, Keil, & Miller, 2006), it is unclear if inter-individual differences in awareness or emotional reactivity affect the present findings. We have recently replicated the C1 effect reported here in a sample (n = 24) of fully aware observers, suggesting that awareness may not play a major role. In terms of clinical implications, one prominent model suggests that individuals diagnosed with anxiety disorders over-generalize the fear response to stimuli that resemble the original conditioned stimulus (Kaczkurkin & Lissek, 2013). The current paradigm may open avenues for examining how this model applies to implicit, early perceptual processes.
In summary, the present study highlights experience-dependent plasticity in V1 as one possible mechanism that underlies the amplification of cortical responses to conditioned threat signals. This modulation of initial afferent activity, once established, does not seem to require inter-area feedback signals, paralleling studies with perceptual learning paradigms. In conclusion, the constant adaptation of humans to the demands posed by an ever-changing environment involves adaptations at the lowest level of cortical sensory processing, facilitating detection and identification of threats or opportunities.
Acknowledgments
This research was supported by grants from the National Institutes of Health (R01MH097320) and the Office of Naval Research (N00014-14-1-0542). The authors are grateful to Mia Kelly, Ben McDonald, and Logan Dubnick, for help in data acquisition.
Footnotes
Data from Experiment 2a were previously presented as a poster at the 2015 Annual Meeting of the Society for Psychophysiological Research.
References
- Ales JM, Yates JL, Norcia AM. V1 is not uniquely identified by polarity reversals of responses to upper and lower visual field stimuli. NeuroImage. 2010;52(4):1401–1409. doi: 10.1016/j.neuroimage.2010.05.016. https://doi.org/10.1016/j.neuroimage.2010.05.016. [DOI] [PMC free article] [PubMed] [Google Scholar]
- Amir N, Beard C, Burns M, Bomyea J. Attention modification program in individuals with generalized anxiety disorder. Journal of Abnormal Psychology. 2009;118(1):28. doi: 10.1037/a0012589. [DOI] [PMC free article] [PubMed] [Google Scholar]
- Bakin JS, Weinberger NM. Classical conditioning induces CS-specific receptive field plasticity in the auditory cortex of the guinea pig. Brain Research. 1990;536(1):271–286. doi: 10.1016/0006-8993(90)90035-a. https://doi.org/10.1016/0006-8993(90)90035-A. [DOI] [PubMed] [Google Scholar]
- Bao M, Yang L, Rios C, He B, Engel SA. Perceptual Learning Increases the Strength of the Earliest Signals in Visual Cortex. The Journal of Neuroscience. 2010;30(45):15080–15084. doi: 10.1523/JNEUROSCI.5703-09.2010. https://doi.org/10.1523/JNEUROSCI.5703-09.2010. [DOI] [PMC free article] [PubMed] [Google Scholar]
- Bar-Haim Y, Lamy D, Pergamin L, Bakermans-Kranenburg MJ, Van Ijzendoorn MH. Threat-related attentional bias in anxious and nonanxious individuals: a meta-analytic study. Psychological Bulletin. 2007;133(1):1. doi: 10.1037/0033-2909.133.1.1. [DOI] [PubMed] [Google Scholar]
- Bradley MM, Keil A, Lang PJ. Orienting and emotional perception: facilitation, attenuation, and interference. 2012;493:3. doi: 10.3389/fpsyg.2012.00493. https://doi.org/10.3389/fpsyg.2012.00493. [DOI] [PMC free article] [PubMed] [Google Scholar]
- Chen N, Sugihara H, Sharma J, Perea G, Petravicz J, Le C, Sur M. Nucleus basalis-enabled stimulus-specific plasticity in the visual cortex is mediated by astrocytes. Proceedings of the National Academy of Sciences. 2012;109(41):E2832–E2841. doi: 10.1073/pnas.1206557109. https://doi.org/10.1073/pnas.1206557109. [DOI] [PMC free article] [PubMed] [Google Scholar]
- Clark VP, Fan S, Hillyard SA. Identification of early visual evoked potential generators by retinotopic and topographic analyses. Human Brain Mapping. 1994;2(3):170–187. https://doi.org/10.1002/hbm.460020306. [Google Scholar]
- Cooke SF, Bear MF. Visual Experience Induces Long-Term Potentiation in the Primary Visual Cortex. The Journal of Neuroscience. 2010;30(48):16304–16313. doi: 10.1523/JNEUROSCI.4333-10.2010. https://doi.org/10.1523/JNEUROSCI.4333-10.2010. [DOI] [PMC free article] [PubMed] [Google Scholar]
- Dejean C, Courtin J, Karalis N, Chaudun F, Wurtz H, Bienvenu TCM, Herry C. Prefrontal neuronal assemblies temporally control fear behaviour. Nature. 2016;535(7612):420–424. doi: 10.1038/nature18630. https://doi.org/10.1038/nature18630. [DOI] [PubMed] [Google Scholar]
- Di Russo F, Martínez A, Sereno MI, Pitzalis S, Hillyard SA. Cortical sources of the early components of the visual evoked potential. Human Brain Mapping. 2002;15(2):95–111. doi: 10.1002/hbm.10010. https://doi.org/10.1002/hbm.10010. [DOI] [PMC free article] [PubMed] [Google Scholar]
- Dragoi V, Sharma J, Sur M. Adaptation-Induced Plasticity of Orientation Tuning in Adult Visual Cortex. Neuron. 2000;28(1):287–298. doi: 10.1016/s0896-6273(00)00103-3. https://doi.org/10.1016/S0896-6273(00)00103-3. [DOI] [PubMed] [Google Scholar]
- Foxe JJ, Simpson GV. Flow of activation from V1 to frontal cortex in humans. Experimental Brain Research. 2002;142(1):139–150. doi: 10.1007/s00221-001-0906-7. https://doi.org/10.1007/s00221-001-0906-7. [DOI] [PubMed] [Google Scholar]
- Gilbert CD, Li W. Adult Visual Cortical Plasticity. Neuron. 2012;75(2):250–264. doi: 10.1016/j.neuron.2012.06.030. https://doi.org/10.1016/j.neuron.2012.06.030. [DOI] [PMC free article] [PubMed] [Google Scholar]
- Graham FK. Constraints on measuring heart rate and period sequentially through real and cardiac time. Psychophysiology. 1978;15(5):492–495. doi: 10.1111/j.1469-8986.1978.tb01422.x. [DOI] [PubMed] [Google Scholar]
- Graham FK, Clifton RK. Heart-rate change as a component of the orienting response. Psychological Bulletin. 1966;65(5):305–320. doi: 10.1037/h0023258. https://doi.org/10.1037/h0023258. [DOI] [PubMed] [Google Scholar]
- Greenhouse SW, Geisser S. On methods in the analysis of profile data. Psychometrika. 1959;24(2):95–112. https://doi.org/10.1007/BF02289823. [Google Scholar]
- Groppe DM, Urbach TP, Kutas M. Mass Univariate Analysis of Event-Related Brain Potentials/Fields II: Simulation Studies. Psychophysiology. 2011;48(12):1726–1737. doi: 10.1111/j.1469-8986.2011.01272.x. https://doi.org/10.1111/j.1469-8986.2011.01272.x. [DOI] [PMC free article] [PubMed] [Google Scholar]
- Gutnisky DA, Hansen BJ, Iliescu BF, Dragoi V. Attention Alters Visual Plasticity during Exposure-Based Learning. Current Biology. 2009;19(7):555–560. doi: 10.1016/j.cub.2009.01.063. https://doi.org/10.1016/j.cub.2009.01.063. [DOI] [PubMed] [Google Scholar]
- Headley DB, Weinberger NM. Relational Associative Learning Induces Cross-Modal Plasticity in Early Visual Cortex. Cerebral Cortex. 2015;25(5):1306–1318. doi: 10.1093/cercor/bht325. https://doi.org/10.1093/cercor/bht325. [DOI] [PMC free article] [PubMed] [Google Scholar]
- Jeffreys DA, Axford JG. Source locations of pattern-specific components of human visual evoked potentials. I. Component of striate cortical origin. Experimental Brain Research. 1972;16(1):1–21. doi: 10.1007/BF00233371. https://doi.org/10.1007/BF00233371. [DOI] [PubMed] [Google Scholar]
- Junghöfer M, Elbert T, Leiderer P, Berg P, Rockstroh B. Mapping EEG-potentials on the surface of the brain: A strategy for uncovering cortical sources. Brain Topography. 1997;9(3):203–217. doi: 10.1007/BF01190389. https://doi.org/10.1007/BF01190389. [DOI] [PubMed] [Google Scholar]
- Junghöfer M, Elbert T, Tucker DM, Rockstroh B. Statistical control of artifacts in dense array EEG/MEG studies. Psychophysiology. 2000;37(4):523–532. https://doi.org/null. [PubMed] [Google Scholar]
- Kaczkurkin AN, Lissek S. Generalization of Conditioned Fear and Obsessive-Compulsive Traits. Journal of Psychology & Psychotherapy. 2013;7:3. [PMC free article] [PubMed] [Google Scholar]
- Karni A, Sagi D. Where practice makes perfect in texture discrimination: evidence for primary visual cortex plasticity. Proceedings of the National Academy of Sciences. 1991;88(11):4966–4970. doi: 10.1073/pnas.88.11.4966. [DOI] [PMC free article] [PubMed] [Google Scholar]
- Kelly SP, Schroeder CE, Lalor EC. What does polarity inversion of extrastriate activity tell us about striate contributions to the early VEP? A comment on Ales et al. (2010) NeuroImage. 2013;76:442–445. doi: 10.1016/j.neuroimage.2012.03.081. https://doi.org/10.1016/j.neuroimage.2012.03.081. [DOI] [PubMed] [Google Scholar]
- Markovic J, Anderson AK, Todd RM. Tuning to the significant: neural and genetic processes underlying affective enhancement of visual perception and memory. Behavioural Brain Research. 2014;259:229–241. doi: 10.1016/j.bbr.2013.11.018. [DOI] [PubMed] [Google Scholar]
- Martínez A, Anllo-Vento L, Sereno MI, Frank LR, Buxton RB, Dubowitz DJ, Hillyard SA. Involvement of striate and extrastriate visual cortical areas in spatial attention. Nature Neuroscience. 1999;2(4):364–369. doi: 10.1038/7274. https://doi.org/10.1038/7274. [DOI] [PubMed] [Google Scholar]
- McLaughlin D, Shapley R, Shelley M, Wielaard DJ. A neuronal network model of macaque primary visual cortex (V1): Orientation selectivity and dynamics in the input layer 4Cα. Proceedings of the National Academy of Sciences. 2000;97(14):8087–8092. doi: 10.1073/pnas.110135097. https://doi.org/10.1073/pnas.110135097. [DOI] [PMC free article] [PubMed] [Google Scholar]
- Miskovic V, Keil A. Acquired fears reflected in cortical sensory processing: A review of electrophysiological studies of human classical conditioning. Psychophysiology. 2012;49(9):1230–1241. doi: 10.1111/j.1469-8986.2012.01398.x. https://doi.org/10.1111/j.1469-8986.2012.01398.x. [DOI] [PMC free article] [PubMed] [Google Scholar]
- Moratti S, Keil A. Cortical activation during Pavlovian fear conditioning depends on heart rate response patterns: An MEG study. Cognitive Brain Research. 2005;25(2):459–471. doi: 10.1016/j.cogbrainres.2005.07.006. https://doi.org/10.1016/j.cogbrainres.2005.07.006. [DOI] [PubMed] [Google Scholar]
- Moratti S, Keil A, Miller GA. Fear but not awareness predicts enhanced sensory processing in fear conditioning. Psychophysiology. 2006;43(2):216–226. doi: 10.1111/j.1464-8986.2006.00386.x. [DOI] [PubMed] [Google Scholar]
- Öhman A, Flykt A, Esteves F. Emotion drives attention: detecting the snake in the grass. Journal of Experimental Psychology: General. 2001;130(3):466. doi: 10.1037/0096-3445.130.3.466. [DOI] [PubMed] [Google Scholar]
- Panitz C, Hermann C, Mueller EM. Conditioned and extinguished fear modulate functional corticocardiac coupling in humans. Psychophysiology. 2015;52(10):1351–1360. doi: 10.1111/psyp.12498. https://doi.org/10.1111/psyp.12498. [DOI] [PubMed] [Google Scholar]
- Pessoa L, Adolphs R. Emotion processing and the amygdala: from a “low road” to “many roads” of evaluating biological significance. Nature Reviews Neuroscience. 2010;11(11):773–783. doi: 10.1038/nrn2920. https://doi.org/10.1038/nrn2920. [DOI] [PMC free article] [PubMed] [Google Scholar]
- Pourtois G, Rauss KS, Vuilleumier P, Schwartz S. Effects of perceptual learning on primary visual cortex activity in humans. Vision Research. 2008;48(1):55–62. doi: 10.1016/j.visres.2007.10.027. https://doi.org/10.1016/j.visres.2007.10.027. [DOI] [PubMed] [Google Scholar]
- Rossi V, Pourtois G. State-dependent attention modulation of human primary visual cortex: A high density ERP study. NeuroImage. 2012;60(4):2365–2378. doi: 10.1016/j.neuroimage.2012.02.007. https://doi.org/10.1016/j.neuroimage.2012.02.007. [DOI] [PubMed] [Google Scholar]
- Schummers J, Sharma J, Sur M. Bottom-up and top-down dynamics in visual cortex. Progress in Brain Research. 2005;149:65–81. doi: 10.1016/S0079-6123(05)49006-8. [DOI] [PubMed] [Google Scholar]
- Shuler MG, Bear MF. Reward Timing in the Primary Visual Cortex. Science. 2006;311(5767):1606–1609. doi: 10.1126/science.1123513. https://doi.org/10.1126/science.1123513. [DOI] [PubMed] [Google Scholar]
- Sillito AM, Cudeiro J, Murphy PC. Orientation sensitive elements in the corticofugal influence on centre-surround interactions in the dorsal lateral geniculate nucleus. Experimental Brain Research. 1993;93(1):6–16. doi: 10.1007/BF00227775. https://doi.org/10.1007/BF00227775. [DOI] [PubMed] [Google Scholar]
- Stolarova M, Keil A, Moratti S. Modulation of the C1 Visual Event-related Component by Conditioned Stimuli: Evidence for Sensory Plasticity in Early Affective Perception. Cerebral Cortex. 2006;16(6):876–887. doi: 10.1093/cercor/bhj031. https://doi.org/10.1093/cercor/bhj031. [DOI] [PubMed] [Google Scholar]
- Sun W, Tan Z, Mensh BD, Ji N. Thalamus provides layer 4 of primary visual cortex with orientation- and direction-tuned inputs. Nature Neuroscience. 2016;19(2):308–315. doi: 10.1038/nn.4196. https://doi.org/10.1038/nn.4196. [DOI] [PMC free article] [PubMed] [Google Scholar]
- Ts'o DY, Frostig RD, Lieke EE, Grinvald A. Functional organization of primate visual cortex revealed by high resolution optical imaging. Science. 1990;249(4967):417–420. doi: 10.1126/science.2165630. https://doi.org/10.1126/science.2165630. [DOI] [PubMed] [Google Scholar]
- Vanlessen N, Rossi V, De Raedt R, Pourtois G. Positive emotion broadens attention focus through decreased position-specific spatial encoding in early visual cortex: Evidence from ERPs. Cognitive, Affective, & Behavioral Neuroscience. 2013;13(1):60–79. doi: 10.3758/s13415-012-0130-x. https://doi.org/10.3758/s13415-012-0130-x. [DOI] [PubMed] [Google Scholar]
- Weike AI, Hamm AO, Schupp HT, Runge U, Schroeder HW, Kessler C. Fear conditioning following unilateral temporal lobectomy: dissociation of conditioned startle potentiation and autonomic learning. The Journal of Neuroscience. 2005;25(48):11117–11124. doi: 10.1523/JNEUROSCI.2032-05.2005. [DOI] [PMC free article] [PubMed] [Google Scholar]


