Abstract
Shear wave elastography is a versatile technique that is being applied to many organs. However, in tissues that exhibit anisotropic material properties, special care must be taken to estimate shear wave propagation accurately and efficiently. A two-dimensional simulation method is implemented to simulate the shear wave propagation in the plane of symmetry in transversely isotropic viscoelastic media. The method uses a mapped Chebyshev pseudo-spectral method to calculate the spatial derivatives and an Adams-Bashforth-Moulton integrator with variable step sizes for time marching. The boundaries of the two-dimensional domain are surrounded by perfectly matched layers (PML) to approximate an infinite domain and minimize reflection errors. In an earlier work, we proposed a solution for estimating the apparent shear wave elasticity and viscosity of the spatial group velocity as a function of rotation angle through a low frequency approximation by a Taylor expansion. With the solver implemented in MATLAB, the simulated results in this paper match well with the theory. Compared to the finite element method (FEM) simulations we used before, the pseudo-spectral solver consumes less memory and is faster and achieves better accuracy.
Keywords: Pseudo-spectral method, transversely isotropic, viscoelastic, shear wave, perfectly matched layer
3 Introduction
Many tissues such as skeletal muscle [23,22,18], kidney [2], tendon [9], liver [17], and heart [31] can be modeled as transversely isotropic and viscoelastic. With elastography methods such as ultrasound shear wave elastography [50] and magnetic resonance elastography [40], the speed and attenuation of propagating shear waves can be measured to derive the tissue mechanical properties, which can serve as biomarkers for diseases such as liver fibrosis [43] and breast cancer [7]. Applying elastography methods in anisotropic tissues requires care so that proper results may be obtained. Bias can occur if the directional dependence of the material properties is not taken into consideration.
The directionally dependent properties of tissues have been shown to have diagnostic values for a number of clinical applications. Diffusion weighted MRI, or diffusion weighted imaging (DWI) is a method that is used to understand the diffusion of free fluid within different tissues [39]. A related method called diffusion tensor MRI, or diffusion tensor imaging (DTI), allows for estimating an effective diffusion tensor [5]. The DTI method can be used to investigate anisotropic diffusion [6,44] and visualize fiber tracts in the brain and skeletal muscle [30,36,4,10,27]. In studies of muscle denervation in rodent models, the fractional anisotropy (FA), which describes the degree of anisotropy, evaluated with DTI were reduced as the muscles atrophied [49,56]. Additionally, another study with DTI in young and old human subjects, a correlation between decreasing FA and age was found [20]. A few studies have used DWI and DTI to examine patients with myositis [39,21,10]. Qi, et al., showed that diffusion coefficients were increased in muscles that had inflammation [45]. These studies with DWI and DTI, which are sensitive to muscle anisotropy, show that normal aging as well as disease processes change muscle anisotropy characteristics. Some drawbacks to DWI and DTI include the need for an MRI system and long acquisition times.
The advantage of DWI and DTI for various tissues is that they give information regarding how structure affects function. Another functional variable that can be evaluated is the tissue mechanical properties and their directional dependence. In fact, to fully characterize skeletal muscle, the elastic and viscous components of the tissue and their anisotropic distribution need to be measured [47]. A few ultrasound-based studies have addressed this problem in skeletal muscle. Wang, et al., [54] used a two-dimensional (2D) matrix ultrasound array to measure the fiber orientation and shear wave speed in skeletal muscles. Eby, et al., also examined the ex vivo brachialis muscle samples to measure shear moduli at different angles with respect to the fibers [19]. Gennisson, et al., investigated how muscle viscoelasticity changed along and across the fibers in biceps brachii with differing applied loads [24].
With an ultrasound-based shear wave method, Lee, et al., [31,32] mapped the myocardial fiber orientation in heart walls that can assist understanding and diagnosing hypertrophic or ischemic cardiomyopathy. The anisotropy of kidneys has been studied and the shear elasticity and viscosity were found to be angular dependent in renal cortex [2,25].
Simulating the shear wave propagation in a transversely isotropic, viscoelastic tissue can help validate the theoretical models and optimize data processing algorithms for reconstructing the tissue properties in anisotropic tissues [42,46,38]. In a recent publication, we proposed an approximated analytical solution for modeling the shear wave propagation in the plane of symmetry in a transversely isotropic viscoelastic medium [46]. The theory can help improve the precision of elastography when it is applied to such tissue types. This theory has been validated by numerical simulations performed with a three-dimensional (3D) Finite Element (FE) model [46]. In this work, we propose that shear wave propagation can also be simulated by an equivalent 2D model, which is much more efficient in terms of computational time and memory usage. We hypothesize that the numerical solutions obtained by the 2D method matches the theoretical model and it provides a faster and more accurate approach than the FEM models.
4 Methods
4.1 Wave Equations
The Voigt model is one of the most frequently used viscoelastic models in ultrasound elastography because of its simple form and effectiveness in modeling the spectral dispersion of shear wave velocity in soft tissues over moderate ranges of frequency [15,52]. In this work, instead of implementing a Voigt material directly, we approximated the Voigt material behaviors by a one-branch generalized Maxwell model with a method proposed in [46]. Using a generalized Maxwell model to emulate the Voigt model has the advantage of a better stability because the Voigt model doesn’t allow instantaneous deformation. This is especially troublesome when a Dirichlet boundary condition is desired, such as a case where displacement excitation needs to be applied. For a specialized formulation that directly simulates Voigt materials, please refer to [14].
The second-order elastodynamic equation in matrix notations can be written as [12],
| (1) |
where u is the particle displacement vector, variable f is the body force vector and C is the 6 × 6 stiffness matrix [12]. The operator ∇ is a symmetric gradient operator [12],
| (2) |
∇T is the matrix transpose of ∇. In this work, we used the stress-velocity formulation so the wave equations are first-order partial differential equations. Furthermore, we only considered the transverse motion in the x-y cross plane as shown in Figure 1. Because such wave motions polarize only in the z-direction, particle velocities vx and vy can be ignored. Also, because only shear stresses sxz and syz are relevant for such waves, other stress tensors sxx, syy, szz and sxy can be dropped from the equations. To introduce viscosity, we used memory variables to model the viscous strain rates [12,13]. Finally, after these simplifications, the velocity-stress formulation of the 2D viscoelastic wave equations of the shear motion in the plane of symmetry in a transversely isotropic medium can be expressed as,
| (3) |
| (4) |
| (5) |
| (6) |
| (7) |
Figure 1.
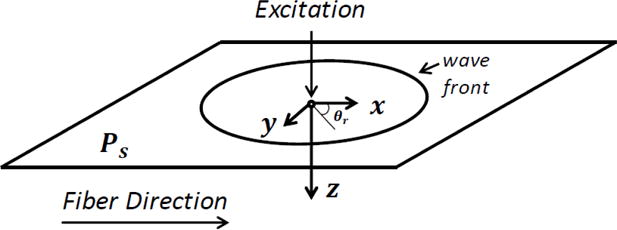
Setup for the transversely isotropic medium to be simulated. Direction of the tissue fibers is along the x axis. Plane x-y is the plane of symmetry Ps. Excitation is applied in the center of the plane and the generated shear waves travel radially from the source to the outside boundaries.
Note that the notations of the following variables have been simplified: v is the particle velocity of the shear wave polarized in the z-direction; the shear stresses sx and sy are the z-x and z-y stress components, respectively. A body force excitation f is vertically applied to the plane of symmetry (Figure 1). Memory variables mx and my are included for modeling viscous strains in x – and y – directions, respectively. Equations (6) and (7) are the two auxiliary differential equations associated with mx and my, respectively. The mass density of the material ρ is set at 1000 kg/m3 for modeling soft tissues. For a one-branch generalized Maxwell model, are the unrelaxed shear modulus in x – and y – directions, respectively; where are the corresponding shear elasticity of the emulated Voigt material. Time constants and are associated with the relaxation and creep responses, respectively; where are the shear viscosities of emulated Voigt material. The variable q is a factor used in approximating a Voigt material with a one-branch generalized Maxwell model [46]. The larger the value of q is, the better approximation can be achieved. However, as q gets very large, numerical errors will grow, instability will occur and computational time will increase [46]. In this work, we set q = 100 for a balance between accuracy in the Voigt approximation and computation time.
To minimize the reflections from the boundaries, the domain is surrounded by Perfectly Matched Layer (PML) conditions at all the edges. In this work, we used an unsplit formulation inside of the PML regions [34,35]. If we denote the spatial partial derivative of a function F with regard to x as , then with this method, will be replaced by , where is an auxiliary variable associated with the PML. As a result, the following auxiliary differential equation are introduced,
| (8) |
| (9) |
| (10) |
| (11) |
where αx and αy are the spatial profiles of a damping factor that are nonzero only inside of the PML. In the corners where αx and αy overlap, the damping factor is the summation in both directions. Usually the more points in the PML region, the more stable the simulation will be. However, expanding the PML region will shrink the useful size of the domain for the wave propagation problem. Also, greater values of αx and αy will dissipate the wave energy faster but may compromise the solver’s stability. The choices of the spatial profile of αx and αy will be discussed in the next section. Lastly, the disadvantage of including the PML is that the total number of simultaneous equations increases from five to nine.
When the material is close to elastic in either direction , then and Equations (6) and (7) become ill-conditioned and tend to vanish. In this case, to simulate pure elastic waves, we can set mxy = 0 and exclude these two equations. However, this requires rewriting the solver. In this paper, to avoid writing separate code, we set the time constants to be approximately the same, , by setting q to a small number, for example 0.01, quations (4) and (5) become independent from the viscous strains. For example, in this case Equation (6) is reduced to,
| (12) |
For an initial condition mx(t = 0) = 0, the solution is . If we denote the total simulated time as T and set , mx(t) ≈ 0 during [0, T] so the material properties are effectively elastic in the x direction. The same treatment can be applied to Equation (7). Even though this 2D solver does not seem to be excessively complicated and writing a separate solver for elastic wave is viable, a solver that can account both viscoelastic and elastic waves can help in unifying the problem and the elastic wave simulation can provide an additional validation for the solver.
4.2 Implementation
In this work, the spatial derivatives in Equations (3–11) are performed by a Chebyshev spectral method [1,8,51,55,41]. A function H(si) defined in [−1, +1] is sampled by collocation points in a Gauss–Lobatto space,
| (13) |
To find the derivative of H(si), the points are transformed to the Fourier domain by a fast Fourier transform (FFT) routine and a recursive rule is applied to the transformed points [8]. Then, an inverse Fourier transform is applied to obtain the derivative. If H(si) is defined in an arbitrary domain instead of [−1, +1], rescaling and shifting are applied 51].
One disadvantage of the Chebyshev method is that the mesh density is fine near the boundaries and coarse in the middle. For wave propagation problems, it is usually not useful to have fine mesh points near the borders of the domain. Also, for wave propagation problems, because the marching step in time is usually limited by the smallest grid size, having very fine mesh points near the boundary can significantly decrease the step size. This problem is addressed previously by applying a mapping function [29]. In this paper the excitation is applied in the center of the domain, so we would like to increase the mesh density in the center to capture the rapid change near the source. Therefore, we adapted a mapped Chebyshev method to map the original Chebyshev space with a polynomial function [1].
| (14) |
where x defines the points after the mapping, and a and p are the parameters of the polynomial mapping. The advantage of this mapping function is that it not only decreases the grid density around the boundaries but also increases the grid density near the center of the domain (Fig. 2). Compared to other mapping functions, this polynomial mapping has a lower spectral interpolation error [1].
Figure 2.
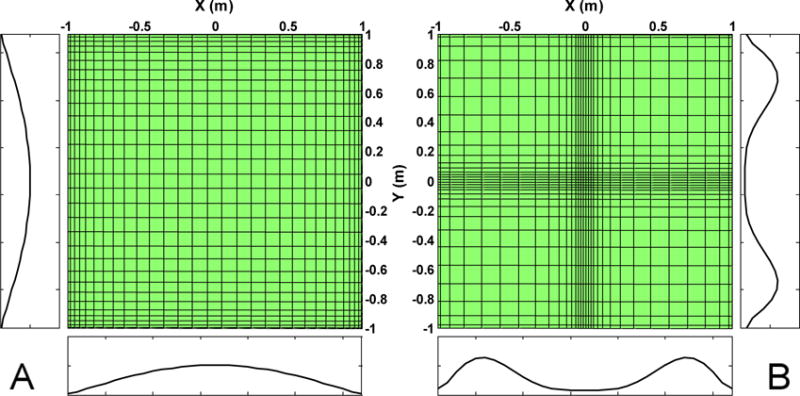
2D mesh grid before (A) and after (B) mapping. The two plots around each figure are the grid spacing in x and y directions. The domains of both directions are [−1, +1] meters. The numbers of points in both directions are 32. The parameters of the polynomial mappings in both directions are a = 0.2 and p = 2.0. the mapping procedures increase the mesh size around the boundaries and decrease the mesh size around the center.
In this paper, the spatial profiles of the damping factors αx and αy are polynomials. For example, in the x direction,
| (15) |
where x0 and X are the starting point and thickness of the PML, respectively, and β is the exponent of the polynomial profile that describes how fast the damping factor ramps up within the PML. The parameter αmax is the maximum damping value of the PML. In this paper, we use 15 points in the PML region and set αmax = 10,000, β = 2.0. According to [35], the reflection coefficient Rc has the following relationship with, αmax,
| (16) |
where cmax is the fastest wave speed in the simulation. In our case, because no compressional waves are simulated, we can assume the maximum shear speed cmax = 10m/s. Then our choices of αmax and β correspond to a reflection coefficient around 0.3%. A smaller reflection coefficient requires a greater αmax, which tends to introduce instability and, in turn, prolong the computation time. Some information about this topic will be provided in the Discussion section. Dirichlet boundary conditions are applied to the 4 sides of the 2D domain. Such a boundary will reflect the incident waves. With the presence of the PML layer, the wave energy is effectively diminished before getting back to the portion of the domain of interest.
The 2D shear wave solver is implemented in MATLAB (version 2013a, The MathWorks, Inc., Natick, MA) and an Adams-Bashforth-Moulton PECE integrator (ode113) is used to integrate over time. This integrator uses a multi-step scheme and variable time steps to improve the stability and speedup the computation. We also tried a variable step size Dormand-Prince integrator (ode45). Both solvers generate similar results, but our empirical tests suggest that for most cases the Adams-Bashforth-Moulton integrator is more stable than the Dormand-Prince integrator for the same step size and error tolerance. For example, for a same set of parameters (Nx = Ny =128, , , , ), ode113 needed 355 seconds for its computation time and ode45 needed 404 seconds. Note that the performance of an ODE integrator is highly dependent upon implementation and tuning parameters. The MATLAB manual suggests the Adams-Bashforth-Moulton method can be more efficient than the Dormand-Prince integrator for problems with stringent error tolerances or for computationally intensive problems [37].
4.3 Analytical Solution
We recently proposed an analytical solution for describing the shear wave propagation in the plane of symmetry in transversely isotropic viscoelastic tissues [46]. In this paper, we will compare the numerical results with this analytical solution. Here, for completeness, we briefly discuss the theory. Please refer to [46] for more details.
In a transversely isotropic material, the spatial group velocity Vr can be expressed as,
| (17) |
where G⊥ and G|| are shear moduli across and along the fiber direction, respectively and θr is the group angle of wave propagation (please refer to Figure 1 for the coordinate). When the media is viscoelastic, G⊥ and G|| should be substituted by their complex counterparts. We assume both complex shear moduli are Voigt type (this assumption is valid because viscoelasticity of biological tissues is usually best described by the Voigt model),
| (18) |
| (19) |
| (20) |
The parameters and are the shear elasticity and viscosity along the fiber direction and and are the shear elasticity and viscosity transverse to the fiber direction. is the complex shear modulus related to the spatial group velocity. The variable ω is the angular frequency in rad/s. In a recent work, we showed that a Taylor expansion can be applied to Equation (4) and the terms with order >1 can be ignored for weakly viscous materials at low frequency (under 1000 Hz) [46]. Using this approximation, the apparent shear elasticity and viscosity can be expressed as functions of the rotation angle θr as,
| (21) |
| (22) |
| (23) |
5 Results
We simulated shear wave propagation in a domain measuring 100 × 100 mm2. The center of the domain is excited by a Gaussian pulse in both time and space,
| (24) |
In this work, we set t0 = 100 μs and δt = 10 μs. We set A = 106, which is an arbitrary amplitude, and wx = wx = 0.5 mm. The number of sampling points in both x and y dimensions are 128 and the mapping parameters for both dimensions are a = 0.8 and p = 2.0. The values of a and p in Equation (14) were determined by empirical experiments to balance between numerical accuracy and computational efficiency. A more stringent analysis of the mapping functions can be established by studying an upper bound of the error when a function is represented by a Chebyshev expansion [26,1]. Table 1 lists the computation time, valid domain size, minimum and maximum mesh sizes for different combinations of a and p. Note that the values of a and p will change the size of the domain excluding the PML region. It is desired to maximize the domain size and minimize the computation time.
Table 1.
Effects of parameters a and p
| a | p | Computation Time (s) | Domain x, y (mm) |
|---|---|---|---|
| 0.8 | 2.0 | 358 | 41.4 |
| 0.8 | 4.0 | 223 | 36.9 |
| 0.4 | 2.0 | 285 | 39.7 |
| 0.4 | 4.0 | 175 | 34.0 |
The material properties are listed in Table 2. In this paper, we tested the solver with two different sets of material properties. The first set of parameters simulates a transversely isotropic, viscoelastic material, while the second case simulates a transversely isotropic, elastic material. These material properties are within the ranges measured in an ex vivo porcine muscle [46].
Table 2.
Material parameters
| Case |
|
|
|
|
||||
|---|---|---|---|---|---|---|---|---|
| 1 | 25 | 9 | 8 | 3 | ||||
| 2 | 25 | 9 | 0 | 0 |
Figures 3 and 4 show the results for case 1 and 2, respectively. In each figure, subfigures A–D are the simulated shear wave at 4, 8, 12 and 16 ms respectively. In these subfigures, the red boxes enclose the region without PML damping. Subfigures E and F show the comparisons of the reconstructed apparent group elasticity and viscosity as functions of the rotation angle with the low frequency Taylor approximation proposed in [46]. The solid curves are calculated with Equations (21–23) with the material properties specified by Table 2. The values of and (circles) were estimated by a Voigt model fitting in the range of 50–500 Hz [15]. We can see that in both cases, the simulated results match well with the Taylor expansions expressed by Equations (21–23).
Figure 3.
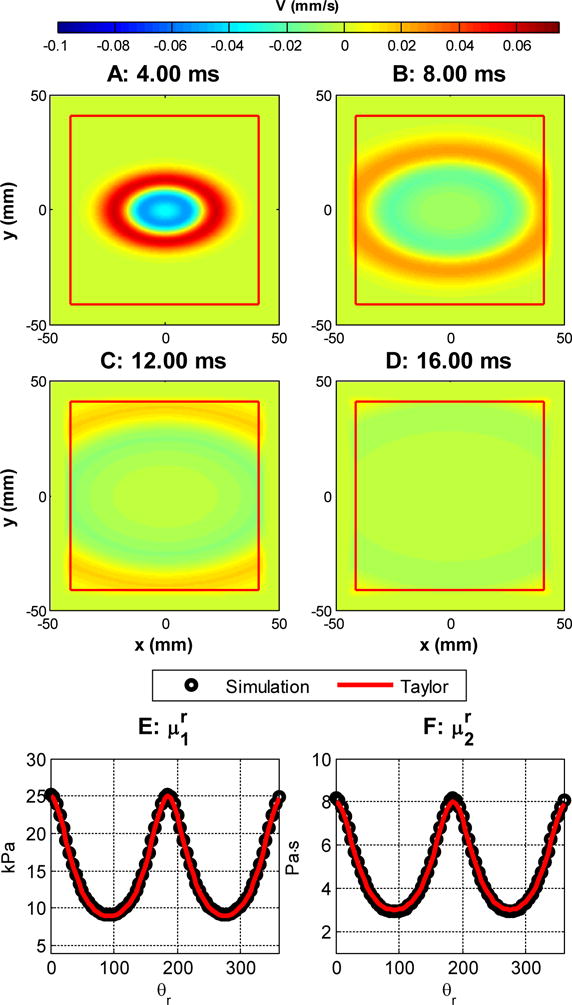
Shear wave propagation. , , , . A–D: the waveform at 4, 8, 12 and 16 ms, respectively. The area enclosed by the red square does not have PML damping. E and F: group elasticity and viscosity estimated from simulation and its comparison with Equations 22 and 23.
Figure 4.
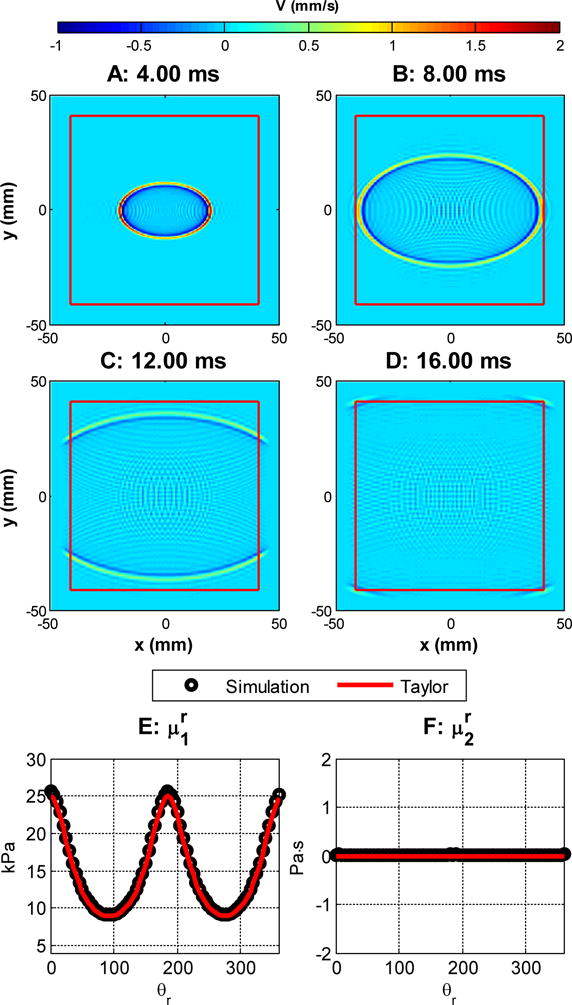
Shear wave propagation. , , , . A–D: the waveform at 4, 8, 12 and 16 ms, respectively. The area enclosed by the red square does not have PML damping. E and F: group elasticity and viscosity estimated from simulation and its comparison with Equations 22 and 23.
The total energy of the domain is be defined as [33,34],
| (25) |
where vi,j, si,j and εi,j are the particle velocity, stress and strain at a spatial point (i, j). The first term in the parentheses is the kinetic energy and the second term is the potential energy. Figure 5 shows the total energies as a function of time for both the viscoelastic and elastic simulations. We can see that the total energy decreases in both cases and the energy has been absorbed by the PML boundaries. We can also see the elastic simulation has a higher energy level than the viscoelastic simulation because the viscosity dissipates the total energy. The transitions in the elastic case around 8 ms and 13 ms show where the waves proceed out of the domain at 5 m/s and 3 m/s, respectively. The sudden rise of total energy at the beginning of the simulation corresponds to the occurrence of the excitation. In the elastic simulation, there is a slight overshoot and then a relatively constant energy value until the wave encounters the PML. In [11], the authors compared the analytical solution and numerical solution in viscoelastic media. The comparison showed a great agreement and no significant numerical dispersion/loss were found in the numerical solution. The numerical solution was obtained by using memory variables to include viscosity, which is the same approach as in this paper.
Figure 5.
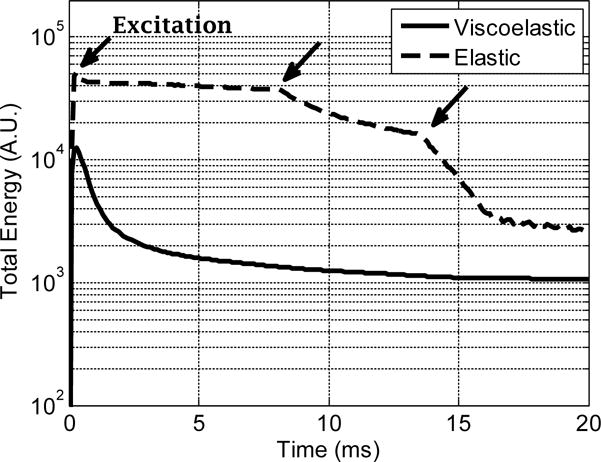
Total energy as a function of elapsed time. For the elastic wave simulation, the transition points near 8 ms and 13 ms (denoted by arrows) are caused by the PML for the wave in x and y directions, respectively. The rise at the beginning of the simulation is the occurrence of the excitation.
From Figure 4, we can see that there are some ringing effects in the elastic case. This is due to numerical dispersions, and it is more obvious when the excitation waveform is close to an impulse, which causes the excitation function to approach a discontinuity (i.e., large temporal or spatial gradients) and the pseudo-spectral method, as almost any numerical analysis method, can have difficulties approximating large gradients or discontinuity due to Runge’s phenomenon [51]. By comparison, FEM simulations can have a similar but much more severe ringing effect compared to the pseudo-spectral method [8]. This is because typical first- or second-order elements used in FEM simulations have a poor accuracy in estimating spatial derivatives [48]. Such an example is given in Figure 6A, where the FEM simulation was conducted in Abaqus (version 6.12-1, Dassault Systems, Waltham, MA). We used a cylindrical model as in [46]. The average mesh densities of the FEM and the pseudo-spectral model in the plane of symmetry are 2.17 and 1.64 nodes/mm2, respectively. We can see that even at a lower mesh density, the pseudo-spectral method produces less ringing artifacts. For both numerical methods, an increase in the mesh density can decrease this ringing effect and the convergence speed for the pseudo-spectral method is typically much faster than that of a FEM solver [53]. Figure 6B shows that the pseudo-spectral method converges at a much faster speed than the FEM. The pseudo-spectral method reaches <1% of change at 1.64 nodes/mm2, while the FEM still produces 5.5% of change after refining the mesh from 2.17 nodes/mm2 to 8.50 nodes/mm2. In addition, filtering techniques have been proposed for pseudo-spectral methods to approximate discontinuous or nearly discontinuous behaviors better [8]. Even though the comparisons shown here may not be fair due to different element formulations and the type of FE solvers, the fact that high order polynomial based methods are generally more accurate than FE based methods has been studied previously and has been well documented [53,51].
Figure 6.
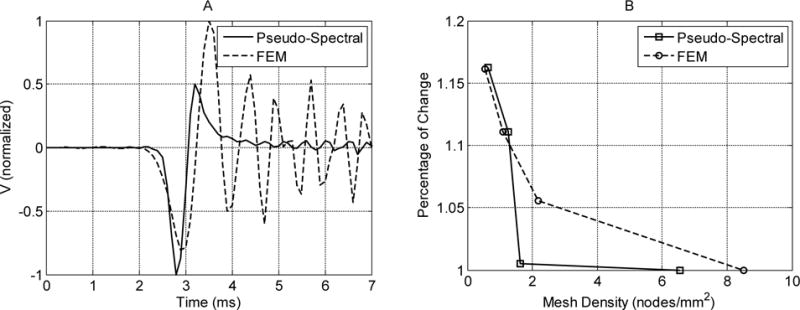
A: Normalized particle velocities at y = 8.5 mm simulated by the implemented pseudo-spectral method and a FEM method. The material is a transversely isotropic, elastic medium with and . The mesh density in the plane of symmetry for the FEM method is 30% higher than that of the pseudo-spectral method. B: Percentage of change of the maximum particle velocity at y = 8.5 mm relative to the finest mesh density.
Mapping the original Gauss–Lobatto space with a function such as Equation (14) can change the time steps from O(N−2) to O(N−1), where N is the number of grid points in the domain [29]. Figure 7 shows the number of time steps required to reach the same simulated time for two simulations: ax = ay = 0.8, px = py = 2.0 and ax = ay = 0.0, px = py = 0.0. According to Equation (14), the second set of parameters keeps the original Chebyshev mesh unmapped. The impulse excitation happens around the 7th step. We can see that before the excitation takes place, both methods march in time in approximately the same pace. After the excitation, the mapped Chebyshev method marches around 3 times faster than the unmapped method, requiring fewer computational steps for the same simulated time span. Both curves in Figure 7 are not straight lines because a variable time stepping (ODE113 in MATLAB) is used.
Figure 7.
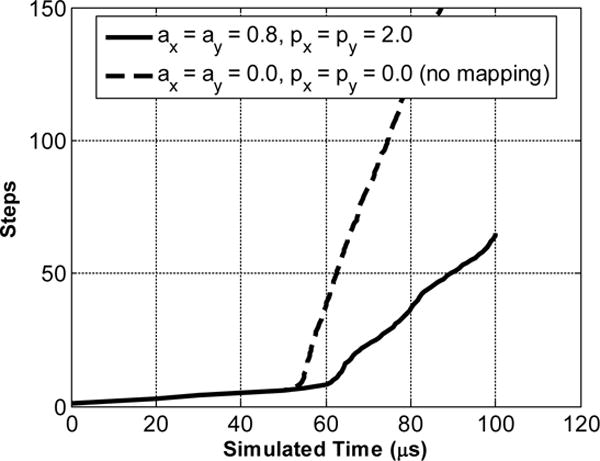
Comparison of the number of time steps to reach the same simulated time between mapped (solid line) and unmapped (dashed line) Chebyshev methods. The material properties are: , , , .
6 Discussion
Compared to the 3D FEM simulations we conducted in our earlier work [46], our 2D simulations typically require less than 10% of the memory and 20% of the computational time for a similar problem size defined by the number of nodes per unit area in the plane of symmetry. This is not surprising because the problem has been reduced to two dimensions; therefore the total degrees of freedom are decreased significantly. Indeed, FEM packages such as Abaqus can simulate 2D problems. But to our best knowledge, there is no easy way to only simulate the shear wave propagation in the plane of symmetry in a transversely isotropic, viscoelastic medium within Abaqus. In the 3D FEM models in [46], we applied fixed boundary conditions around the boundaries and in this work we used PML in the boundaries. MATLAB is our choice of programming language for this work and using a more efficient compiled language like FORTRAN is likely to boost the performance even further. We have tried to compile the MATLAB codes into a standalone executable program, but no obvious speedup has been observed.
In this paper, we used the unsplit formulation of PML, which generally has a better performance than the split formulation in terms of stability and efficiency [28]. It is also demonstrated that the unsplit PML can handle situations where the source is very close to a boundary [28]. We observe that as the viscosity decreases, the solver becomes less stable but it usually can be compensated for by imposing smaller error tolerances and longer computational times.
Wave propagation simulations in isotropic materials can be achieved by setting and . Indeed, in this case, it will be more efficient to reduce the 2D problem to a 1D problem. However, with this 2D simulator, the problem can still be solved by setting the material to be isotropic.
Figure 8 shows effects of q, which is used to approximate Voigt behaviors with a one-branch Generalized Maxwell model. We can see that as the value of q increases, computation time increases greatly and the percentage error decreases. When q = 100, the maximum percentages of error are 1.2% and 2.2% for and , respectively. Further increases of the value of q to 1000 will not change the error significantly, but will make the simulation substantially more computationally expensive. In this work, we set the value of q =100, for all our simulations.
Figure 8.
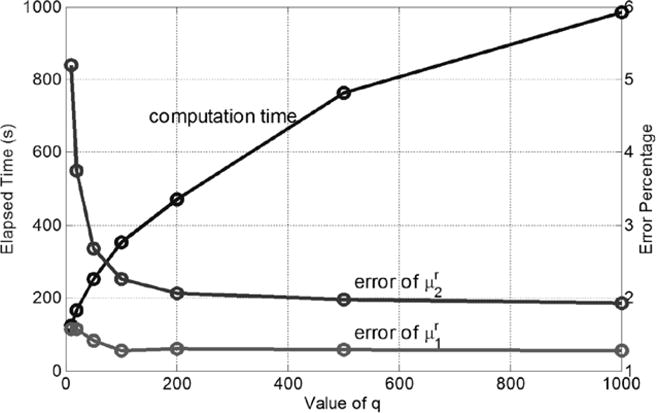
The impacts of value of q on the computation time and errors. The max percentage of error was calculated by , as shown in the subfigures E and F of Figure 3. Material properties , , , .
As mentioned in Section III, greater damping can decrease the level of reflection but can also introduce instability. With automatic time stepping, more instability means smaller time steps and longer computational time. Table 3 shows the effects of PML parameters on the computation time and reflection coefficient. The larger values of αmax and smaller values of β increase computation time and decrease reflection. In this paper, we set αmax = 10,000, β = 2.0 and according to our experience, the reflected wave energy has not significantly influenced the wave speed estimations.
Table 3.
Effects of PML Parameters
| αmax | β | Computation Time (s) | Rc (%) |
|---|---|---|---|
| 10,000 | 2 | 168 | 0.3 |
| 50,000 | 2 | 250 | 3.5E-11 |
| 10,000 | 4 | 161 | 3.2 |
| 50,000 | 4 | 235 | 3.4e-6 |
A work reserved for future investigation is to extend this 2D problem to 3D. With a 3D solver, we can simulate the shear wave propagation excited by realistic acoustic radiation force pushes. Just as a 3D FEM simulation, a 3D pseudo-spectral simulation will demand much more memory space and computational time. However, with a 3D solver, we do not have to assume zero strain in the z – direction, therefore the results will be more practical and models will be more flexible. A 3D pseudo-spectral solver can be more efficient and accurate than its FEM counterpart because of its exponential convergence property [51].
One limitation of this 2D simulation is that the simulations have to be carried out in a cross-section of the constant depth or C-scan plane. This proposed simulation approach could be useful for optimizing ultrasound-based methods that also rely on this same restriction including methods that rotate the transducer [3,16]. A true 3D experimental method with either a 2D ultrasound array transducer or MR-based detection would not be restricted to this situation. In the case of this single plane, the acoustic radiation force has to be idealized as a straight line and assumed to be evenly distributed in the axial direction. These approximations might be more applicable for the unfocused ultrasound push because the acoustic radiation force is distributed along the center line more evenly [57]. For a focused push, this 2D simulation should be more applicable to the plane at focus depth than other planes because the excitation is confined in a small area in the focal depth. Also, this 2D simulation assumes the tissue fibers align along the x direction, so that the C-scan plane is the same as the plane of symmetry in transversely isotropic materials.
7 Conclusions
Anisotropy and viscoelasticity are both inherent important mechanical properties in many tissues. An appropriate model for shear wave propagation in transversely isotropic viscoelastic tissues can help the reconstruction of material properties for elastography methods.
In this paper, we used a mapped Chebyshev pseudo-spectral method to simulate the shear wave propagation in the plane of symmetry of a transversely isotropic, viscoelastic material. The domain is surrounded by perfectly matched layer (PML) boundaries so that reflections are minimized. The apparent shear elasticity and viscosity are estimated and compared with a Taylor approximation proposed in our earlier work. The results show that the simulated results match well with the Taylor expansion. Even implemented in a scripting computer language (MATLAB), the pseudo-spectral method achieves a more accurate solution with a less memory requirement and faster computation speed compared to the finite element modeling (FEM) model we used in our earlier work. This paper demonstrated an efficient numerical simulation platform that provides a faster forward modeling approach that could be used to accelerating the understanding and interpretation of elastography measurements in many different organs that exhibit anisotropic material properties.
Acknowledgments
This work was supported by grant R01DK092255 from the National Institute of Diabetes and digestive and Kidney Diseases (NIDDK) and National Institutes of Health (NIH). The content is solely the responsibility of the authors and does not necessarily represent the official views of the NIDDK and NIH.
References
- 1.Alexandrescu A, Bueno-Orovio A, Salgueiro JR, Perez-Garcia VM. Mapped Chebyshev pseudospectral method for the study of multiple scale phenomena. Comput Phys Commun. 2009;180:912–919. doi: 10.1016/j.cpc.2008.12.018. [DOI] [Google Scholar]
- 2.Amador C, Urban MW, Chen S, Greenleaf JF. Shearwave dispersion ultrasound vibrometry (SDUV) on swine kidney. IEEE Trans Ultrason Ferroelectr Freq Control. 2011;58:2608–2619. doi: 10.1109/TUFFC.2011.2124. [DOI] [PMC free article] [PubMed] [Google Scholar]
- 3.Aristizabal S, Amador C, Qiang B, Kinnick RR, Nenadic IZ, Greenleaf JF, Urban MW. Shear wave vibrometry evaluation in transverse isotropic tissue mimicking phantoms and skeletal muscle. Phys Med Biol. 2014;59:7735–7752. doi: 10.1088/0031-9155/59/24/7735. [DOI] [PMC free article] [PubMed] [Google Scholar]
- 4.Bammer R, Acar B, Moseley ME. In vivo MR tractography using diffusion imaging. Eur J Radiol. 2003;45:223–234. doi: 10.1016/s0720-048x(02)00311-x. [DOI] [PubMed] [Google Scholar]
- 5.Basser PJ, Mattiello J, LeBihan D. MR diffusion tensor spectroscopy and imaging. Biophys J. 1994;66:259–267. doi: 10.1016/S0006-3495(94)80775-1. http://dx.doi.org/10.1016/S0006-3495(94)80775-1. [DOI] [PMC free article] [PubMed] [Google Scholar]
- 6.Basser PJ, Pierpaoli C. Microstructural and physiological features of tissues elucidated by quantitative-diffusion-tensor MRI. Journal of Magnetic Resonance, Series B. 1996;111:209–219. doi: 10.1006/jmrb.1996.0086. http://dx.doi.org/10.1006/jmrb.1996.0086. [DOI] [PubMed] [Google Scholar]
- 7.Bercoff J, Tanter M, Fink M. Supersonic shear imaging: a new technique for soft tissue elasticity mapping. IEEE Trans Ultrason Ferroelectr Freq Control. 2004;51:396–409. doi: 10.1109/tuffc.2004.1295425. [DOI] [PubMed] [Google Scholar]
- 8.Boyd JP. Chebyshev and Fourier spectral methods. 2nd. Dover Publications; Mineola, N.Y: 2001. [Google Scholar]
- 9.Brum J, Bernal M, Gennisson JL, Tanter M. In vivo evaluation of the elastic anisotropy of the human Achilles tendon using shear wave dispersion analysis. Phys Med Biol. 2014;59:505–523. doi: 10.1088/0031-9155/59/3/505. [DOI] [PubMed] [Google Scholar]
- 10.Budzik JF, Balbi V, Verclytte S, Pansini V, Le Thuc V, Cotten A. Diffusion tensor imaging in musculoskeletal disorders. Radiographics : a review publication of the Radiological Society of North America, Inc. 2014;34:E56–72. doi: 10.1148/rg.343125062. [DOI] [PubMed] [Google Scholar]
- 11.Carcione JM. Seismic Modeling in Viscoelastic Media. Geophysics. 1993;58:110–120. doi: 10.1190/1.1443340. [DOI] [Google Scholar]
- 12.Carcione JM. Handbook of geophysical exploration Seismic exploration. 2nd. Vol. 38. Elsevier; Amsterdam; Boston: 2007. Wave fields in real media : wave propagation in anisotropic, anelastic, porous and electromagnetic media. [Google Scholar]
- 13.Carcione JM, Kosloff D, Kosloff R. Wave propagation simulation in a linear viscoelastic medium. Geophysical journal. 1988;95:597–611. [Google Scholar]
- 14.Carcione JM, Poletto F, Gei D. 3-D wave simulation in anelastic media using the Kelvin-Voigt constitutive equation. J Comput Phys. 2004;196:282–297. doi: 10.1016/j.jcp.2003.10.024. [DOI] [Google Scholar]
- 15.Catheline S, Gennisson JL, Delon G, Fink M, Sinkus R, Abouelkaram S, Culioli J. Measurement of viscoelastic properties of homogeneous soft solid using transient elastography: An inverse problem approach. Journal of the Acoustical Society of America. 2004;116:3734–3741. doi: 10.1121/1.1815075. [DOI] [PubMed] [Google Scholar]
- 16.Chatelin S, Bernal M, Deffieux T, Papadacci C, Flaud P, Nahas A, Boccara C, Gennisson JL, Tanter M, Pernot M. Anisotropic polyvinyl alcohol hydrogel phantom for shear wave elastography in fibrous biological soft tissue: a multimodality characterization. Phys Med Biol. 2014;59:6923–6940. doi: 10.1088/0031-9155/59/22/6923. [DOI] [PubMed] [Google Scholar]
- 17.Chui C, Kobayashi E, Chen X, Hisada T, Sakuma I. Transversely isotropic properties of porcine liver tissue: experiments and constitutive modelling. Med Biol Eng Comput. 2007;45:99–106. doi: 10.1007/s11517-006-0137-y. [DOI] [PubMed] [Google Scholar]
- 18.Corovic S, Zupanic A, Kranjc S, Al Sakere B, Leroy-Willig A, Mir LM, Miklavcic D. The influence of skeletal muscle anisotropy on electroporation: in vivo study and numerical modeling. Med Biol Eng Comput. 2010;48:637–648. doi: 10.1007/s11517-010-0614-1. [DOI] [PMC free article] [PubMed] [Google Scholar]
- 19.Eby SF, Song P, Chen S, Chen Q, Greenleaf JF, An KN. Validation of shear wave elastography in skeletal muscle. J Biomech. 2013;46:2381–2387. doi: 10.1016/j.jbiomech.2013.07.033. [DOI] [PMC free article] [PubMed] [Google Scholar]
- 20.Galban CJ, Maderwald S, Stock F, Ladd ME. Age-related changes in skeletal muscle as detected by diffusion tensor magnetic resonance Imaging. J Gerontol Ser A-Biol Sci Med Sci. 2007;62:453–458. doi: 10.1093/gerona/62.4.453. [DOI] [PubMed] [Google Scholar]
- 21.Garmirian LP, Chin AB, Rutkove SB. Discriminating neurogenic from myopathic disease via measurement of muscle anisotropy. Muscle Nerve. 2009;39:16–24. doi: 10.1002/mus.21115. [DOI] [PMC free article] [PubMed] [Google Scholar]
- 22.Gates F, McCammond D, Zingg W, Kunov H. In vivo stiffness properties of the canine diaphragm muscle. Med Biol Eng Comput. 1980;18:625–632. doi: 10.1007/BF02443135. [DOI] [PubMed] [Google Scholar]
- 23.Gennisson JL, Catheline S, Chaffai S, Fink M. Transient elastography in anisotropic medium: application to the measurement of slow and fast shear wave speeds in muscles. J Acoust Soc Am. 2003;114:536–541. doi: 10.1121/1.1579008. [DOI] [PubMed] [Google Scholar]
- 24.Gennisson JL, Deffieux T, Mace E, Montaldo G, Fink M, Tanter M. Viscoelastic and anisotropic mechanical properties of in vivo muscle tissue assessed by supersonic shear imaging. Ultrasound Med Biol. 2010;36:789–801. doi: 10.1016/j.ultrasmedbio.2010.02.013. [DOI] [PubMed] [Google Scholar]
- 25.Gennisson JL, Grenier N, Combe C, Tanter M. Supersonic shear wave elastography of in vivo pig kidney: influence of blood pressure, urinary pressure and tissue anisotropy. Ultrasound Med Biol. 2012;38:1559–1567. doi: 10.1016/j.ultrasmedbio.2012.04.013. [DOI] [PubMed] [Google Scholar]
- 26.Guillard H, Male JM, Peyret R. Adaptive Spectral Methods with Application to Mixing Layer Computations. J Comput Phys. 1992;102:114–127. doi: 10.1016/S0021-9991(05)80010-5. [DOI] [Google Scholar]
- 27.Khalil C, Budzik JF, Kermarrec E, Balbi V, Le Thuc V, Cotten A. Tractography of peripheral nerves and skeletal muscles. Eur J Radiol. 2010;76:391–397. doi: 10.1016/j.ejrad.2010.03.012. [DOI] [PubMed] [Google Scholar]
- 28.Komatitsch D, Martin R. An unsplit convolutional perfectly matched layer improved at grazing incidence for the seismic wave equation. Geophysics. 2007;72:Sm155–Sm167. doi: 10.1190/1.2757586. [DOI] [Google Scholar]
- 29.Kosloff D, Talezer H. A Modified Chebyshev Pseudospectral Method with an O(N-1) Time Step Restriction. J Comput Phys. 1993;104:457–469. doi: 10.1006/jcph.1993.1044. [DOI] [Google Scholar]
- 30.Le Bihan D, Mangin JF, Poupon C, Clark CA, Pappata S, Molko N, Chabriat H. Diffusion tensor imaging: concepts and applications. J Magn Reson Imaging. 2001;13:534–546. doi: 10.1002/jmri.1076. [DOI] [PubMed] [Google Scholar]
- 31.Lee W-N, Pernot M, Couade M, Messas E, Bruneval P, Bel A, Hagege AA, Fink M, Tanter M. Mapping myocardial fiber orientation using echocardiography-based shear wave imaging. IEEE transactions on medical imaging. 2012;31:554–562. doi: 10.1109/TMI.2011.2172690. [DOI] [PubMed] [Google Scholar]
- 32.Lee WN, Larrat B, Pernot M, Tanter M. Ultrasound elastic tensor imaging: comparison with MR diffusion tensor imaging in the myocardium. Phys Med Biol. 2012;57:5075–5095. doi: 10.1088/0031-9155/57/16/5075. [DOI] [PubMed] [Google Scholar]
- 33.Li Y, Bou Matar O. Convolutional perfectly matched layer for elastic second-order wave equation. J Acoust Soc Am. 2010;127:1318–1327. doi: 10.1121/1.3290999. [DOI] [PubMed] [Google Scholar]
- 34.Martin R, Komatitsch D. An unsplit convolutional perfectly matched layer technique improved at grazing incidence for the viscoelastic wave equation. Geophys J Int. 2009;179:333–344. doi: 10.1111/j.1365-246X.2009.04278.x. [DOI] [Google Scholar]
- 35.Martin R, Komatitsch D, Gedney SD, Bruthiaux E. A High-Order Time and Space Formulation of the Unsplit Perfectly Matched Layer for the Seismic Wave Equation Using Auxiliary Differential Equations (ADE-PML) Cmes-Comp Model Eng. 2010;56:17–41. [Google Scholar]
- 36.Masutani Y, Aoki S, Abe O, Hayashi N, Otomo K. MR diffusion tensor imaging: recent advance and new techniques for diffusion tensor visualization. Eur J Radiol. 2003;46:53–66. doi: 10.1016/s0720-048x(02)00328-5. [DOI] [PubMed] [Google Scholar]
- 37.MATLAB manual. Mathworks Inc.; 2013. [Google Scholar]
- 38.McGarry MDJ, Van Houten EEW. Use of a Rayleigh damping model in elastography. Med Biol Eng Comput. 2008;46:759–766. doi: 10.1007/s11517-008-0356-5. [DOI] [PubMed] [Google Scholar]
- 39.Moseley ME, Cohen Y, Kucharczyk J, Mintorovitch J, Asgari HS, Wendland MF, Tsuruda J, Norman D. Diffusion-weighted MR imaging of anisotropic water diffusion in cat central nervous system. Radiology. 1990;176:439–445. doi: 10.1148/radiology.176.2.2367658. [DOI] [PubMed] [Google Scholar]
- 40.Muthupillai R, Ehman RL. Magnetic resonance elastography. Nat Med. 1996;2:601–603. doi: 10.1038/nm0596-601. [DOI] [PubMed] [Google Scholar]
- 41.Ng KT, Yan R. Three-dimensional pseudospectral modelling of cardiac propagation in an inhomogeneous anisotropic tissue. Med Biol Eng Comput. 2003;41:618–624. doi: 10.1007/BF02349968. [DOI] [PubMed] [Google Scholar]
- 42.Palmeri ML, Sharma AC, Bouchard RR, Nightingale RW, Nightingale KR. A finite-element method model of soft tissue response to impulsive acoustic radiation force. IEEE Trans Ultrason Ferroelectr Freq Control. 2005;52:1699–1712. doi: 10.1109/tuffc.2005.1561624. [DOI] [PMC free article] [PubMed] [Google Scholar]
- 43.Palmeri ML, Wang MH, Dahl JJ, Frinkley KD, Nightingale KR. Quantifying hepatic shear modulus in vivo using acoustic radiation force. Ultrasound Med Biol. 2008;34:546–558. doi: 10.1016/j.ultrasmedbio.2007.10.009. [DOI] [PMC free article] [PubMed] [Google Scholar]
- 44.Pierpaoli C, Basser PJ. Toward a quantitative assessment of diffusion anisotropy. Magn Reson Med. 1996;36:893–906. doi: 10.1002/mrm.1910360612. [DOI] [PubMed] [Google Scholar]
- 45.Qi J, Olsen NJ, Price RR, Winston JA, Park JH. Diffusion-weighted imaging of inflammatory myopathies: Polymyositis and dermatomyositis. Journal of Magnetic Resonance Imaging. 2008;27:212–217. doi: 10.1002/jmri.21209. [DOI] [PubMed] [Google Scholar]
- 46.Qiang B, Brigham JC, Aristizabal S, Greenleaf JF, Zhang X, Urban MW. Modeling transversely isotropic, viscoelastic, incompressible tissue-like materials with application in ultrasound shear wave elastography. Phys Med Biol. 2015;60:1289–1306. doi: 10.1088/0031-9155/60/3/1289. [DOI] [PMC free article] [PubMed] [Google Scholar]
- 47.Rudenko OV, Sarvazyan AP. Wave anisotropy of shear viscosity and elasticity. Acoust Phys. 2014;60:710–718. doi: 10.1134/s1063771014060141. [DOI] [Google Scholar]
- 48.Sansalone M, Carino NJ, Hsu NN. A Finite-Element Study of Transient Wave-Propagation in Plates. J Res Nat Bur Stand. 1987;92:267–278. doi: 10.6028/Jres.092.025. [DOI] [Google Scholar]
- 49.Saotome T, Sekino M, Eto F, Ueno S. Evaluation of diffusional anisotropy and microscopic structure in skeletal muscles using magnetic resonance. Magn Reson Imaging. 2006;24:19–25. doi: 10.1016/j.mri.2005.09.009. http://dx.doi.org/10.1016/j.mri.2005.09.009. [DOI] [PubMed] [Google Scholar]
- 50.Sarvazyan AP, Rudenko OV, Swanson SD, Fowlkes JB, Emelianov SY. Shear wave elasticity imaging: a new ultrasonic technology of medical diagnostics. Ultrasound Med Biol. 1998;24:1419–1435. doi: 10.1016/s0301-5629(98)00110-0. doi: S0301-5629(98)00110-0[pii] [DOI] [PubMed] [Google Scholar]
- 51.Trefethen LN. Spectral methods in MATLAB Software, environments, tools. Society for Industrial and Applied Mathematics; Philadelphia, PA: 2000. [Google Scholar]
- 52.Urban MW, Chen S, Fatemi M. A Review of Shearwave Dispersion Ultrasound Vibrometry (SDUV) and its Applications. Curr Med Imaging Rev. 2012;8:27–36. doi: 10.2174/157340512799220625. [DOI] [PMC free article] [PubMed] [Google Scholar]
- 53.Virieux J, Calandra H, Plessix RE. A review of the spectral, pseudo-spectral, finite-difference and finite-element modelling techniques for geophysical imaging. Geophys Prospect. 2011;59:794–813. doi: 10.1111/j.1365-2478.2011.00967.x. [DOI] [Google Scholar]
- 54.Wang M, Byram B, Palmeri M, Rouze N, Nightingale K. Imaging transverse isotropic properties of muscle by monitoring acoustic radiation force induced shear waves using a 2-D matrix ultrasound array. IEEE transactions on medical imaging. 2013;32:1671–1684. doi: 10.1109/TMI.2013.2262948. [DOI] [PMC free article] [PubMed] [Google Scholar]
- 55.Zhan Z, Ng KT. Two-dimensional Chebyshev pseudospectral modelling of cardiac propagation. Med Biol Eng Comput. 2000;38:311–318. doi: 10.1007/BF02347052. [DOI] [PubMed] [Google Scholar]
- 56.Zhang J, Zhang G, Morrison B, Mori S, Sheikh KA. Magnetic resonance imaging of mouse skeletal muscle to measure denervation atrophy. Experimental Neurology. 2008;212:448–457. doi: 10.1016/j.expneurol.2008.04.033. http://dx.doi.org/10.1016/j.expneurol.2008.04.033. [DOI] [PMC free article] [PubMed] [Google Scholar]
- 57.Zhao H, Song P, Urban MW, Greenleaf JF, Chen S. Shear wave speed measurement using an unfocused ultrasound beam. Ultrasound Med Biol. 2012;38:1646–1655. doi: 10.1016/j.ultrasmedbio.2012.05.015. [DOI] [PMC free article] [PubMed] [Google Scholar]


