Abstract
Purpose
The high cost of oncology drugs threatens the affordability of cancer care. Previous research identified drivers of price growth of targeted oral anticancer medications (TOAMs) in private insurance plans and projected the impact of closing the coverage gap in Medicare Part D in 2020. This study examined trends in TOAM prices and patient out-of-pocket (OOP) payments in Medicare Part D and estimated the actual effects on patient OOP payments of partial filling of the coverage gap by 2012.
Methods
Using SEER linked to Medicare Part D, 2007 to 2012, we identified patients who take TOAMs via National Drug Codes in Part D claims. We calculated total drug costs (prices) and OOP payments per patient per month and compared their rates of inflation with general health care prices.
Results
The study cohort included 42,111 patients who received TOAMs between 2007 and 2012. Although the general prescription drug consumer price index grew at 3% per year over 2007 to 2012, mean TOAM prices increased by nearly 12% per year, reaching $7,719 per patient per month in 2012. Prices increased over time for newly and previously launched TOAMs. Mean patient OOP payments dropped by 4% per year over the study period, with a 40% drop among patients with a high financial burden in 2011, when the coverage gap began to close.
Conclusion
Rising TOAM prices threaten the financial relief patients have begun to experience under closure of the coverage gap in Medicare Part D. Policymakers should explore methods of harnessing the surge of novel TOAMs to increase price competition for Medicare beneficiaries.
INTRODUCTION
Targeted oral anticancer medications (TOAMs) have been the focus of drug development for the past two decades.1-3 These novel drugs not only substantially improve the survival of patients with several cancers, such as chronic myelogenous leukemia and renal cell cancer, but have also revolutionized cancer care delivery, moving it from an office-based setting to a home-based environment.4 Despite their clinical benefit and ease of administration, the high prices of TOAMs have raised major concerns over their affordability.5,6 A recent study of nonelderly patients with cancer with private insurance showed that of the two classes of targeted anticancer medications, TOAMs and targeted intravenous medications, the trends of rising prices at launch and sustained price increases postlaunch were more pronounced among TOAMs.7 Other studies of commercially insured patients with cancer have shown similar trends.8,9
Patient financial burden has been increasingly recognized as a major toxicity of cancer treatment,10,11 manifesting in several dimensions.12 Material conditions include lost productivity, out-of-pocket (OOP) costs, bankruptcy, and medical debt.13,14 Psychological responses include financial distress;15,16 coping behaviors include poor adherence.17,18 Some evidence has even linked financial burden to adverse health outcomes.19 Analyses of commercial claims data have noted substantially lower OOP payments for privately insured patients with cancer receiving TOAMs under the pharmacy benefit, compared with those receiving targeted intravenous medications under the medical benefit, because of differences in insurance benefit design.7 The low OOP costs of TOAMs observed among privately insured patients with cancer are largely attributable to patient cost sharing taking the form of coinsurance with an OOP max or copayments in the majority of pharmacy benefits for these patients.20
The situation is much different for the 70% of Medicare beneficiaries who are enrolled in Medicare Part D,21 the Medicare prescription drug benefit program, and whose use of TOAMs is covered under this program. Understanding the financial burden for Part D enrollees is important because they are more likely than other Medicare beneficiaries to be members of vulnerable groups: older, in fair or poor health, racial and ethnic minorities, or with low income and educational status.22 The standard Part D plan encompasses four phases, and beneficiaries spend their way sequentially through these phases: (1) deductible ($320 in 2015), with 100% cost-sharing; (2) initial coverage (up to $2,960 in total prescription drug costs), with 25% to 33% coinsurance for specialty drugs23; (3) the coverage gap, or donut hole (up to $6,680 in total costs), with 100% coinsurance; and(4) catastrophic coverage, with 5% cost-sharing and no OOP maximum. Under this less-generous coverage structure, the high prices of TOAMs can impose considerable financial burdens on Medicare Part D enrollees, especially given their sociodemographics. Sustained price increases postlaunch exacerbate this concern. Under the Affordable Care Act, the coverage gap is scheduled to gradually be closed, reducing the coinsurance in this benefit phase from 100% to 50% in 2011 and further down to 25% in 2020.
Using data from Medicare prescription drug plans on benefit designs and the average prices plans pay for oral anticancer drugs, Dusetzina and Keating24 simulated the potential effects of closing the coverage gap for patients with cancer. Using assumptions on plausible patterns of drug use, and allowing for a conservative range of possible trajectories of drug price increases, the authors found that filling the coverage gap would result in OOP savings by 2020. To better understand the impact of increasing drug prices on the Medicare Part D and to explore whether the coverage gap closure could ease patients’ financial burden, we examined recent cost trends of TOAMs and TOAM-related OOP payments for older patients with cancer with Medicare prescription drug coverage. We built on prior research by using patient-level data on drug costs, OOP expenses, and utilization patterns for the distribution of Part D enrollees taking TOAMs, and we estimated how these changed after the coverage gap began to be filled. Findings from our study offer important policy insights for policymakers contemplating reforms to Medicare prescription drug coverage.
METHODS
Data Source and Study Population
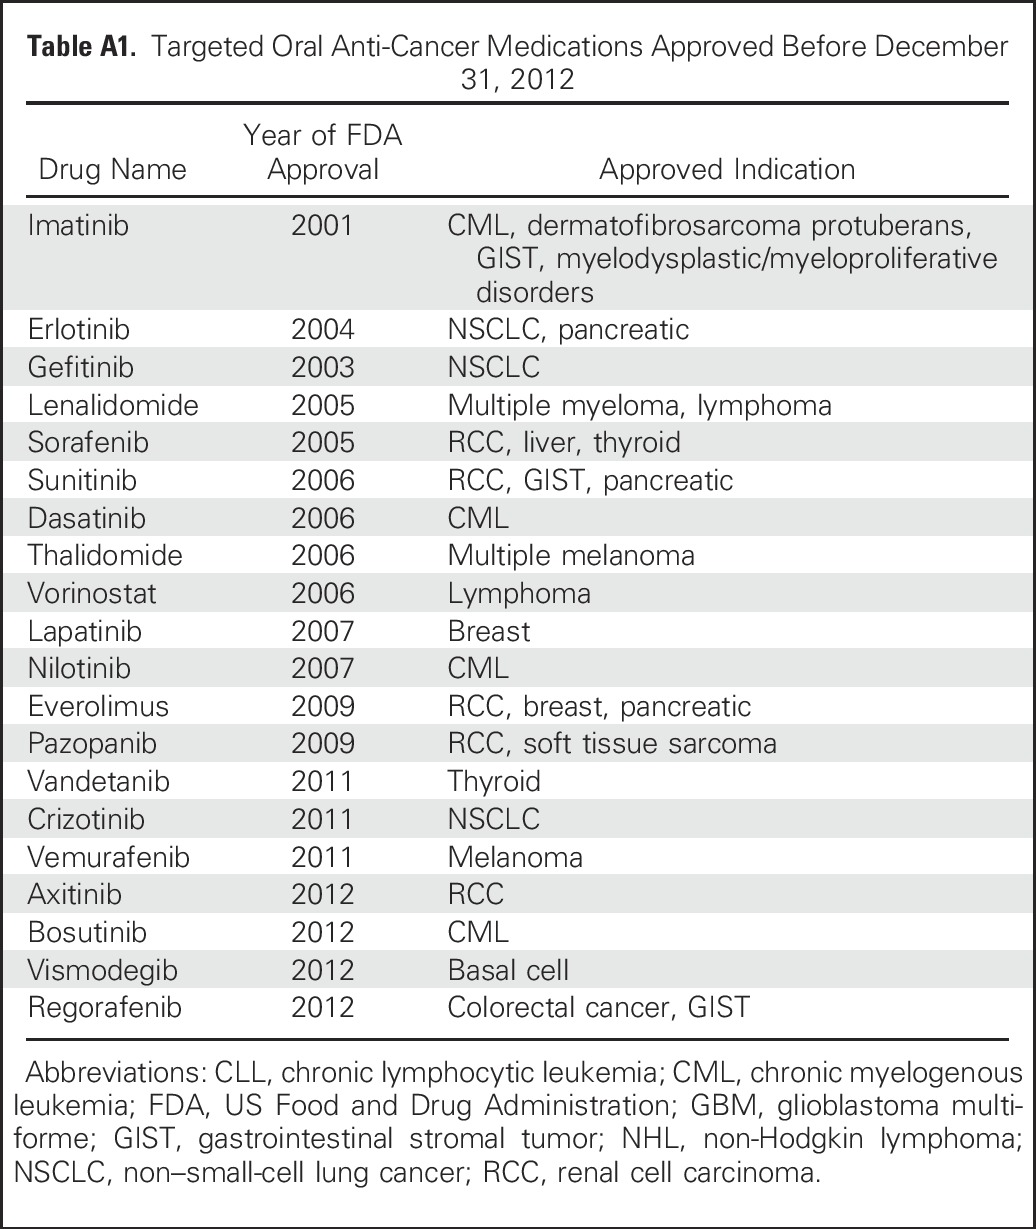
We analyzed SEER-Medicare data to examine trends in the financial burden of TOAMs on the Medicare Part D program and on beneficiaries enrolled in Part D. We determined the list of TOAMs from the National Cancer Institute’s Targeted Cancer Therapy Fact Sheet25 (Appendix Table A1, online only) and identified patients who take TOAMs via brand names, generic names, and National Drug Codes from the Part D claims files. We limited the study period to 2007 to 2012, because Part D data in SEER-Medicare were only available after 2007. We then linked patients who take TOAMs to the Patient Entitlement and Diagnosis Summary File via unique patient identifiers to extract information on patient demographics and tumor types. Last, we excluded patients younger than age 65 or who were not enrolled in Medicare Part D on the dates of use of TOAMs.
Cost Measures
Medicare Part D files included two cost variables: gross drug costs and patient pay amount. Gross drug costs represent total drug costs, including the portions of drug costs that are the responsibility of the Medicare program, prescription drug plans, beneficiaries, and other parties. Patient pay amount is the amount paid by beneficiaries that is not reimbursed by a third party; therefore, it captures the OOP payments for Medicare beneficiaries who are enrolled in the Part D program. Given that many TOAMs were prescribed monthly, we quantified the costs of TOAMs as per patient per month (PPPM) costs for each calendar year, which were calculated by aggregating all TOAM claims for gross drug costs and OOP payments, then dividing the aggregate costs by the total number of months a patient was treated with any TOAM in the calendar year. When reporting OOP payments, we limited our analysis to beneficiaries without low-income subsidies, for whom payments are substantially lower.
Growth in Drug Prices
We stratified gross drug costs PPPM for TOAMs by year of prescription, without inflation adjustment, and calculated the annual increase in drug prices from 2007 to 2012 as the ratio of costs PPPM between year (t + 1) and year t. We then compared the annual growth rate of TOAM prices with two commonly cited health care price indices obtained from the Bureau of Labor Statistics: the medical care component of the consumer price index (MC-CPI) and the prescription drug category of the medical CPI (RX-CPI).26 We used Medicare drug spending data accessible from the Centers for Medicare & Medicaid Services website to project annual growth rates from 2012 to 2015.27 The data include aggregate drug spending from 2011 to 2015 for each drug covered under Part D. We extracted TOAMs from the data, estimated cost per patient per year (PPPY) by weighting total annual spending per patient of each TOAM by its respective patient share, and calculated annual PPPY growth rates. We then projected annual growth rates of TOAM prices, quantified as cost PPPM, by applying the relative ratio of the 2011 to 2012 growth rate calculated from PPPM versus that from PPPY to the 2012 to 2015 growth trend observed in PPPY. To determine the rate of inflation (denoted as R) from 2007 to 2012, we solved the equation: Cost2007 × (1 + R)5 = Cost2012. We calculated the inflation rate for gross drug costs and OOP payments, both overall and for each TOAM agent included in our analysis. For TOAMs approved before 2007, we used years 2007 to 2012 to calculate the rate of inflation. For those approved after 2007, we calculated the inflation rate using data from all applicable years up to 2012.
RESULTS
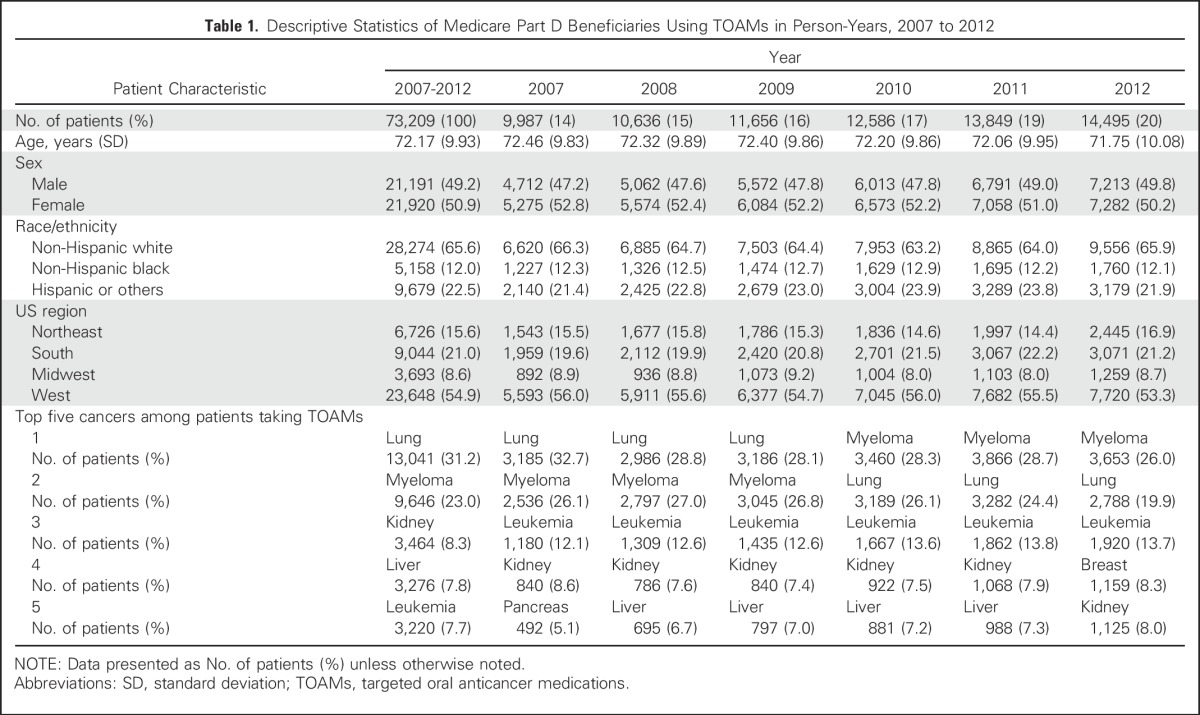
The study cohort included 42,111 patients with cancer who received TOAM between 2007 and 2012; these patients formed the 73,209 person-years used in our analysis. Table 1 shows that between 2007 and 2012, the top five cancers among patients taking TOAMs were lung (31.2%), myeloma (23.1%), kidney (8.3%), liver (7.8%), and leukemia (7.7%). The distribution by calendar year shows a higher proportion of observations in more recent years; this reflects the compound effect of the entry of new TOAMs into the market in addition to the accumulation of patients from previous years, because TOAMs have transformed several cancers into chronic illnesses. The comparison of patient characteristics by year shows that although the demographic characteristics and geographic distribution of patients taking TOAMs stayed stable, there were some variations in the top-five list, with breast cancer entering the list and liver cancer dropping off the list in 2012.
Table 1.
Descriptive Statistics of Medicare Part D Beneficiaries Using TOAMs in Person-Years, 2007 to 2012
Trends in Gross Drug Costs
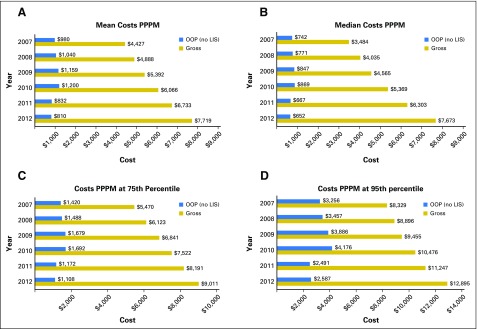
Figure 1A shows that the mean gross drug costs PPPM increased from $4,427 in 2007 to $7,719 in 2012. Similar trends were observed at the median (Fig 1B), 75th (Fig 1C), and 95th percentile (Fig 1D), with median gross drug costs more than doubling, increasing from $3,484 in 2007 to $7,673 in 2012.
Fig 1.
Annual targeted oral anticancer medication costs of Medicare Part D beneficiaries, 2007 to 2012. (A) Mean costs per patient per month (PPPM); (B) median costs PPPM; (C) costs PPPM at 75th percentile; (D) costs PPPM at 95th percentile. LIS, low-income subsidy; OOP, out-of-pocket.
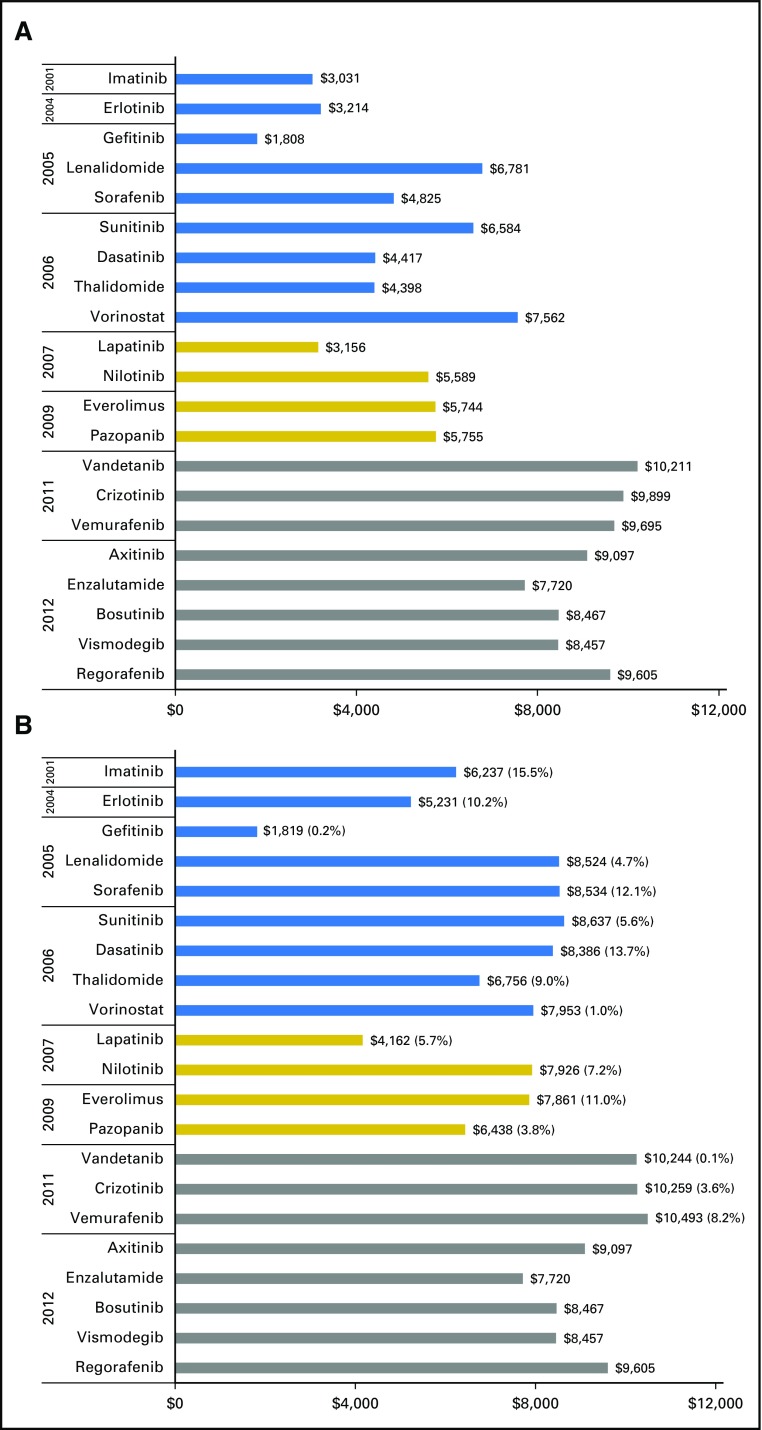
For each TOAM agent, Figure 2 compares its median gross drug cost PPPM in 2007 or the year of launch (whichever is later) with that in 2012. Because Part D data were not available before 2007, the launch price for drugs approved before 2007 was based on cost PPPM calculated using 2007 data. The top panel portrays an increasing trend in the launch cost PPPM, moving from the $3,000 to $6,000 range for most drugs approved before 2010 to $8,000 to $10,000 for those approved after 2010. However, the bottom panel of Figure 2, plotting the final cost PPPM for 2012, shows that many drugs approved before 2012 had sustained price increases and moved toward the price range ($8,000 to $10,000) of those approved in 2012. Of the 16 TOAMs approved before 2012, five exhibited double-digit annual rates of inflation during 2007 to 2012: imatinib (15.5%), dasatinib (13.7%), erlotinib (10%), sorafenib (12%), and everolimus (11%).
Fig 2.
Launch prices and 2012 prices of targeted oral anticancer medication in Medicare Part D by year of launch, 2007 to 2012. (A) Launch year or 2007 (whichever was later); (B) 2012 prices.
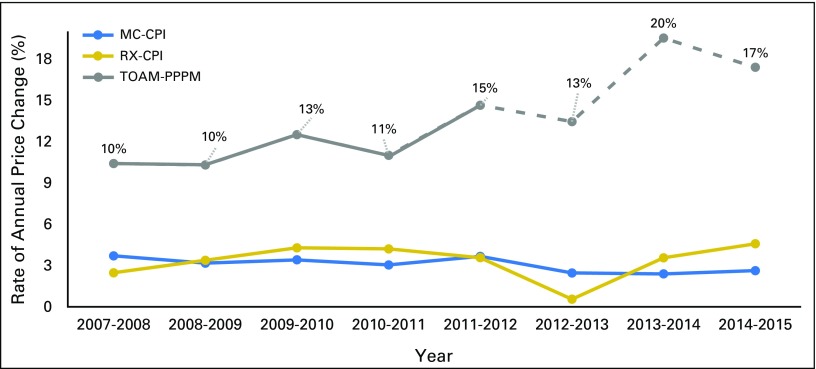
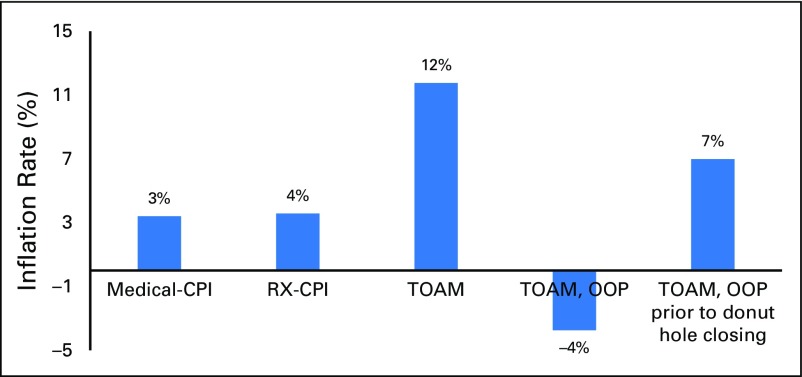
Figure 3 compares the annual changes, from 2007 to 2015, in TOAM costs PPPM with two medical-related price indices. Both MC-CPI and RX-CPI remained relatively stable between 2007 and 2015, with an annual price change generally around 3% to 4%. Gross drug costs PPPM for TOAMs exhibited sustained increases at a rate > 10% annually up to 2012. This trend was projected to continue and even accelerate in more recent years. Figure 4 shows that the inflation rate for TOAMs was close to 12% over 2007 to 2012, which was more than three times higher than the MC-CPI and RX-CPI.
Fig 3.
Rate of annual price change, 2007 to 2015. Dashed gray line represents projection on the basis of data published by Centers for Medicare & Medicaid Services. CPI, Consumer Price Index; MC, medical care; OOP, out-of-pocket; PPPM, per patient per month; RX, prescription drug; TOAM, targeted oral anticancer medication.
Fig 4.
Inflation rates for various medical goods, 2007 to 2012. CPI, Consumer Price Index; OOP, out-of-pocket; RX, prescription drug; TOAM, targeted oral anticancer medication.
Trends in OOP
Mean OOP payments for those without low-income subsidies increased steadily from $980 in 2007 to $1,200 in 2010 but dropped below $850 in 2011 when the coverage gap began to close (Fig 1A). Although similar trends were found at the median, 75th, and 95th percentiles, the magnitude of financial relief from closure of the coverage gap was most pronounced for Part D enrollees whose TOAM-related OOP payments were in the top five percentile. Those patients’ OOP PPPM dropped by > 40% from 2010 ($4,176) to 2011 ($2,491; Fig 1D). We also calculated the inflation rate for OOP PPPM. Figure 4 shows that the rate over 2007 to 2012 was negative (−3.7%) because the coverage gap began to close in 2011 but was positive (7%) between 2007 and 2010.
DISCUSSION
This study analyzed Part D claims in the 2007 to 2012 SEER-Medicare data to examine the cost trend of TOAMs for the Medicare Part D program and its enrollees. We found that gross drug costs PPPM increased from the $3,000 to $6,000 price range for TOAMs launched before 2010 to the $8,000 to $10,000 range for those launched after 2010. In addition, with sustained price increases, costs PPPM for several TOAMs launched earlier had approached or passed $8,000 by 2012. The combination of increasing prices at drug launch and sustained price increases postlaunch was associated with an inflation rate of nearly 12% over 2007 to 2012, outpacing the growth of the prescription drug CPI by more than three-fold. This rate of inflation was projected to continue and even accelerate in more recent years.
The trends in OOP PPPM reported in our analysis documented the early experience of a legislative provision to phase in closure of the coverage gap by 2020. We found a sizable (approximately 20%) reduction in OOP PPPM when measured at the median, after the coinsurance rate in the coverage gap phase was reduced from 100% to 50% in 2011. A similar magnitude of reduction was reported in a study of coverage gap closure and specialty drug use among beneficiaries in Medicare Advantage plans.28 Had OOP payments continued to increase along the trajectory observed before 2011, they would have grown by 50% by 2012, implying a substantial impact of closing the coverage gap. The largest financial relief was for beneficiaries with high OOP PPPM. Some of these high spenders could be patients who were taking TOAMs but who discontinued their medication because of cost concerns while in the coverage gap phase with 100% coinsurance, and were unable to reach the catastrophic phase with 5% coinsurance. The closure of the coverage gap is especially beneficial for such individuals by allowing them to continue their life-saving medications.
Although our findings provide support for patient financial improvements under this policy change, it is important to note that the financial burden for patients enrolled in Medicare Part D who take TOAMs remains substantially higher than for those with private insurance. The comparison of the 2011 mean OOP PPPM ($832) reported in our study and that reported in a study of privately insured patients who take TOAMs ($198)7 indicates that without the added protection of the OOP maximum, Part D enrollees are especially vulnerable to high drug prices. Previous research has shown that for Medicare beneficiaries taking TOAMs, many individuals quickly pass through the coverage gap and enter catastrophic coverage.24 With monthly costs of > $10,000 for TOAMs, even a 5% coinsurance can amount to a substantial financial burden, because most patients who take TOAMs continue taking these medications for months or years. Indeed, Dusetzina and Keating24 projected that median OOP costs would remain high (> $5,500 annually) for individuals taking any of several TOAMs, even after the coverage gap is closed in 2020.
The patterns we documented in Medicare drug price inflation are mirrored in studies using commercial insurance claims.7-9 It is possible that sustained price increases for TOAMs could outweigh the savings patients are expected to achieve through the coverage gap closure, eventually causing OOP payments to grow again. Dusetzina and Keating24 estimated that if TOAM drug prices increased by 50% from 2010 to 2020, the projected OOP savings from coverage gap closure would drop from $2,550 to $621. With the 11.8% inflation rate estimated from our study, it will take < 4 years to reach a 50% increase in drug prices, and drug prices are projected to triple from 2010 to 2020. These observations underscore how drug price escalation is as crucial as insurance coverage gaps in determining the risk of financial toxicity for elderly patients who take TOAMs. Conversely, too-generous coverage desensitizes patients and prescribing oncologists to the high drug prices, preventing pressure within the cancer care community from building against price inflation. This point has been made with regard to drug manufacturers’ copay assistance programs,29 which serve a similar function. Absent countervailing measures, this provides free rein to drug manufacturers to further increase prices.30,31
Our study has several limitations. First, our measures of drug prices are calculated from claims data on the basis of invoices at the point of purchase. These include discounts provided at the point of sale but do not subtract out rebates negotiated between Part D plans and drug manufacturers, and thus, overestimate the net prices paid by plans.32 Across all payers, the growth in net prices of branded oncology drugs has been estimated to be 1% to 2% points lower than invoice price growth.33 Second, although our OOP measure should by construction exclude third-party payments by nonprofit charity or patient-assistance programs and coupons that contribute toward required OOP payments, some of these may be erroneously captured in our analyses. For example, a recent study found that despite Medicare’s ban on the use of coupons, 6% to 7% of seniors reported using coupons in Medicare.34 Last, we reported costs PPPM instead of annual costs. Although normalizing costs into monthly units offers a better proxy for price and forms a more reasonable analytical unit to calculate annual price changes and inflation rates, we note that one cannot simply multiply costs PPPM by 12 to obtain annual costs, because these are also determined by the starting month and the duration of treatment.
Several policies have been proposed to deal with the twin problems of increasing prices and high OOP payments for oral therapies.35-39 Although the Medicare Payment Advisory Commission has proposed reforms to the Part D program, the program as currently structured is fundamentally limited in how much pressure is brought to bear on drug prices. However, the advancement of new cancer therapies means that in a growing number of indications, multiple therapies exist for cancer treatment and are included in recognized Clinical Practice Guidelines.40-44 More effective ways should be tested to use price competition among these agents to limit price inflation. First, Part D plans could be allowed to have two specialty drug tiers, similar to plans enrolling a majority of enrollees in the commercial market,20 rather than just one. Patient cost sharing would be capped for drugs on the preferred specialty drug tier, which would include best-in-class drugs for a given indication and drugs for which plans can negotiate lower prices, when similar therapeutic competitors exist. The current specialty tier with coinsurance, even in the catastrophic phase, would be reserved for competitor drugs with higher prices. This value-based insurance design would improve patient financial protection while incentivizing patients and physicians to become more aware of drug prices than they currently are45 and retaining plan, patient, and physician pressure on competing drugs to reduce prices. Second, the Centers for Medicare & Medicaid Services is testing an episode-based payment model for chemotherapy—the Oncology Care Model—in 195 oncology practices serving patients enrolled with Medicare and 16 other payers. Practices share in savings by better coordinating care, including through value-based selection among competing intravenous drugs in Medicare Part B and oral drugs in Part D.46 Although monitoring of the effects of such reforms on cancer care quality and access will be essential, the incentives embodied in these policies could move Medicare toward more efficient and equitable purchasing of oral drugs for cancer patients.
ACKNOWLEDGMENT
We thank Gary Deyter, technical writer from the department of Health Services Research at The University of Texas MD Anderson Cancer Center, for his editorial assistance. We also thank the National Cancer Institute Applied Research Program; the Centers for Medicare & Medicaid Services Office of Research, Development, and Information; Information Management Services; and SEER Program tumor registries for their efforts in the creation of the SEER-Medicare database.
Appendix
Table A1.
Targeted Oral Anti-Cancer Medications Approved Before December 31, 2012
Footnotes
Supported in part by National Cancer Institute Grant No. R01 CA207216 (Y.-C.T.S.), Agency for Healthcare Research and Quality Grant No. R01HS020263 (Y.-C.T.S. and L.L.), and the Duncan Family Institute.
This study used the linked SEER-Medicare database. The interpretation and reporting of these data are the sole responsibility of the authors.
See accompanying Editorial on page 2461
AUTHOR CONTRIBUTIONS
Conception and design: Ya-Chen Tina Shih, Fabrice Smieliauskas
Financial support: Ya-Chen Tina Shih
Administrative support: Ya-Chen Tina Shih
Provision of study materials or patients: Ya-Chen Tina Shih
Collection and assembly of data: Ya-Chen Tina Shih
Data analysis and interpretation: All authors
Manuscript writing: All authors
Final approval of manuscript: All authors
Accountable for all aspects of the work: All authors
AUTHORS' DISCLOSURES OF POTENTIAL CONFLICTS OF INTEREST
Rising Prices of Targeted Oral Anticancer Medications and Associated Financial Burden on Medicare Beneficiaries
The following represents disclosure information provided by authors of this manuscript. All relationships are considered compensated. Relationships are self-held unless noted. I = Immediate Family Member, Inst = My Institution. Relationships may not relate to the subject matter of this manuscript. For more information about ASCO's conflict of interest policy, please refer to www.asco.org/rwc or ascopubs.org/jco/site/ifc.
Ya-Chen Tina Shih
Research Funding: Novartis (Inst)
Ying Xu
No relationship to disclose
Lei Liu
Consulting or Advisory Role: Celladon, Outcomes Research Solutions, Zensun
Travel, Accommodations, Expenses: Outcomes Research Solutions
Fabrice Smieliauskas
No relationship to disclose
REFERENCES
- 1.Sledge GW., Jr What is targeted therapy? J Clin Oncol. 2005;23:1614–1615. doi: 10.1200/JCO.2005.01.016. [DOI] [PubMed] [Google Scholar]
- 2.Aggarwal S. Targeted cancer therapies. Nat Rev Drug Discov. 2010;9:427–428. doi: 10.1038/nrd3186. [DOI] [PubMed] [Google Scholar]
- 3.Kircher SM, Meeker CR, Nimeiri H, et al. The parity paradigm: Can legislation help reduce the cost burden of oral anticancer medications? Value Health. 2016;19:88–98. doi: 10.1016/j.jval.2015.10.005. [DOI] [PubMed] [Google Scholar]
- 4.Geynisman DM, Wickersham KE. Adherence to targeted oral anticancer medications. Discov Med. 2013;15:231–241. [PMC free article] [PubMed] [Google Scholar]
- 5.Experts in Chronic Myeloid Leukemia The price of drugs for chronic myeloid leukemia (CML) is a reflection of the unsustainable prices of cancer drugs: From the perspective of a large group of CML experts. Blood. 2013;121:4439–4442. doi: 10.1182/blood-2013-03-490003. [DOI] [PMC free article] [PubMed] [Google Scholar]
- 6.Newcomer LN. Myths and realities in cancer care: Another point of view. Health Aff (Millwood) 2014;33:1805–1807. doi: 10.1377/hlthaff.2014.0893. [DOI] [PubMed] [Google Scholar]
- 7.Shih YC, Smieliauskas F, Geynisman DM, et al. Trends in the cost and use of targeted cancer therapies for the privately insured nonelderly: 2001 to 2011. J Clin Oncol. 2015;33:2190–2196. doi: 10.1200/JCO.2014.58.2320. [DOI] [PMC free article] [PubMed] [Google Scholar]
- 8.Bennette CS, Richards C, Sullivan SD, et al. Steady increase in prices for oral anticancer drugs after market launch suggests a lack of competitive pressure. Health Aff (Millwood) 2016;35:805–812. doi: 10.1377/hlthaff.2015.1145. [DOI] [PubMed] [Google Scholar]
- 9.Dusetzina SB. Drug pricing trends for orally administered anticancer medications reimbursed by commercial health plans, 2000-2014. JAMA Oncol. 2016;2:960–961. doi: 10.1001/jamaoncol.2016.0648. [DOI] [PubMed] [Google Scholar]
- 10. Zafar SY, Abernethy AP: Financial toxicity, part I: A new name for a growing problem. Oncology (Williston Park) 27:80-81, 149, 2013. [PMC free article] [PubMed]
- 11.de Souza JA, Yap BJ, Hlubocky FJ, et al. The development of a financial toxicity patient-reported outcome in cancer: The COST measure. Cancer. 2014;120:3245–3253. doi: 10.1002/cncr.28814. [DOI] [PubMed] [Google Scholar]
- 12.Altice CK, Banegas MP, Tucker-Seeley RD, et al. Financial hardships experienced by cancer survivors: A systematic review. J Natl Cancer Inst. 2016;109:109. doi: 10.1093/jnci/djw205. [DOI] [PMC free article] [PubMed] [Google Scholar]
- 13.Ramsey S, Blough D, Kirchhoff A, et al. Washington State cancer patients found to be at greater risk for bankruptcy than people without a cancer diagnosis. Health Aff (Millwood) 2013;32:1143–1152. doi: 10.1377/hlthaff.2012.1263. [DOI] [PMC free article] [PubMed] [Google Scholar]
- 14.Jagsi R, Pottow JA, Griffith KA, et al. Long-term financial burden of breast cancer: Experiences of a diverse cohort of survivors identified through population-based registries. J Clin Oncol. 2014;32:1269–1276. doi: 10.1200/JCO.2013.53.0956. [DOI] [PMC free article] [PubMed] [Google Scholar]
- 15.Chino F, Peppercorn J, Taylor DH, Jr, et al. Self-reported financial burden and satisfaction with care among patients with cancer. Oncologist. 2014;19:414–420. doi: 10.1634/theoncologist.2013-0374. [DOI] [PMC free article] [PubMed] [Google Scholar]
- 16.Regenbogen SE, Veenstra CM, Hawley ST, et al. The personal financial burden of complications after colorectal cancer surgery. Cancer. 2014;120:3074–3081. doi: 10.1002/cncr.28812. [DOI] [PubMed] [Google Scholar]
- 17.Neugut AI, Subar M, Wilde ET, et al. Association between prescription co-payment amount and compliance with adjuvant hormonal therapy in women with early-stage breast cancer. J Clin Oncol. 2011;29:2534–2542. doi: 10.1200/JCO.2010.33.3179. [DOI] [PMC free article] [PubMed] [Google Scholar]
- 18.Dusetzina SB, Winn AN, Abel GA, et al. Cost sharing and adherence to tyrosine kinase inhibitors for patients with chronic myeloid leukemia. J Clin Oncol. 2014;32:306–311. doi: 10.1200/JCO.2013.52.9123. [DOI] [PubMed] [Google Scholar]
- 19.Ramsey SD, Bansal A, Fedorenko CR, et al. Financial insolvency as a risk factor for early mortality among patients with cancer. J Clin Oncol. 2016;34:980–986. doi: 10.1200/JCO.2015.64.6620. [DOI] [PMC free article] [PubMed] [Google Scholar]
- 20. EMD Serono: EMD Serono Specialty Digest, (ed 12). 2016. [Google Scholar]
- 21. Report to the Congress: Medicare Payment Policy—March 2016. Medicare Payment Advisory Commission. http://www.medpac.gov/docs/default-source/reports/march-2016-report-to-the-congress-medicare-payment-policy.pdf.
- 22. Report to the Congress: Medicare Payment Policy—March 2013. Medicare Payment Advisory Commission. http://www.medpac.gov/docs/default-source/reports/mar13_entirereport.pdf?sfvrsn=0.
- 23. Report to the Congress—March 2017: Chapter 14, Status report on the Medicare prescription drug program (Part D). Medicare Payment Advisory Commission. http://www.medpac.gov/docs/default-source/reports/mar17_medpac_ch14.pdf?sfvrsn=0.
- 24.Dusetzina SB, Keating NL. Mind the gap: Why closing the doughnut hole is insufficient for increasing Medicare beneficiary access to oral chemotherapy. J Clin Oncol. 2016;34:375–380. doi: 10.1200/JCO.2015.63.7736. [DOI] [PMC free article] [PubMed] [Google Scholar]
- 25. National Cancer Institute: Targeted cancer therapies, https://www.cancer.gov/about-cancer/treatment/types/targeted-therapies/targeted-therapies-fact-sheet.
- 26. Bureau of Labor Statistics: CPI databases. https://www.bls.gov/cpi/data.htm.
- 27. Centers for Medicare & Medicaid Services: 2015 Medicare Drug Spending Data. https://www.cms.gov/Research-Statistics-Data-and-Systems/Statistics-Trends-and-Reports/Information-on-Prescription-Drugs/2015MedicareData.html.
- 28.Trish E, Joyce G, Goldman DP. Specialty drug spending trends among Medicare and Medicare Advantage enrollees, 2007-11. Health Aff (Millwood) 2014;33:2018–2024. doi: 10.1377/hlthaff.2014.0538. [DOI] [PMC free article] [PubMed] [Google Scholar]
- 29.Ubel PA, Bach PB. Copay assistance for expensive drugs: A helping hand that raises costs. Ann Intern Med. 2016;165:878–879. doi: 10.7326/M16-1334. [DOI] [PubMed] [Google Scholar]
- 30.Dafny LS, Ody CJ, Schmitt MA. Undermining value-based purchasing: Lessons from the pharmaceutical industry. N Engl J Med. 2016;375:2013–2015. doi: 10.1056/NEJMp1607378. [DOI] [PubMed] [Google Scholar]
- 31. Berndt ER, McGuire T, Newhouse JP: A Primer on the Economics of Prescription Pharmaceutical Pricing in Health Insurance Markets. Forum for Health Economics & Policy 14:10, 2011. [Google Scholar]
- 32. Hoadley J, Neuman T, Cubanski J: Health Affairs Blog: The cost of a cure: Revisiting Medicare Part D and hepatitis C drugs. http://kff.org/medicare/perspective/health-affairs-blog-the-cost-of-a-cure-revisiting-medicare-part-d-and-hepatitis-c-drugs/
- 33. QuintilesIMS: Global oncology trend report: A review of 2015 and outlook to 2020. http://www.imshealth.com/en/thought-leadership/quintilesims-institute/reports/global-oncology-trend-report-a-review-of-2015-and-outlook-to-2020.
- 34. Office of Inspector General: Manufacturer Safeguards May Not Prevent Copayment Coupon Use for Part D Drugs. Washington, DC, Office of Inspector General, U.S. Department of Health and Human Services, 2014. [Google Scholar]
- 35.Kantarjian H, Rajkumar SV. Why are cancer drugs so expensive in the United States, and what are the solutions? Mayo Clin Proc. 2015;90:500–504. doi: 10.1016/j.mayocp.2015.01.014. [DOI] [PubMed] [Google Scholar]
- 36.Ramsey SD, Lyman GH, Bangs R. Addressing skyrocketing cancer drug prices comes with tradeoffs: Pick your poison. JAMA Oncol. 2016;2:425–426. doi: 10.1001/jamaoncol.2015.5813. [DOI] [PubMed] [Google Scholar]
- 37.Kesselheim AS, Avorn J, Sarpatwari A. The high cost of prescription drugs in the United States: Origins and prospects for reform. JAMA. 2016;316:858–871. doi: 10.1001/jama.2016.11237. [DOI] [PubMed] [Google Scholar]
- 38.Conti RM, Rosenthal MB. Pharmaceutical policy reform--balancing affordability with incentives for innovation. N Engl J Med. 2016;374:703–706. doi: 10.1056/NEJMp1515068. [DOI] [PubMed] [Google Scholar]
- 39.Zafar SY. Financial toxicity of cancer care: It’s time to intervene. J Natl Cancer Inst. 2015;108:108. doi: 10.1093/jnci/djv370. [DOI] [PubMed] [Google Scholar]
- 40. National Comprehensive Cancer Network: NCCN Clinical Practice Guidelines in Oncology, NCCN Evidence Blocks: chronic myeloid leukemia version 2.2017.
- 41. National Comprehensive Cancer Network: NCCN Clinical Practice Guidelines in Oncology, NCCN Evidence Blocks: kidney cancer Version 2.2017.
- 42. National Comprehensive Cancer Network: NCCN Clinical Practice Guidelines in Oncology, NCCN Evidence Blocks: melanoma version 1.2017.
- 43. National Comprehensive Cancer Network: NCCN Clinical Practice Guidelines in Oncology, NCCN Evidence Blocks: non-small cell lung cancer version 3.2017.
- 44. National Comprehensive Cancer Network: NCCN Clinical Practice Guidelines in Oncology, NCCN Evidence Blocks: Acute lymphoblastic leukemia version 2.2016.
- 45.Henrikson NB, Shankaran V. Improving price transparency in cancer care. J Oncol Pract. 2016;12:44–47. doi: 10.1200/JOP.2015.006171. [DOI] [PubMed] [Google Scholar]
- 46.Herman B. Doctors, insurers flock to Medicare’s cancer payment demo despite questions. Modern Healthcare, June 29, 2016.


