

Abstract
Purpose
The Hippo pathway is a tumor suppressor in the liver. However, the clinical significance of Hippo pathway inactivation in HCC is not clearly defined. We analyzed genomic data from human and mouse tissues to determine clinical relevance of Hippo pathway inactivation in HCC.
Experimental Design
We analyzed gene expression data from Mst1/2−/− and Sav1−/− mice and identified a 610-gene expression signature reflecting Hippo pathway inactivation in the liver (silence of Hippo [SOH] signature). By integrating gene expression data from mouse models with those from human HCC tissues, we developed a prediction model that could identify HCC patients with an inactivated Hippo pathway and used it to test its significance in HCC patients, via univariate and multivariate Cox analyses.
Results
HCC patients (National Cancer Institute cohort, n = 113) with the SOH signature had a significantly poorer prognosis than those without the SOH signature (P < 0.001 for overall survival [OS]). The significant association of the signature with poor prognosis was further validated in the Korean (n=100, P = 0.006 for OS) and Fudan University cohorts (n=242, P = 0.001 for OS). On multivariate analysis, the signature was an independent predictor of recurrence-free survival (hazard ratio, 1.6; 95% confidence interval, 1.12–2.28: P = 0.008). We also demonstrated significant concordance between the SOH HCC subtype and the hepatic stem cell HCC subtype that had been identified in a previous study (P < 0.001).
Conclusions
Inactivation of the Hippo pathway in HCC is significantly associated with poor prognosis.
Keywords: HCC, microarrays, genomics, prognosis, Hippo pathway
Introduction
HCC is the second most common cause of cancer-related death in the world, accounting for an estimated 700,000 deaths annually (1). It is one of few cancers whose incident rate has increased in the United States over the past 25 years, and this rate is expected to double over the next 10 to 20 years (2–4). HCC is the second most lethal cancer type in the United States, where its overall 5-year survival rate is around 11% (5). A lack of a molecular classification system and the clinical heterogeneity of this malignant disease have hampered the development of treatment standards.
The Hippo signaling pathway is evolutionarily well conserved, and all of its core components have one or more mammalian orthologs, including MST1/2 (Hippo), SAV1 (Salvador), LATS1/2 (Warts), MOB1 (Mats), YAP1/TAZ (Yorkie), and TEAD1/2/3/4 (Scalloped) (6–9). When Hippo signaling is active, YAP1/TAZ is phosphorylated by LATS1/2 and sequestered by 14-3-3 proteins in cytoplasm. When Hippo signaling is absent, unphosphorylated YAP1/TAZ enters the nucleus and increases the transcriptional activation of genes that are involved in cell proliferation and survival. The Hippo pathway is indispensable in restricting cell growth and proliferation, prompting speculation that many members of this pathway are involved in tumorigenesis. Ectopic overexpression of YAP1 in the mouse liver was found to lead to the development of hepatocellular carcinoma (HCC) (8, 10). This oncogenic function of YAP1 is further supported by the tumor suppressor function of its upstream regulators, which inhibit YAP1 activity by phosphorylating it. Knockout of Sav1 and Mst1/2 in the liver leads to the development of HCC (11–14).
With the advent of new technologies over the past decade, many genome-wide exploration studies have uncovered clinically relevant subtypes of HCC and their associated gene expression signatures (15–22). However, our lack of understanding of the biological characteristics of identified subtypes has hampered the development of treatments tailored to these subtypes. In previous studies (19, 20), we demonstrated the feasibility of “comparative systems genomics,” a system for the cross-species comparison of gene expression data, in determining the similarities between mouse HCC models and HCC patients and allowing us to restratify patients according to well-characterized gene expression signatures from mouse models. In the current study, we expanded the comparative systems genomics approach to identify patients in multiple cohorts whose HCC was of the “silence of Hippo” (SOH) subtype; we assessed the clinical significance of this subtype and its association with previously identified prognostic subtypes of HCC and biomarkers.
Materials and Methods
Gene expression data from mouse models
The generation and breeding of Sav1fl/fl, Mst1fl/fl, and Mst2fl/fl mice were described in a previous report.(11) Mice were subsequently bred to albumin-Cre mice and then backcrossed to homozygous floxed animals. All mice were housed in a conventional facility on a 12-h light/dark schedule, with access to food and water ad libitum. All procedures were approved by The University of Texas MD Anderson Cancer Center (Houston, Texas) Animal Care and Use Committee. To collect gene expression data from HCC and surrounding non-tumor liver tissues from mutant mice (n = 15) and healthy liver tissues from wild-type (WT) mice (n = 8), we extracted total RNA from fresh-frozen tissues using a mirVana RNA Isolation labeling kit (Ambion, Inc.). Five hundred nanograms of total RNA were used for labeling and hybridization (mouse-6 BeadChip v.2 microarray, Illumina), according to the manufacturer’s protocols. After the bead chips were scanned with an Illumina BeadArray Reader, the microarray data were normalized using the quantile normalization method in the Linear Models for Microarray Data package in the R language environment (23). The expression level of each gene was transformed to a log2 base before further analysis. Primary microarray data from mouse liver tissues are available in the National Center for Biotechnology Information (NCBI) Gene Expression Omnibus (GEO) public database (accession number GSE32510).
Patients and gene expression data from human tissues
Gene expression data from the National Cancer Institute (NCI) (n = 113), Mount Sinai Hospital (MSH) (n = 91), and Fudan University Liver Cancer Institute (FULCI) (n = 242) HCC cohorts are available from the NCBI’s GEO database (accession numbers GSE1898, GSE4024, GSE9843, and GSE14520) (16, 18–20, 22). To complement the gene expression data from previous studies, we generated additional gene expression data from 100 HCC patients (Korean cohort) as an independent validation cohort for the prognostic SOH signature. Tumor specimens and clinical data were obtained from HCC patients who had undergone hepatectomy as a primary treatment for HCC at Seoul National University, Seoul, Korea, and Chonbuk National University, Jeonju, Korea. One hundred surgically removed frozen HCC specimens were used for the microarray experiments. Samples were frozen in liquid nitrogen and stored at −80°C until RNA extraction. The study protocols were approved by the institutional review boards at both institutions, and all participants provided written informed consent. Gene expression data from the Korean cohort were generated using the Illumina microarray platform human-6 v.2. Patients in the Korean cohort were monitored prospectively at least once every 3 months after surgery. The primary microarray data are available in the NCBI’s GEO public database (accession number GSE16757).
Table 1 shows the pathologic and clinical characteristics of the patients in all four cohorts. All patients had undergone surgical resection as their primary treatment. Survival data were not available for the MSH cohort; thus, these patients were not used in the survival analyses. Recurrence-free survival (RFS) duration was defined as the interval from the day of surgery to the first confirmed recurrence, and data were censored for patients who were alive without recurrence at last clinical follow-up. Of 113 patients in NCI cohort, recurrence data were only available from 66 patients.
Table 1.
Baseline clinical and pathological features of HCC patients
| Cohort | ||||
|---|---|---|---|---|
|
|
||||
| Variable | NCI | Korean | FULCI | MSH |
| Number of patients | 113 | 100 | 242 | 91 |
| Male, n (%) | 81 (72%) | 83 (83%) | 211 (87%) | 27 (30%) |
| Female, n (%) | 32 (28%) | 17 (17%) | 31 (13%) | 54 (59%) |
| NA, n (%) | 10 (11%)* | |||
| Age, years | ||||
| Median | 56 | 55 | 50 | 68 |
| Range | 26–85 | 25–70 | 21–77 | 42–80 |
| AFP (>300 ng/ml), n (%) | ||||
| + | 51 (45%) | 32 (32%) | 110 (45%) | 15 (17%) |
| − | 53 (47%) | 68 (68%) | 128 (53%) | 54 (59%) |
| NA | 9 (8%) | 0 | 4 (2%) | 22 (24%) |
| HBV, n (%) | ||||
| + (%) | 54 (48%) | 58 (58%) | 218 (90%) | |
| − (%) | 59 (52 %) | 17 (17%) | 6 (2.5%) | 91 (100%) |
| NA | 25 (25%) | 18 (7.5%) | ||
| AJCC stage, n (%) | ||||
| I | 35 (35%) | 96 (40%) | ||
| II | 17 (17%) | 78 (32%) | ||
| III | 48 (48%) | 51 (21%) | ||
| IV | 0 (0%) | 0 (0%) | ||
| NA | 113 (100%) | 17 (7%) | 91 (100%) | |
| BCLC stage, n (%) | ||||
| 0 | 0 (0%) | 20 (8%) | ||
| A | 53 (53%) | 152 (63%) | ||
| B | 37 (37%) | 24 (10%) | ||
| C | 6 (6%) | 29 (12%) | ||
| D | 4 (4%) | 0 (0%) | ||
| NA | 113 (100%) | 17 (7%) | 91 (100%) | |
| Death, n | 71 | 43 | 96 | |
| Median follow-up duration, (months) | 23.5 | 48.5 | 51.6 | |
AFP, alpha-fetoprotein
NA, not applicable
HBV, hepatitis B virus
Patient sex information was not available for the patient who underwent liver transplantation.
Statistical analysis
BRB-ArrayTools was primarily used for the statistical analysis (24). We identified genes that were differentially expressed between the two subtypes using a random-variance t-test (25). Differences in gene expression were considered statistically significant if their P value was less than 0.001. A stringent significance threshold was used to minimize the number of false-positive findings. We also determined whether the expression profiles differed between the subtypes by permuting the labels of which arrays corresponded to which subtype. For each permutation, the P values were recomputed and the number of genes that was significant at the 0.001 level was noted. The proportion of permutations that produced at least as many significant genes as did the actual data was considered the significance level of the global test.
We estimated patient prognoses using Kaplan-Meier plots and the log-rank test. We used a multivariate Cox proportional hazards regression analysis to evaluate independent prognostic factors associated with survival; we used gene signature, tumor stage, and pathologic characteristics as covariates (26). A P value less than 0.05 indicated statistical significance and all statistical tests were two-tailed. We carried out all statistical analyses in the R language environment (http://www.r-project.org).
Drop in concordance index analysis was carried out as described in previous studies (27–29). Briefly, using eight variables in Table 2, eight prediction models lacking each one variable were generated and compared with the full model containing all variables. In each comparison, the degree of decrease in predictive accuracy was estimated by measuring drop in concordance index after omitting one variable.
Table 2.
Univariate and multivariate Cox regression analyses of recurrence-free survival*
| Univariate | Multivariate | |||
|---|---|---|---|---|
|
|
||||
| Characteristic | Hazard ratio (95% CI) | P value | Hazard ratio (95% CI) | P value |
| Patient sex (M or F) | 1.4 (0.89–2.18) | 0.14 | 1.2 (0.76–1.9) | 0.41 |
| Age (>60 years or not) | 0.88 (0.62–1.25) | 0.49 | 0.85 (0.58–1.26) | 0.43 |
| AFP (>300 ng/ml or not) | 1.25 (0.94–1.67) | 0.12 | 1.02 (0.75–1.38) | 0.9 |
| Cirrhosis (yes or no) | 1.08 (0.72–1.64) | 0.68 | 1.18 (0.75–1.83) | 0.45 |
| Tumor size (>5 cm or not) | 1.34 (1.0–1.79) | 0.04 | 1.13 (0.82–1.56) | 0.42 |
| Cohort (Korean or FULCI) | 1.17 (0.85–1.59) | 0.32 | 1.16 (0.82–1.6) | 0.38 |
| BCLC stage (B/C/D or 0/A) | 1.74 (1.2–2.3) | < 0.001 | 1.47 (1.05–2.1) | 0.02 |
| SOH signature (SOH or AH) | 1.83 (1.31–2.5) | < 0.001 | 1.6 (1.14–2.39) | 0.006 |
Patients in Korean and FULIC cohorts were only included for analysis.
CI, confidence interval
AFP, alpha-fetoprotein
BCLC, Barcelona Clinic Liver Cancer
SOH, silence of Hippo pathway
AH, active Hippo pathway
FULCI, Fudan University Liver Cancer Institute
Prediction model
Before using the prognostic classification algorithms, we normalized the gene expression data used as training and test sets by centralizing the gene expression level across tissues. To stratify HCC patients according to the mouse SOH gene expression signature, we used a classification algorithm based on the Bayesian compound covariate predictor (BCCP) (30, 31). A detailed description of the BCCP is available in the Supplementary information.
Immunohistochemical staining of human HCC tissue
To avoid endogenous biotin contamination during immunohistochemical staining, we used the DAKO EnVision system (DAKO, Carpentaria, CA), which uses dextran polymers conjugated with horseradish peroxidase. In brief, 4-micron-thick HCC tissue sections were de-paraffinized with xylene and rehydrated with graded alcohols. After washing the sections in distilled water, we performed a microwave antigen retrieval procedure in citrate buffer (pH 6.0) for 20 min. Thereafter, tissue sections were incubated with peroxidase blocking solution (ready to use, DAKO) and Protein Block serum-free solution (ready to use, DAKO) at ambient temperature. The slides were rinsed and incubated with anti-YAP1 antibody (H-125; 1:100, Santa Cruz Biotechnology, Santa Cruz, CA) at 4°C overnight. They were rinsed again, a secondary antibody (EnVision kit, DAKO, Carpentaria, CA) was applied, and peroxidase activity was detected using the enzyme substrate, 3-amino-9-ethyl carbazole (DAKO, Carpentaria, CA). The slides were counterstained with hematoxylin. To evaluate immunohistochemical staining for YAP1, the staining intensity was scored as 0 (no staining), 1 (weak staining), 2 (intermediate staining), or 3 (strong staining), and the staining area was scored as 0 (no staining cells), 1 (1% of positive cells), 2 (2%–10% of positive cells), 3 (11%–33% of positive cells), 4 (34%–66% of positive cells), or 5 (67%–100% of positive cells). Thereafter, the sum of the staining intensity score and staining area score (0 to 8) was used for further analysis. The immunohistochemical expression of YAP1 was classified as positive or negative by a receiver operating characteristic (ROC) curve analysis at the highest positive likelihood ratio point for HCC recurrence. The cut-off point for the sum score was 7. Immunohistochemical staining for YAP was scored as positive when the sum score was 7 or more.
We used immunohistochemical staining data, available from a previously published study (16). Formalin-fixed, paraffin-embedded sections were used to assess phosphorylated proteins in human tissue using anti-phosphorylated (S473) AKT antibody, anti-phosphorylated (Y1316) insulin-like growth factor-I receptor, and anti-phosphorylated (S240/244) S6.
Western Blot Analysis and siRNA
siYAP1 and siTAZ were purchased from Dharmacon (SMARTPool). Cells were transfected with indicated siRNA using oligofectamine (Invitrogen) for the indicated times. Cells were maintained and Western blot analysis performed as described previously (32). Antibodies used were against YAP1 (sc-500; Santa Cruz Biotechnology), pYAP1 (#4911; Cell Signaling Technology [CST]), TAZ (560235; BD Biosciences), p70 S6K (#9202; CST), p-p70 S6K (Thr389) (#9205; CST), β-actin (ab3280; Abcam), S6 (#2217; CST), pS6 (Ser240/244) (#2215; CST), 4E-BP1 (#9452; CST), and p4E-BP1 (Ser65) (#9456; CST).
RESULTS
Gene expression signature of inactivation of the Hippo pathway in the liver
We generated gene expression data from 33 liver tissues of genetically modified Sav1−/− and Mst1/2−/− mice and WT mice and analyzed them to identify a gene expression signature that was significantly associated with SOH in the mouse liver and the development of HCC (Fig. 1). We identified genes whose expression was uniquely associated with the SOH pathway in the mouse liver. Two gene lists were generated using a stringent cut-off value for statistical significance (P < 0.001 by the two-sample t-test and a two-fold difference). Gene list X represented the genes that were differentially expressed between normal liver tissue from WT mice and non-tumor-surrounding tissue from tumor-bearing Sav1−/− and Mst1/2−/− mice. Gene list Y represented the genes that were differentially expressed between non-tumor-surrounding liver tissue and HCC tumors from Sav1−/− and Mst1/2−/− mice (Fig. 1A). Three different gene expression patterns were observed among all tissues (Fig. 1B): X not Y (737 probes), X and Y (97 probes), and Y not X (255 probes). Genes in the X not Y category (610 unique genes) displayed unique expression patterns that were significantly associated with the SOH pathway (Supplementary Table 1).
Figure 1. Gene expression patterns that were significantly associated with the silence of Hippo pathway in the mouse liver.
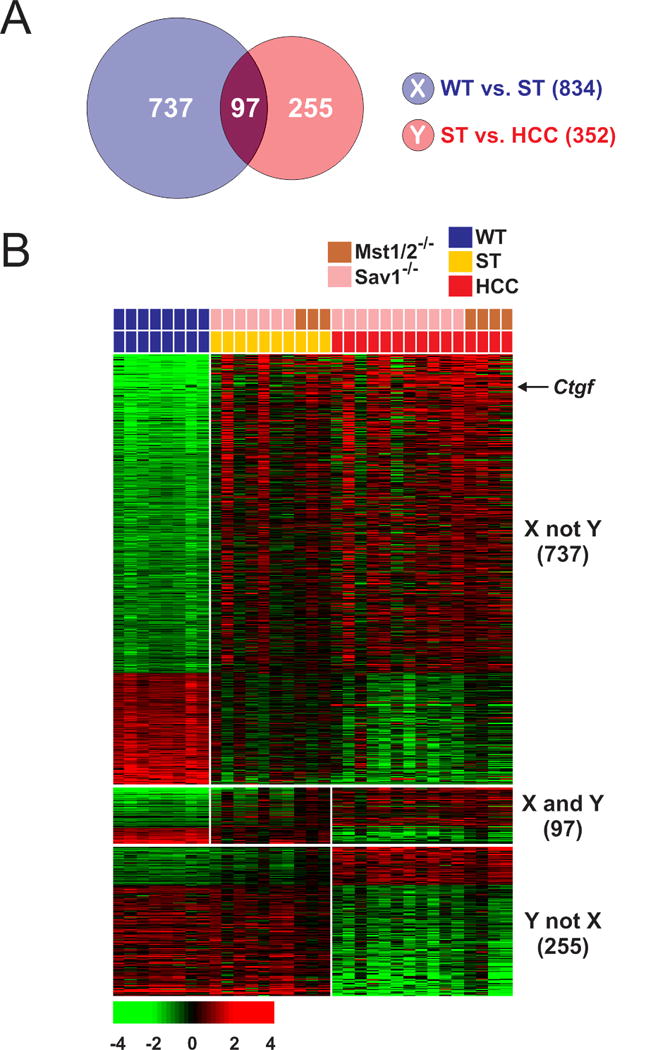
(A) Venn diagram of genes selected using a two-sample t-test with a multivariate permutation test (10,000 random permutations). The blue circle (gene list X) represents genes that were differentially expressed between normal livers from wild-type (WT) mice and non-tumor tissues from mutant (Sav1−/− and Mst1/2−/−) mice (ST). The red circle (gene list Y) represents genes that were differentially expressed between all non-tumor liver tissues and all hepatocellular carcinoma tissues from mutant (Sav1−/− and Mst1/2−/−) mice. A stringent cut-off (P < 0.001 and 2-fold difference) was used to retain only the genes whose expression was significantly different between the two groups of tissues examined. The 737 probes (610 unique genes) in the X (not Y) category displayed unique expression patterns that were significantly associated with the silence of Hippo pathway.
(B) Expression patterns of selected genes in the Venn diagram. Colored bars at the top of the heat map represent the tissues indicated.
The expression of Ctgf, one of the best known direct downstream targets of Yap1 (33), was highly up-regulated in non-tumor-surrounding liver (5.4-fold, P = 9.0 × 10⁻⁶ by the two-sample t-test) and HCC tissues (7.5-fold, P = 5.6 × 10⁻⁹ by the two-sample t-test) in both Sav1−/− and Mst1/2−/− mutant mice compared with in normal liver in WT mice, indicating that the up-regulation of many genes in murine HCC is due to the activation of Yap1 in the mouse liver. The functional category of genes in the signature is consistent with known molecular features of the Hippo pathway when it is inactivated (Supplementary Table 2) (6–9). Interestingly many of canonical pathways enriched in SOH signature are related to immune systems (Supplementary Table 3), suggesting potential connection of Hippo pathway to activation of immune system in liver, Because genes in list Y simply reflects transformed nature of hepatocytes during tumorigenesis, we only included genes in X not Y category for further analysis and it is referred to as the SOH signature. The expression of many genes in the SOH signature is similar between surrounding tissues and HCC; the expression patterns of the two groups of tissues differ substantially, but the significance of these differences did not reach the statistical cut-off (P < 0.001) that was initially used to select genes. For example, the expression of Ctgf was 2.1-fold higher (P = 0.05 by the two-sample t-test) in HCC than in non-tumor surrounding tissues of mutant mouse liver.
Silence of Hippo pathway is significantly associated with poor prognosis in human HCC
After identifying a gene expression signature, we determined its clinical relevance in human HCC by comparing the mouse SOH signature with gene expression data from human HCC. Gene expression data from 113 NCI HCC tumors (20) were used for this analysis (Table 1); a BCCP algorithm (30) was used to determine the probability that SOH was present (Fig. 2A), as described in Supplementary Information. We dichotomized the HCC patients according to SOH probability (Fig. 2B) and found that 24 (21%) had a high probability (>0.65) of having the SOH signature (SOH subgroup), while the remainder lacked this signature (active Hippo [AH] subgroup). Kaplan-Meier plots showed significant differences in RFS (P = 7.4 × 10⁻⁵, by log-rank test) and overall survival (OS, P = 9.5 × 10⁻⁵) between the two subgroups (Fig. 2C, D), strongly indicating that the SOH pathway in HCC dictates clinical outcome and is associated with poor prognosis.
Figure 2. Significant association between the silence of Hippo (SOH) signature and prognosis in patients with hepatocellular carcinoma.
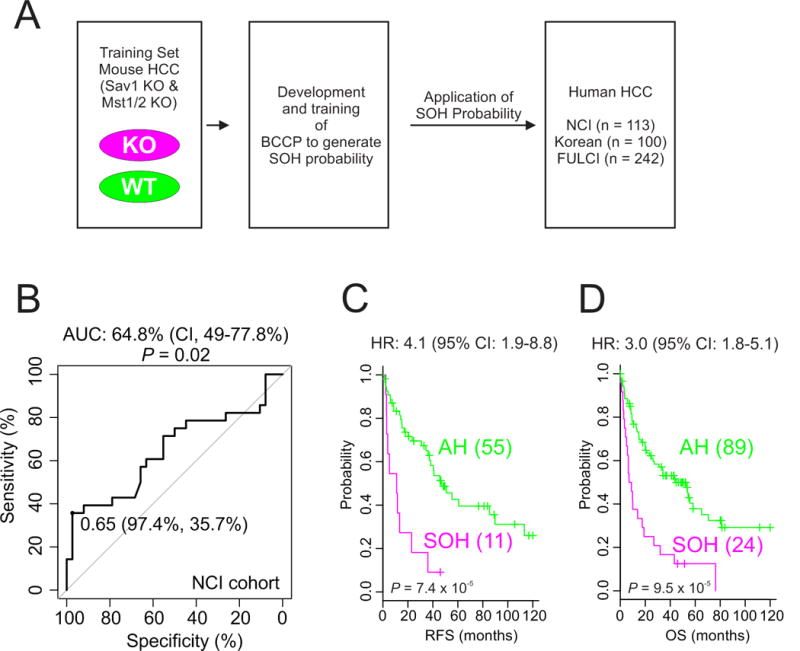
(A) Schematic overview of the strategy used to predict the probability that SOH was present in human HCC on the basis of gene expression signatures. KO, knockout; WT, wild type; BCCP, Bayesian compound covariate predictor.
(B) Receiver operating characteristic curve analysis of SOH probability over 3-year recurrence of HCC in the National Cancer Institute cohort.
(C, D) Kaplan-Meier plots of recurrence-free survival and overall survival of SOH and AH subtype patients in the National Cancer Institute cohort. P values were obtained using the log-rank test. The + symbols in the panel indicate censored data.
We further tested the association between the SOH pathway and clinical outcome in an independent HCC cohort (Korean cohort, n = 100). When BCCP and the same cut-off (0.65) used in the NCI cohort were used, the Kaplan-Meier plots showed significant differences in both RFS and OS between the two subgroups of the Korean cohort (Fig. 3A, B). The robustness of the association between the SOH signature and prognosis was further validated in another larger, independent cohort (FULCI cohort) (22). When 242 patients in the FULCI cohort were stratified according to SOH probability (cut-off of 0.65), Kaplan-Meier plots showed a significant difference in RFS and OS (P = 0.006 and 0.001, respectively, by log-rank test) (Fig. 3C, D). Furthermore, immunohistochemical staining of the same HCC tissues from the Korean cohort showed significant concordance between YAP1 expression and the SOH signature, suggesting that the SOH signature from mouse models reflects inactivation of the Hippo pathway in human HCC (Supplementary Fig. 1 and Supplementary Table 4). Together, the results from three independent HCC cohorts (total, 455 patients) clearly demonstrate a strong association between the SOH pathway and poor prognosis in HCC.
Figure 3. Validation of the robustness of the silence of Hippo signature in independent cohorts.
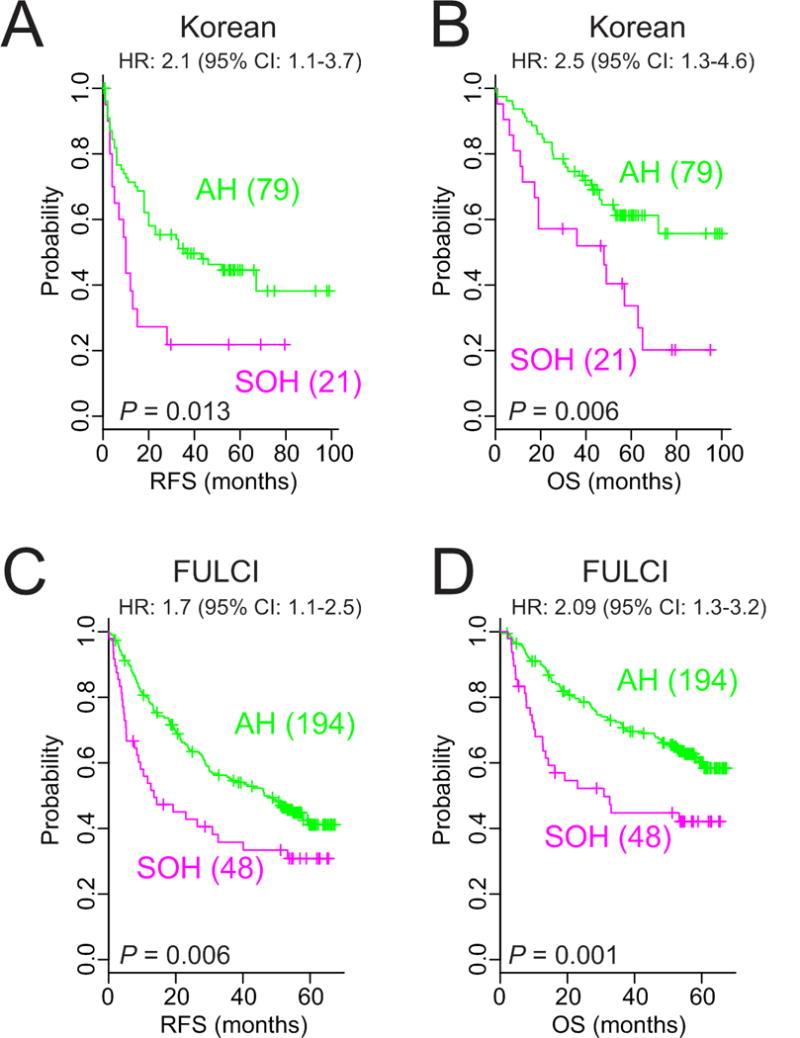
(A, B) Kaplan-Meier plots of recurrence-free survival and overall survival in patients with the silence of Hippo and active Hippo subtypes in the Korean cohort.
(C, D) Kaplan-Meier plots of recurrence-free survival and overall survival of the two subtypes of patients in the Fudan University Liver Cancer Institute cohort. P values were obtained using the log-rank test. The + symbols in the panel indicate censored data.
SOH signature is an independent predictor of prognosis
We combined the clinical data from two test cohorts that had not been used to determine the cut-off of SOH probability (Korean and FULCI cohorts) and assessed the prognostic strength of the SOH signature with and without adjustment for known clinical prognostic factors. On univariate analysis, significant predictors of RFS included the SOH signature, tumor size, and Barcelona Clinic Liver Cancer (BCLC) stage (Table 2). When the dichotomized SOH subtypes was included in the multivariate model, it was the most significant predictor of RFS (hazard ratio, 1.6; 95% confidence interval [CI], 1.14–2.39, P = 0.006) (Table 2). The significance remained same when dichotomized subtypes were replaced by continuous Bayesian probability of SOH signature in the multivariate model (Supplementary Table 5). Likewise, multivariate analysis of over overall survival also showed significance of SOH signature with or with dichotomization (Supplementary Table 6 and 7). In addition, we carried out “drop in concordance index” approach to estimate how much SOH signature can improve the predictive accuracy of the model (27–29). The biggest drop in concordance index was observed when SOH gene expression signature was omitted in prediction model (Supplementary Table 8). Taken together, these findings suggest that the signature retains its prognostic relevance even after the classical pathological prognostic features have been taken into account.
SOH signature is concordant with other prognostic signatures
In a previous study, we identified a subtype of HCC whose gene expression characteristics were highly similar to those of hepatic stem cells; we named it the hepatic stem cell (HS) subtype (20). Since the survival patterns of the SOH subtype are highly similar to those of the HS subtype, we tested the concordance of the SOH subtype with the HS subtype in the NCI cohort; we found remarkable concordance between members of each subtype. Of 24 SOH HCC tumors, 20 had the HS signature (Kappa = 0.799, P = 2.2 × 10⁻¹⁶ by Cohen’s Kappa Statistics; Supplementary Table 9). More interestingly, 426 (47%) of the 907 genes that comprise the HS signature (20) were significantly associated with the SOH subtype (Supplementary Fig. 2), further suggesting that the SOH subtype is biologically similar to the HS subtype.
We further tested the concordance between the SOH subtype and the 65 gene–based recurrence risk score of HCC, which was developed by correlating gene weight with tumor recurrence (34). All 24 patients with the SOH subtype were classified into the high-risk group for recurrence, while the vast majority of patients with the AH subtype were classified into the low-risk group (Kappa = 0.37, P = 1.97 × 10⁻⁸ by Cohen’s Kappa statistics; Supplementary Table 10). Moreover, the Pearson correlation between the 65-gene risk score and SOH Bayesian probability was significantly high in all three cohorts (r > 0.85; P < 2.2 × 10⁻¹⁶ in all cohorts, Fig. 4A), strongly suggesting that the 65-gene risk score reflects inactivation of the Hippo pathway in HCC.
Figure 4. Significant association between YAP1 and TAZ activation and prognosis and mTORC1 regulation in HCC.
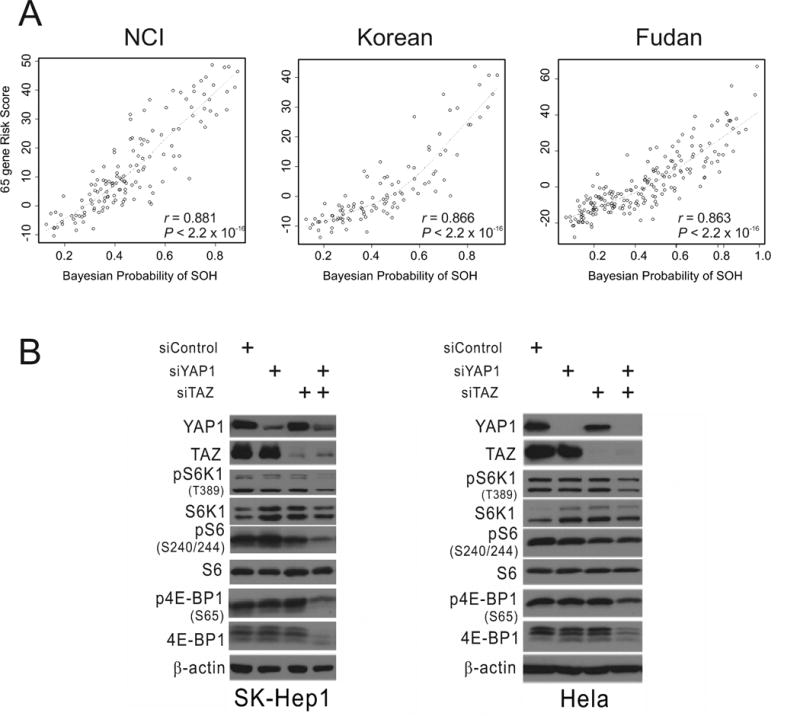
(A) Correlation between Bayesian probability of the silence of the Hippo signature and the 65-gene risk score in the National Cancer Institute (NCI), Korean, and Fudan University Liver Cancer Institute cohorts. Dotted curves represent locally weighted scatterplot smoothing curves.
(B) Western blot analyses of SK-Hep1 and HeLa cells with the indicated antibodies after silencing YAP1 and TAZ expression with specific siRNAs.
SOH signature is associated with activation of mTORC1 in HCC
We next determined the association between SOH and other well-known genetic alterations in HCC. Ninety-one HCC tissues from the MSH cohort (16) were stratified according to the mouse SOH signature using BCCP and the same cut-off point (0.65) used in human tumors. Interestingly, the phosphorylation of signaling proteins was significantly associated with the SOH subtype. SOH HCC had relatively higher AKT phosphorylation (P = 0.017 by χ2-test) and insulin-like growth factor R1 phosphorylation (P = 0.019) levels than did the AH subtype (Supplementary Table 10). Most interestingly, its association with the phosphorylation of ribosomal protein S6, a substrate of S6K1 that is activated by mTORC1 (35), was the strongest among all examined phosphorylations (P = 1.4 × 10⁻⁴ by χ2-test), indicating that mTORC1 is more activated in the SOH subtype. To validate this interesting observation, we next silenced the expression of YAP1 and TAZ in SK-Hep1 HCC cells and measured the phosphorylation of S6, S6K1, and 4E-BP1, which are the best known direct downstream targets of mTORC1 (35), In good agreement with our observations in clinical samples, phosphorylation of three proteins was substantially reduced (Fig. 4B), suggesting that YAP1/TAZ is necessary for maintaining mTORC1 activity in HCC cells. A similar reduction in mTORC1 activity upon silencing of YAP1 and TAZ expression was also observed in HeLa cells (Fig. 4B), further supporting the hypothesis that YAP1/TAZ regulates mTORC1.
DISCUSSION
We identified a gene expression signature that reflects inactivation of the Hippo pathway in the mouse liver and show that this inactivation accounts for the poor prognosis of a subset of patients with HCC. We tested and validated the association between the SOH subtype and clinical outcome in 455 patients in three independent cohorts. The SOH subtype had the highest hazard ratio for RFS on multivariate analysis, independent of other clinicopathological characteristics, including BCLC stage; thus, this signature may be able to identify clinically important subtypes that are not recognized by current staging criteria.
The SOH signature showed great concordance with independently developed genomic and genetic predictors in previous studies. First, the SOH subtype significantly overlapped with the HS subtype, which was identified by the gene expression signature that was originally derived from HS (20); this finding strongly suggests that inactivation of the Hippo pathway occurs predominantly in HS during hepatocarcinogenesis. This suggestion is supported by the finding that inactivation of the Hippo pathway in liver-specific Sav1−/− mice resulted in significant expansion of liver progenitor cells (11, 12). However, our current data do not rule out the possibility that the significant concordance between the SOH and HS subtypes results from inactivation of the Hippo pathway in mature hepatocytes, leading to dedifferentiation and the acquisition of HS characteristics. Second, we found a significant positive correlation between the SOH signature and the previously defined 65-gene HCC recurrence risk score (Fig. 4), which suggests that inactivation of the Hippo pathway in HCC is well reflected in this independently developed score. The strong correlation further suggests that alteration of the Hippo pathway is indeed a major genetic event that dictates the clinical outcome of patients with HCC. Thus, we rediscovered previously recognized clinically distinct subtypes of HCC and updated what is known about these subtypes; our observation that the poor clinical outcome of patients with the HS subtype is due to inactivation of the Hippo pathway suggests that YAP1 and TAZ are good therapeutic targets for patients with the HS phenotype. Furthermore, the results of a direct comparison with previously developed prognosis signatures suggested that the SOH signature is more accurate at estimating prognosis in patients with HCC, as it had the highest association with prognosis.
Our data also demonstrated that YAP1 and TAZ regulate mTORC1, the master regulator of cell growth, as evidenced by the significant association between the SOH subtype and phosphorylation of the downstream target of mTORC1 in human HCC tissues and the reduced phosphorylation after silencing YAP1 and TAZ expression in HCC cells. The results of a previous study suggested that YAP1 and TAZ regulate mTORC1 through the PTEN-PI3K-AKT pathway (36). Thus, it will be interesting to determine whether the regulation of mTORC1 by YAP1 and TAZ is mediated by the PTEN-PI3K-AKT pathway in HCC.
There are several limitations to our study. First, the tissues and clinical information used in our analysis were retrospectively collected. Therefore, although we obtained highly reproducible results from three independent patient cohorts, it will be necessary to validate our prognostic model in a prospective study. Second, because most of our patients were hepatitis B virus positive, the prognostic value of the SOH signature may be limited to hepatitis B-related HCC. Thus, it will be necessary to test our models in patients with different etiological backgrounds, such as hepatitis C virus or obesity, in a future study. Third, all of the data in the current study were generated using microarray technology and frozen tissues that are not routinely available through general practice in clinics. Therefore, it will be necessary to identify a small number of robust genes (5 to 10 genes) that reflect inactivation of the Hippo pathway in HCC and use simpler but more robust methods, such as quantitative reverse transcription polymerase chain reaction experiments, to measure the expression of these genes using RNA from easily available formalin-fixed, paraffin-embedded tissues.
In conclusion, we used a well-defined SOH gene expression signature from a mouse model to identify two clinically distinct subtypes of human HCC; in the process, we uncovered molecular characteristics that were associated with clinical outcome. The molecular classification of tumors has significantly improved patient outcomes in some cancers by allowing the development of treatments that are tailored to the abnormalities present in each patient's cancer cells. An example is the discovery of estrogen receptor–positive and ERBB2 (or HER2)–positive breast cancer subtypes and the subsequent development of agents that target estrogen receptor or HER2 (37). The results of our study may provide a foundation for the molecular classification of HCC and thus the development of effective targeted therapies and scientifically designed clinical trials.
Supplementary Material
Translational relevance.
Hepatocellular carcinoma (HCC) is the second most common cause of cancer-related death (700,000 deaths per year) in the world and the second most lethal cancer type in the U.S., where its overall 5-year survival rate is around 11%. Lack of molecular classification and the clinical heterogeneity of HCC have hampered development of treatment standards. Our data suggested that Hippo pathway is inactivated in about 20% of patients with HCC and YAP1/TAZ, downstream effector of Hippo pathway. These findings may guide the development of subgroup-specific treatments, e.g., targeted YAP1/TAZ, and improve the design of future clinical trials.
Acknowledgments
Grant Support
This research was supported in part by the 2011 and 2012 cycles of the MD Anderson Sister Institute Network Fund, NIH CA150229 (J-S.L.), Bio and Medical Technology Development Program grant M10642040002-07N4204-00210 (W.J.), Scientific Research Center Program grant 2012R1A5A1048236 (W.J.), Basic Science Research Program through the National Research Foundation of Korea (NRF) funded by the Ministry of Education (NRF-2014R1A1A2053529) (Y-Y.P) and the GlaxoSmithKline Research Fund of the Korean Association for the Study of the Liver (J.H.K.).
Footnotes
Disclosure of Potential Conflicts of Interest
No potential conflicts of interest were disclosed.
Authors' Contributions
Conception and design: B.H. Sohn, J-J. Shim, Y-Y. Park, J-S. Lee
Development of methodology: S-B. Kim, S. M. Kim, S-C. Kim, W. Jeong,
Acquisition of data (provided animals, acquired and managed patients, provided facilities, etc.): B.H. Sohn, J-J. Shim, K. Y. Jang, S. M. Kim, J. H. Kim, Y. J. Kim, D-G. Kim, R. L. Johnson.
Analysis and interpretation of data (e.g., statistical analysis, biostatistics, computational analysis): B.H. Sohn, J-J. Shim, S-B. Kim, S-C. Kim, J. E. Hwang, H-J. Jang, H-S. Lee, S. S. Kim, E. S. Park, J. Heo, S-H. Leem, A. Kaseb, M. M. Hassan, M. Cha, I-S. Chu. B.H. Sohn, J-J. Shim, Y-Y. Park.
Writing, review, and/or revision of the manuscript: B.H. Sohn, J-J. Shim, Y-Y. Park, J-S. Lee
Administrative, technical, or material support (i.e., reporting or organizing data, constructing databases): S-B. Kim, Y-Y. Park, J-S. Lee
Study supervision: J-J. Shim, Y-Y. Park, J-S. Lee
References
- 1.Torre LA, Bray F, Siegel RL, Ferlay J, Lortet-Tieulent J, Jemal A. Global cancer statistics, 2012. CA Cancer J Clin. 2015;65:87–108. doi: 10.3322/caac.21262. [DOI] [PubMed] [Google Scholar]
- 2.Davila JA, Morgan RO, Shaib Y, McGlynn KA, El Serag HB. Hepatitis C infection and the increasing incidence of hepatocellular carcinoma: a population-based study. Gastroenterology. 2004;127:1372–80. doi: 10.1053/j.gastro.2004.07.020. [DOI] [PubMed] [Google Scholar]
- 3.El Serag HB, Mason AC. Rising incidence of hepatocellular carcinoma in the United States. N Engl J Med. 1999;340:745–50. doi: 10.1056/NEJM199903113401001. [DOI] [PubMed] [Google Scholar]
- 4.El Serag HB. Hepatocellular carcinoma: recent trends in the United States. Gastroenterology. 2004;127:S27–S34. doi: 10.1053/j.gastro.2004.09.013. [DOI] [PubMed] [Google Scholar]
- 5.Jemal A, Siegel R, Ward E, Hao Y, Xu J, Murray T, et al. Cancer statistics, 2008. CA Cancer J Clin. 2008;58:71–96. doi: 10.3322/CA.2007.0010. [DOI] [PubMed] [Google Scholar]
- 6.Halder G, Johnson RL. Hippo signaling: growth control and beyond. Development. 2011;138:9–22. doi: 10.1242/dev.045500. [DOI] [PMC free article] [PubMed] [Google Scholar]
- 7.Pan D. Hippo signaling in organ size control. Genes Dev. 2007;21:886–97. doi: 10.1101/gad.1536007. [DOI] [PubMed] [Google Scholar]
- 8.Dong J, Feldmann G, Huang J, Wu S, Zhang N, Comerford SA, et al. Elucidation of a universal size-control mechanism in Drosophila and mammals. Cell. 2007;130:1120–33. doi: 10.1016/j.cell.2007.07.019. [DOI] [PMC free article] [PubMed] [Google Scholar]
- 9.Saucedo LJ, Edgar BA. Filling out the Hippo pathway. Nat Rev Mol Cell Biol. 2007;8:613–21. doi: 10.1038/nrm2221. [DOI] [PubMed] [Google Scholar]
- 10.Camargo FD, Gokhale S, Johnnidis JB, Fu D, Bell GW, Jaenisch R, et al. YAP1 increases organ size and expands undifferentiated progenitor cells. Curr Biol. 2007;17:2054–60. doi: 10.1016/j.cub.2007.10.039. [DOI] [PubMed] [Google Scholar]
- 11.Lu L, Li Y, Kim SM, Bossuyt W, Liu P, Qiu Q, et al. Hippo signaling is a potent in vivo growth and tumor suppressor pathway in the mammalian liver. Proc Natl Acad Sci U S A. 2010 Jan 26;107:1437–42. doi: 10.1073/pnas.0911427107. [DOI] [PMC free article] [PubMed] [Google Scholar]
- 12.Lee KP, Lee JH, Kim TS, Kim TH, Park HD, Byun JS, et al. The Hippo-Salvador pathway restrains hepatic oval cell proliferation, liver size, and liver tumorigenesis. Proc Natl Acad Sci U S A. 2010 May 4;107:8248–53. doi: 10.1073/pnas.0912203107. [DOI] [PMC free article] [PubMed] [Google Scholar]
- 13.Song H, Mak KK, Topol L, Yun K, Hu J, Garrett L, et al. Mammalian Mst1 and Mst2 kinases play essential roles in organ size control and tumor suppression. Proc Natl Acad Sci U S A. 2010 Jan 26;107:1431–6. doi: 10.1073/pnas.0911409107. [DOI] [PMC free article] [PubMed] [Google Scholar]
- 14.Zhou D, Conrad C, Xia F, Park JS, Payer B, Yin Y, et al. Mst1 and Mst2 maintain hepatocyte quiescence and suppress hepatocellular carcinoma development through inactivation of the Yap1 oncogene. Cancer Cell. 2009 Nov 6;1916:425–38. doi: 10.1016/j.ccr.2009.09.026. [DOI] [PMC free article] [PubMed] [Google Scholar]
- 15.Boyault S, Rickman DS, de RA, Balabaud C, Rebouissou S, Jeannot E, et al. Transcriptome classification of HCC is related to gene alterations and to new therapeutic targets. Hepatology. 2007;45:42–52. doi: 10.1002/hep.21467. [DOI] [PubMed] [Google Scholar]
- 16.Chiang DY, Villanueva A, Hoshida Y, Peix J, Newell P, Minguez B, et al. Focal gains of VEGFA and molecular classification of hepatocellular carcinoma. Cancer Res. 2008;68:6779–88. doi: 10.1158/0008-5472.CAN-08-0742. [DOI] [PMC free article] [PubMed] [Google Scholar]
- 17.Hoshida Y, Villanueva A, Kobayashi M, Peix J, Chiang DY, Camargo A, et al. Gene expression in fixed tissues and outcome in hepatocellular carcinoma. N Engl J Med. 2008;359:1995–2004. doi: 10.1056/NEJMoa0804525. [DOI] [PMC free article] [PubMed] [Google Scholar]
- 18.Lee JS, Chu IS, Heo J, Calvisi DF, Sun Z, Roskams T, et al. Classification and prediction of survival in hepatocellular carcinoma by gene expression profiling. Hepatology. 2004;40:667–76. doi: 10.1002/hep.20375. [DOI] [PubMed] [Google Scholar]
- 19.Lee JS, Chu IS, Mikaelyan A, Calvisi DF, Heo J, Reddy JK, et al. Application of comparative functional genomics to identify best-fit mouse models to study human cancer. Nat Genet. 2004;36:1306–11. doi: 10.1038/ng1481. [DOI] [PubMed] [Google Scholar]
- 20.Lee JS, Heo J, Libbrecht L, Chu IS, Kaposi-Novak P, Calvisi DF, et al. A novel prognostic subtype of human hepatocellular carcinoma derived from hepatic progenitor cells. Nat Med. 2006;12:410–6. doi: 10.1038/nm1377. [DOI] [PubMed] [Google Scholar]
- 21.Woo HG, Park ES, Cheon JH, Kim JH, Lee JS, Park BJ, et al. Gene expression-based recurrence prediction of hepatitis B virus-related human hepatocellular carcinoma. Clin Cancer Res. 2008;14:2056–64. doi: 10.1158/1078-0432.CCR-07-1473. [DOI] [PubMed] [Google Scholar]
- 22.Roessler S, Jia HL, Budhu A, Forgues M, Ye QH, Lee JS, et al. A unique metastasis gene signature enables prediction of tumor relapse in early-stage hepatocellular carcinoma patients. Cancer Res. 2010;70:10202–12. doi: 10.1158/0008-5472.CAN-10-2607. [DOI] [PMC free article] [PubMed] [Google Scholar]
- 23.Bolstad BM, Irizarry RA, Astrand M, Speed TP. A comparison of normalization methods for high density oligonucleotide array data based on variance and bias. Bioinformatics. 2003;19:185–93. doi: 10.1093/bioinformatics/19.2.185. [DOI] [PubMed] [Google Scholar]
- 24.Simon R, Lam A, Li M-C, Ngan M, Menenzes S, Zhao Y. Analysis of gene expression data using BRB-Array Tools. Cancer Inform. 2007;3:11–7. [PMC free article] [PubMed] [Google Scholar]
- 25.Wright GW, Simon RM. A random variance model for detection of differential gene expression in small microarray experiments. Bioinformatics. 2003;19:2448–55. doi: 10.1093/bioinformatics/btg345. [DOI] [PubMed] [Google Scholar]
- 26.Cox DR. Regression models with life tables. J Royal Statis Soc. 1972;34:187–220. [Google Scholar]
- 27.Kattan MW. Evaluating a new marker's predictive contribution. Clin Cancer Res. 2004;10:822–4. doi: 10.1158/1078-0432.ccr-03-0061. [DOI] [PubMed] [Google Scholar]
- 28.Kattan MW. Judging new markers by their ability to improve predictive accuracy. J Natl Cancer Inst. 2003;95:634–5. doi: 10.1093/jnci/95.9.634. [DOI] [PubMed] [Google Scholar]
- 29.Lee JS, Leem SH, Lee SY, Kim SC, Park ES, Kim SB, et al. Expression signature of E2F1 and its associated genes predict superficial to invasive progression of bladder tumors. J Clin Oncol. 2010;28:2660–7. doi: 10.1200/JCO.2009.25.0977. [DOI] [PubMed] [Google Scholar]
- 30.Radmacher MD, McShane LM, Simon R. A paradigm for class prediction using gene expression profiles. J Comput Biol. 2002;9:505–11. doi: 10.1089/106652702760138592. [DOI] [PubMed] [Google Scholar]
- 31.Oh SC, Park YY, Park ES, Lim JY, Kim SM, Kim SB, et al. Prognostic gene expression signature associated with two molecularly distinct subtypes of colorectal cancer. Gut. 2012;61:1291–8. doi: 10.1136/gutjnl-2011-300812. [DOI] [PMC free article] [PubMed] [Google Scholar]
- 32.Park YY, Kim K, Kim SB, Hennessy BT, Kim SM, Park ES, et al. Reconstruction of nuclear receptor network reveals that NR2E3 is a novel upstream regulator of ESR1 in breast cancer. EMBO Mol Med. 2012;4:52–67. doi: 10.1002/emmm.201100187. [DOI] [PMC free article] [PubMed] [Google Scholar]
- 33.Zhao B, Ye X, Yu J, Li L, Li W, Li S, et al. TEAD mediates YAP-dependent gene induction and growth control. Genes Dev. 2008;22:1962–71. doi: 10.1101/gad.1664408. [DOI] [PMC free article] [PubMed] [Google Scholar]
- 34.Kim SM, Leem SH, Chu IS, Park YY, Kim SC, Kim SB, et al. 65-gene-based risk score classifier predicts overall survival in hepatocellular carcinoma. Hepatology. 2011 doi: 10.1002/hep.24813. [DOI] [PMC free article] [PubMed] [Google Scholar]
- 35.Zoncu R, Efeyan A, Sabatini DM. mTOR: from growth signal integration to cancer, diabetes and ageing. Nat Rev Mol Cell Biol. 2011;12:21–35. doi: 10.1038/nrm3025. [DOI] [PMC free article] [PubMed] [Google Scholar]
- 36.Tumaneng K, Schlegelmilch K, Russell RC, Yimlamai D, Basnet H, Mahadevan N, et al. YAP mediates crosstalk between the Hippo and PI(3)K-TOR pathways by suppressing PTEN via miR-29. Nat Cell Biol. 2012;14:1322–9. doi: 10.1038/ncb2615. [DOI] [PMC free article] [PubMed] [Google Scholar]
- 37.Sims AH, Howell A, Howell SJ, Clarke RB. Origins of breast cancer subtypes and therapeutic implications. Nat Clin Pract Oncol. 2007;4:516–25. doi: 10.1038/ncponc0908. [DOI] [PubMed] [Google Scholar]
Associated Data
This section collects any data citations, data availability statements, or supplementary materials included in this article.