

Abstract
Background
The tumor stage, size, grade, and necrosis (SSIGN) score was originally defined using patients treated with radical nephrectomy (RN) between 1970 and 1998 for clear cell renal cell carcinoma (ccRCC), excluding patients treated with partial nephrectomy (PN).
Objective
To characterize the original SSIGN score cohort with longer follow-up and evaluate a contemporary series of patients treated with RN and PN.
Design, setting, and participants
Retrospective single-institution review of 3600 consecutive surgically treated ccRCC patients grouped into three cohorts: original RN, contemporary (1999–2010) RN, and contemporary PN.
Intervention
RN or PN.
Outcome measurements and statistical analysis
The association of the SSIGN score with risk of death from RCC was assessed using a Cox proportional hazards regression model, and predictive ability was summarized with a C-index.
Results and limitations
The SSIGN scores differed significantly between the original RN, contemporary RN, and contemporary PN cohorts (p < 0.001), with SSIGN ≥4 in 53.5%, 62.7%, and 4.7%, respectively (p < 0.001). The median durations of follow-up for these groups were 20.1, 9.2, and 7.6 yr, respectively. Each increase in the SSIGN score was predictive of death from RCC (hazard ratios [HRs]: 1.41 for original RN, 1.37 for contemporary RN, and 1.70 for contemporary PN; all p < 0.001). The C-indexes for these models were 0.82, 0.84, and 0.82 for original RN, contemporary RN, and contemporary PN, respectively. After accounting for an era-specific improvement in survival among RN patients (HR: 0.53 for contemporary vs original RN; p < 0.001), the SSIGN score remained predictive of death from RCC (HR: 1.40; p < 0.001).
Conclusions
The SSIGN score remains a useful prediction tool for patients undergoing RN with 20-yr follow-up. When applied to contemporary RN and PN patients, the score retained strong predictive ability. These results should assist in patient counseling and help guide surveillance for ccRCC patients treated with RN or PN.
Patient summary
We evaluated the validity of a previously described tool to predict survival following surgery in contemporary patients with kidney cancer. We found that this tool remains valid even when extended to patients significantly different than were initially used to create the tool.
Keywords: Partial nephrectomy, Prognosis, Radical nephrectomy, Renal cell carcinoma, Survival
1. Introduction
The tumor stage, size, grade, and necrosis (SSIGN) score was reported in 2002 based on patients treated with radical nephrectomy (RN) between 1970 and 1998 for clear cell renal cell carcinoma (ccRCC) [1]. It was developed due to the limited prognostic ability offered by the TNM staging system to predict death from renal cell carcinoma (RCC) following RN, specifically for ccRCC. As such, the SSIGN score incorporates several pathologic features (tumor size, grade, and presence of coagulative necrosis) beyond TNM stage that are predictive of survival following nephrectomy [2–4]. Since its original description, the SSIGN score has been externally validated [5–8], compared favorably with other prognostic models [5], been included in guidelines [9], and is now being utilized to stratify patients for therapeutic clinical trials and assess the role of biomarkers in predicting survival for RCC patients [10–15].
However, the original description and subsequent validations may not reflect current clinical practice. Important changes have influenced survival for RCC patients since the initial publication of the SSIGN score including significant stage migration [16] and the introduction of targeted agents for metastatic RCC [17]. In addition, the utilization of partial nephrectomy (PN) for localized RCC has dramatically increased in the past decade [18], a procedure excluded from the SSIGN score development. Finally, the original description of the SSIGN score, and the subsequent validations, lacks long-term follow-up data and an assessment of the competing risk of death from non-RCC causes.
Given the changes in the landscape of RCC management since the inception of the SSIGN score and its ongoing utilization in validating new biomarkers, we sought to reassess the originally described cohort to evaluate the SSIGN score with longer follow-up, investigate the competing risk of non-RCC death, and evaluate the predictive ability of the SSIGN score in contemporary patients managed with both RN and PN.
2. Materials and methods
2.1. Patient selection
Following institutional review board approval, we queried the Mayo Clinic Nephrectomy Registry to identify the 1801 patients treated with RN for sporadic unilateral ccRCC between 1970 and 1998 who were used to develop the Mayo Clinic SSIGN score [1]. Of these patients, 6 declined use of their medical records for research, leaving 1795 patients for analysis. We also identified 1038 patients treated with RN and 767 patients treated with PN for sporadic unilateral ccRCC between 1999 and 2010 to serve as contemporary RN and PN cohorts.
2.2. Clinicopathologic features
Clinical features assessed included age at surgery, sex, symptoms at diagnosis, smoking history, preoperative estimated glomerular filtration rate (eGFR; in ml/min per 1.73 m2), Eastern Cooperative Oncology Group (ECOG) performance status, Charlson Comorbidity Index (CCI) score, and body mass index (BMI; in kg/m2). Patients with a palpable flank or abdominal mass, discomfort, gross hematuria, acute onset varicocele, or constitutional symptoms (rash, sweats, weight loss, fatigue, early satiety, and/or anorexia) were considered symptomatic at presentation. All pathologic specimens were reviewed by one urologic pathologist (J.C.C.) blinded to patient outcome for identification of histologic subtype, tumor size, 2010 TNM classification [19], 2016 World Health Organization/International Society of Urological Pathology grade (identical to the nuclear grading system used for the Mayo Clinic Nephrectomy Registry and the development of the SSIGN score [1,20,21]), coagulative necrosis, and sarcomatoid differentiation. The original SSIGN score was developed using the 1997 TNM classification, which has since been updated [19]; all patients have been restaged to reflect the current system, and the SSIGN scores are reflective of this change (Supplementary Table 1). For example, patients with level 0 tumor thrombi were originally classified as pT3b in the 1997 system and are now classified as pT3a. Because 2 points are added to the SSIGN score for all pT3 tumors, this did not result in a change in the calculated SSIGN score. Similarly, 2 points are added to the SSIGN score for both pN1 and pN2 tumors from the 1997 system, which are now both classified as pN1 in the 2010 system [1].
2.3. Patient outcome
Vital status for patients in the Nephrectomy Registry is updated yearly, with the most current follow-up utilized for analysis. For patients who died within the previous year, the cause of death is determined by death certificate review. If patients visited our institution for metastatic RCC within 6 mo of death, they are considered to have died of RCC. If the death certificate does not support this conclusion, the medical history is reviewed by an attending urologist to determine cause of death, which may include verification with the patient’s local physician.
2.4. Statistical methods
Continuous features were summarized with medians and interquartile ranges (IQRs); categorical features were summarized with frequencies and percentages. Comparisons of features between patients in the original and contemporary RN cohorts and between patients in the contemporary RN and PN cohorts were evaluated using Wilcoxon rank sum and chi-square tests. Cancer-specific survival (CSS) was estimated using the Kaplan-Meier method, with duration of follow-up calculated from the date of surgery to the date of death or last follow-up. Associations of the SSIGN score with death from RCC were evaluated using univariable Cox proportional hazards regression models and summarized with hazard ratios (HRs) and 95% confidence intervals (CIs).
The predictive ability of the SSIGN score was summarized with a bootstrap-corrected C-index. Additional multivariable models assessed the effect of cohort assignment, M stage, and SSIGN score on outcome within the RN cohorts. A separate analysis accounting for the competing risk of non-RCC death was performed by calculating the adjusted cumulative incidence of death from RCC [22]. Proportional subdistribution models were used to assess associations of the SSIGN score with the adjusted cumulative incidence of death from RCC and were summarized with HRs and 95% CIs. Statistical analyses were performed using SAS v.9.3 (SAS Institute Inc., Cary, NC, USA) or R v.3.1.1 (R Foundation for Statistical Computing, Vienna, Austria). All tests were two sided with p values <0.05 considered significant.
3. Results
3.1. Cohort characterization
Table 1 summarizes the clinicopathologic features of the 3600 patients stratified by cohort. Comparing the original and contemporary RN cohorts, we found statistically significant differences in age, the presence of symptoms at diagnosis, eGFR, ECOG status, CCI, BMI, pT and pN classifications, tumor size, grade, and necrosis. Notably, SSIGN scores were significantly higher in the contemporary RN compared with the original cohort (median score 5 vs 4; p < 0.001).
Table 1.
Clinicopathologic features of patients in the original radical nephrectomy (RN), contemporary RN, and contemporary partial nephrectomy cohorts*
| Original RN n = 1795 | p value† | Contemporary RN n = 1038 | p value‡ | Contemporary PN n = 767 | |
|---|---|---|---|---|---|
| Feature | Median (IQR) or n (%) | ||||
| Age at surgery, yr | 63 (54–70) | 0.031 | 64 (55–72) | <0.001 | 60 (51–69) |
| Male gender | 1150 (64) | 0.21 | 689 (66) | 0.22 | 488 (64) |
| ECOG performance status (n = 1365, 1037, 765) | <0.001 | <0.001 | |||
| 0 | 1184 (87) | 820 (79) | 682 (89) | ||
| 1 | 141 (10) | 148 (14) | 56 (7) | ||
| ≥2 | 40 (3) | 69 (7) | 27 (4) | ||
| Charlson Comorbidity Index (n = 1362, 1038, 765)** | 1 (0–2) | <0.001 | 1 (0–3) | <0.001 | 1 (0–2) |
| BMI (n = 1244, 980, 735) | 27 (24–30) | <0.001 | 29 (25–33) | 0.002 | 30 (26–34) |
| eGFR (n = 1777, 1022, 753) | 65 (53–78) | <0.001 | 62 (51–74) | <0.001 | 72 (58–86) |
| Smoking history (n = 1744, 1026, 754) | 0.43 | 0.90 | |||
| Never | 734 (42) | 416 (41) | 308 (41) | ||
| Current/former | 1010 (58) | 610 (59) | 446 (59) | ||
| Symptoms (n = 1786, 1037, 766) | 1292 (72) | <0.001 | 633 (61) | <0.001 | 208 (27) |
| Constitutional symptoms (n = 1786, 1037, 766) | 600 (34) | <0.001 | 262 (25) | <0.001 | 49 (6) |
| pT stage | <0.001 | <0.001 | |||
| pT1a | 356 (20) | 136 (13) | 550 (72) | ||
| pT1b | 430 (24) | 209 (20) | 175 (23) | ||
| pT2a | 248 (14) | 123 (12) | 18 (2) | ||
| pT2b | 114 (6) | 56 (5) | 3 (<1) | ||
| pT3a | 480 (27) | 363 (35) | 21 (3) | ||
| pT3b | 136 (8) | 103 (10) | 0 | ||
| pT3c | 12 (1) | 16 (2) | 0 | ||
| pT4 | 19 (1) | 32 (3) | 0 | ||
| pN stage | <0.001 | <0.001 | |||
| pNX | 668 (37) | 552 (53) | 743 (97) | ||
| pN0 | 1028 (57) | 379 (37) | 24 (3) | ||
| pN1 | 99 (6) | 107 (10) | 0 | ||
| M stage | 0.12 | <0.001 | |||
| M0 | 1510 (84) | 850 (82) | 762 (99) | ||
| M1 | 285 (16) | 188 (18) | 5 (1) | ||
| Tumor size | <0.001 | <0.001 | |||
| <5 cm | 496 (28) | 217 (21) | 646 (84) | ||
| ≥5 cm | 1299 (72) | 821 (79) | 121 (16) | ||
| Grade | <0.001 | <0.001 | |||
| 1 | 182 (10) | 44 (4) | 114 (15) | ||
| 2 | 777 (43) | 278 (27) | 448 (58) | ||
| 3 | 676 (38) | 525 (51) | 193 (25) | ||
| 4 | 160 (9) | 191 (18) | 12 (2) | ||
| Coagulative tumor necrosis | 553 (31) | <0.001 | 439 (42) | <0.001 | 42 (5) |
| Sarcomatoid differentiation | 100 (6) | 0.93 | 57 (5) | <0.001 | 2 (<1) |
| SSIGN score | 4 (2–7) | <0.001 | 5 (3–9) | <0.001 | 0 (0–1) |
BMI = body mass index; ECOG = Eastern Cooperative Oncology Group; eGFR = estimated glomerular filtration rate; PN = partial nephrectomy; RN = radical nephrectomy; SSIGN = stage, size, grade, and necrosis.
Sample sizes for features with missing data for the three cohorts are indicated in italics in parentheses.
The p value represents the difference between the original RN and contemporary RN cohorts.
The p value represents the difference between the contemporary RN and PN cohorts.
Mean Charlson scores for the three groups were 1.8, 2.2, and 1.2, respectively.
When the contemporary RN and PN cohorts were compared, we found statistically significant differences in age, the presence of symptoms at diagnosis, eGFR, ECOG, CCI, BMI, the pT, pN, and M classifications, tumor size, grade, necrosis, and sarcomatoid differentiation. As anticipated, SSIGN scores were significantly higher in the contemporary RN compared with the PN cohort (median score 5 vs 0; p < 0.001).
3.2. Survival assessment by cohort
At last follow-up, 1571 patients in the original RN cohort had died including 802 who died from RCC. The median duration of follow-up for the 224 patients alive at last follow-up was 20.1 yr (IQR: 16.5–25.2). Each increase in SSIGN score was associated with an HR of 1.41 (95% CI, 1.38–1.44; p < 0.001) for death from RCC, with a bootstrap-corrected C-index of 0.82. After adjusting for the competing risk of non-RCC death, higher SSIGN scores remained predictive of death from RCC (HR: 1.37; 95% CI, 1.34–1.42; p < 0.001). Observed CSS rates and the competing risk adjusted rates as stratified by SSIGN score are summarized in Table 2, with observed estimates illustrated in Figure 1a.
Table 2.
Cancer-specific survival by stage, size, grade, and necrosis (SSIGN) score for patients in the original radical nephrectomy cohort: observed and competing risk adjusted rates
| Score | n† | Cancer-specific survival rates* | |||||
|---|---|---|---|---|---|---|---|
| Year 1 | Year 3 | Year 5 | Year 7 | Year 10 | Year 15 | ||
| 0–1 | 379 | 100; 100 (361) | 99; 99 (335) | 99; 99 (314) | 98; 98 (285) | 96; 97 (239) | 94; 95 (164) |
| 2 | 221 | 99; 99 (207) | 96; 96 (190) | 94; 95 (174) | 90; 91 (152) | 86; 88 (133) | 81; 85 (101) |
| 3 | 196 | 97; 97 (185) | 90; 91 (161) | 88; 89 (149) | 82; 84 (130) | 75; 78 (101) | 62; 70 (65) |
| 4 | 199 | 95; 95 (178) | 87; 87 (152) | 78; 80 (127) | 68; 72 (110) | 63; 68 (83) | 48; 58 (41) |
| 5 | 150 | 88; 89 (129) | 69; 70 (97) | 61; 62 (82) | 54; 56 (69) | 45; 49 (51) | 40; 46 (29) |
| 6 | 85 | 85; 85 (71) | 68; 68 (56) | 53; 54 (43) | 47; 48 (37) | 40; 42 (28) | 33; 36 (22) |
| 7 | 193 | 77; 78 (147) | 48; 50 (88) | 38; 40 (66) | 29; 32 (50) | 23; 27 (37) | 18; 23 (25) |
| 8 | 61 | 65; 66 (39) | 34; 36 (20) | 21; 23 (11) | 15; 18 (7) | 15; 18 (7) | 6; 10 (2) |
| 9 | 98 | 58; 58 (56) | 25; 27 (24) | 18; 19 (17) | 15; 16 (13) | 12; 14 (11) | 9; 11 (7) |
| ≥10 | 155 | 36; 37 (53) | 11; 13 (15) | 7; 10 (10) | 4; 7 (6) | 4; 7 (5) | 2; 6 (2) |
RCC = renal cell carcinoma.
Two rates are presented. The first is the cancer-specific survival rate estimated using the Kaplan-Meier method; the second is the rate after accounting for the competing risk of death from non-RCC causes. Number of patients at risk is denoted in parentheses.
Total = 1737; 58 patients excluded for unknown cause of death.
Fig. 1.

Estimated cancer-specific survival stratified by tumor stage, size, grade, and necrosis (SSIGN) score in (a) the original radical nephrectomy (RN) cohort, (b) the contemporary RN cohort, and (c) the contemporary partial nephrectomy (PN) cohort. Numbers at risk are denoted in Tables 2–4. Because 134 patients (17%) in the contemporary PN cohort had an SSIGN score of 1, scores of 0 and 1 were not combined for this cohort, as was done for the RN cohorts. Conversely, only 36 patients (5%) had a score between 4 and 13 and thus were combined.
Among patients in the contemporary RN cohort, 595 patients had died at the time of last follow-up including 373 who died from RCC. Median duration of follow-up for the 443 patients alive at last follow-up was 9.2 yr (IQR: 6.3–12.1). Each unit increase in SSIGN score was associated with a HR of 1.37 (95% CI, 1.33–1.40; p < 0.001) for predicting death from RCC, with a bootstrap-corrected C-index of 0.84. After adjusting for the competing risk of non-RCC death, higher SSIGN scores again remained predictive of death from RCC (HR: 1.35; 95% CI, 1.30–1.39; p < 0.001). Table 3 summarizes the observed CSS rates and the competing risk adjusted rates as stratified by SSIGN score, with observed estimates illustrated in Figure 1b.
Table 3.
Cancer-specific survival by stage, size, grade, and necrosis (SSIGN) score for patients in the contemporary radical nephrectomy cohort: observed and competing risk adjusted rates
| Score | n† | Cancer-specific survival rates* | |||||
|---|---|---|---|---|---|---|---|
| Year 1 | Year 3 | Year 5 | Year 7 | Year 10 | Year 15 | ||
| 0–1 | 161 | 100; 100 (157) | 100; 100 (147) | 99; 99 (127) | 99; 99 (104) | 97; 98 (65) | 97; 98 (10) |
| 2 | 86 | 100; 100 (81) | 99; 99 (72) | 97; 98 (65) | 97; 98 (57) | 97; 98 (33) | 90; 92 (4) |
| 3 | 129 | 100; 100 (125) | 99; 99 (114) | 98; 98 (101) | 97; 98 (76) | 89; 91 (42) | 89; 91 (10) |
| 4 | 80 | 99; 99 (78) | 92; 92 (66) | 88; 88 (53) | 84; 86 (44) | 80; 82 (26) | 71; 77 (3) |
| 5 | 102 | 97; 97 (97) | 86; 86 (80) | 74; 75 (61) | 68; 70 (38) | 59; 63 (20) | 49; 56 (3) |
| 6 | 39 | 92; 92 (34) | 76; 76 (28) | 70; 71 (23) | 70; 71 (18) | 50; 53 (8) | 40; 45 (1) |
| 7 | 127 | 87; 87 (108) | 62; 63 (72) | 51; 54 (52) | 46; 49 (31) | 45; 48 (20) | 21; 35 (1) |
| 8 | 14 | 79; 79 (10) | 35; 43 (4) | 27; 36 (3) | 18; 29 (2) | NA | NA |
| 9 | 108 | 78; 78 (81) | 46; 48 (45) | 35; 38 (29) | 29; 32 (18) | 20; 26 (5) | NA |
| ≥10 | 156 | 59; 59 (90) | 31; 32 (46) | 15; 16 (21) | 9; 11 (10) | 6; 8 (7) | NA |
NA = not applicable because no patients were left at risk; RCC = renal cell carcinoma.
Two rates are presented. The first is the cancer-specific survival rate estimated using the Kaplan-Meier method; the second is the rate after accounting for the competing risk of death from non-RCC causes. Number of patients at risk is denoted in parentheses.
Total = 1002; 36 patients excluded for unknown cause of death.
At last follow-up, 154 patients in the contemporary PN cohort had died including 30 who died from RCC. Median follow-up for the 613 patients alive at last follow-up was 7.6 yr (IQR: 5.5–10.1). Each unit increase in SSIGN score was associated with an HR of 1.70 (95% CI, 1.53–1.90; p < 0.001) for predicting death from RCC, with a bootstrap-corrected C-index of 0.82. Adjusting for the competing risk of non-RCC death, higher SSIGN scores remained predictive of death from RCC (HR: 1.70; 95% CI, 1.51–1.93; p < 0.001). Observed CSS rates and the competing risk adjusted rates as stratified by SSIGN score are summarized in Table 4 and illustrated in Figure 1c.
Table 4.
Cancer-specific survival by stage, size, grade, and necrosis (SSIGN) score for patients in the contemporary partial nephrectomy cohort: observed and competing risk-adjusted rates
| Score | n† | Cancer-specific survival rates* | |||||
|---|---|---|---|---|---|---|---|
| Year 1 | Year 3 | Year 5 | Year 7 | Year 10 | Year 15 | ||
| 0 | 472 | 99.8; 99.8 (453) | 99.8; 99.8 (431) | 99.5; 99.5 (358) | 99; 99 (258) | 99; 99 (130) | 98; 98 (8) |
| 1 | 131 | 100; 100 (124) | 99; 99 (118) | 97; 97 (102) | 96; 96 (67) | 96; 96 (25) | 96; 96 (2) |
| 2 | 68 | 100; 100 (64) | 98; 98 (61) | 98; 98 (46) | 98; 98 (24) | 98; 98 (11) | NA |
| 3 | 50 | 100; 100 (50) | 92; 92 (43) | 87; 88 (34) | 85; 85 (23) | 76; 78 (9) | 68; 70 (1) |
| 4+ | 35 | 94; 94 (31) | 85; 86 (27) | 75; 77 (21) | 69; 71 (10) | 69; 71 (5) | NA |
NA = Not applicable because no patients were left at risk; RCC = renal cell carcinoma.
Two rates are presented. The first is the cancer-specific survival rate estimated using the Kaplan-Meier method; the second is the rate after accounting for the competing risk of death from non-RCC causes. Number of patients at risk is denoted in parentheses.
Total = 756; 11 patients excluded for unknown cause of death.
3.3. Era of treatment and metastatic disease
We noted that survival within each SSIGN score was higher in patients managed in the contemporary RN cohort compared with the original RN cohort (Fig. 1a and 1b). In a multivariable setting, more recent era of treatment (1999–2010 compared with 1970–1998) was significantly associated with a reduced risk of death from RCC (HR: 0.53; 95% CI, 0.46–0.60; p < 0.001) even after adjusting for SSIGN score (HR: 1.40; 95% CI, 1.37–1.42; p < 0.001). When patients in the original and contemporary RN cohorts were stratified by the presence of metastatic disease (M0 vs M1), we noted that SSIGN score remained associated with the risk of death from RCC, although the HR for each unit increase in SSIGN was attenuated among M1 patients for each cohort. Finally, the reduction in risk of death from RCC among contemporary patients when controlling for SSIGN score remained evident when stratified by M stage (Supplementary Table 2). Figure 2 shows the associations of the SSIGN score with death from RCC among all cohorts and subgroups.
Fig. 2. Forest plot of hazard ratios (blue boxes) and 95% confidence intervals (blue lines) for the main analyses and as stratified by era of treatment and M stage.
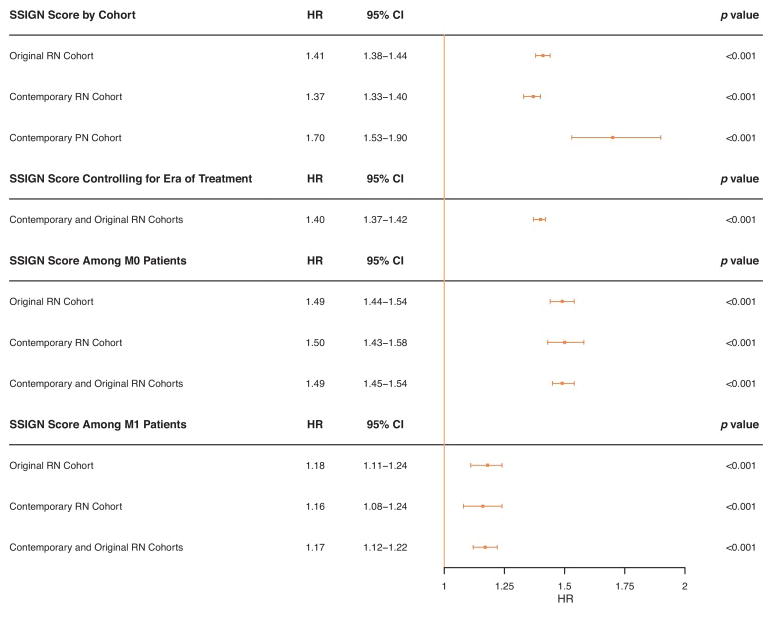
CI = confidence interval; HR = hazard ratio; PN = partial nephrectomy; RN = radical nephrectomy.
4. Discussion
We report an update of the SSIGN score using the original RN cohort with longer follow-up and in new cohorts of contemporarily managed patients treated with RN and PN. We found that the SSIGN score retained its predictive accuracy in the originally characterized patients with longer follow-up and after accounting for competing risks of non-RCC death. We also confirmed that despite significant differences in clinical features and an era-specific improvement in survival, that for contemporary ccRCC patients, the SSIGN score is a valid predictive tool for death from RCC.
Our results are similar to the prior experience with the SSIGN score. In the original description, the C-index assessing the ability of SSIGN score to predict death from RCC was 0.84, similar to the findings for all three cohorts described here despite differences in clinical features [1]. In addition, our findings confirm those of the subsequent validations of the SSIGN score [6–8]. Notably, the third and largest validation of the SSIGN score was performed using routine pathology and found similar findings as our results [8].
Although our findings are corroborated by prior validations, several important differences should be considered. First, the original cohort has matured such that 39% of patients were alive at 10 yr of follow-up compared with only 26% in the original description and 14.4–29.3% in the validation cohorts [6–8]. Second, we included a separate analysis of patients managed with PN, as opposed to considering them with RN patients, and confirmed the predictive capacity of the SSIGN score for these patients. Certainly the SSIGN score validation studies included nephron-sparing surgery; however, they represented the minority of cases, and the performance of the SSIGN score for those patients was not considered separately [6–8]. Our subset assessment of the SSIGN score in PN patients is underscored by the association of PN with superior survival in two validation studies [6,7]. Finally, we included an analysis of the competing risk of non-RCC death, which given the long postsurgical survival of most RCC patients is an important analysis that has to our knowledge not been reported. The results of these competing risk analyses modify the estimated CSS, adjusting for an overestimation of the risk of RCC death, and therefore may serve to improve patient counseling.
We found that after controlling for SSIGN score, survival was improved in the contemporary RN patients compared with the originally described cohort. Although there has been an established stage migration in RCC [16], which could explain any apparent survival improvement for all patients considered together, our finding of improved survival among contemporary patients when controlling for SSIGN score and among M0 and M1 patients suggests that stage migration alone may not explain this result. Our results may be partially explained by era of treatment, given the findings from Surveillance, Epidemiology, and End Results analyses, whereby treatment in the targeted-therapy era was independently associated with improved survival after controlling for stage [17,23]. Notably, when PROG scores [24] were assigned to the M0 original and contemporary RN patients, era of treatment was not associated with a reduced risk of metastasis during follow-up (Supplementary Table 2). Taken together with our finding that contemporary management was associated with a reduction in the risk of death from RCC among M0 patients after controlling for SSIGN, this would suggest that improvements in survival may be a function of patient treatment after developing metastatic disease.
As previously mentioned, the SSIGN score is increasingly being utilized to assess the effect of new biomarkers on survival in RCC. Hakimi and colleagues evaluated the effect of the MET rs11762213 single nucleotide polymorphism in 272 patients in The Cancer Genome Atlas, and after adjusting for SSIGN score, they found an increased risk of death from RCC [10]. In addition, BAP1, a deubiquitinating enzyme whose loss is associated with inferior CSS survival [25,26], was further characterized at our institution. Using the SSIGN score to adjust for clinical features, BAP1 was found only to be associated with inferior survival when restricted to lower risk patients (SSIGN score ≤3) [12]. Conversely, the BioScore, a composite of B7–H1, survivin, and Ki-67 expression, was found to be informative toward survival only in patients with intermediate and high SSIGN scores (>3) [27]. Together, these findings demonstrate that the SSIGN score is not only useful as a continuous adjustment, but also for revealing the complex interaction between biomarkers and the clinical features associated with survival. Therefore, the continued evaluation and validation of the SSIGN score is of utmost importance in assuring that these biomarker studies, and other ongoing research, retain their clinical significance.
Despite the findings reported by these biomarker studies, the predictive capacity of existing models such as SSIGN must be considered. Specifically, the SSIGN score is often grouped into three categories, which results in a loss of granularity as demonstrated by a reduction in the reported C-index for SSIGN alone, and thus an apparent incremental gain in the C-index when combined with new biomarkers [28,29], which may not exceed that of the SSIGN when used as described.
As previously outlined, we noted an era-specific improvement in survival. Despite this finding, the SSIGN score retained the predictive capacity for RCC-specific death with excellent discrimination (C-index 0.84 and 0.82 in contemporary RN and PN patients, respectively) as originally described and using the originally assigned point values. Taken together with our desire not to invalidate existing reports utilizing the SSIGN score and the excellent performance of the model as originally described, we did not attempt to incorporate new variables or adjust the assigned point values.
Certain limitations with this work warrant further discussion. First, these results are obtained from a retrospective review of our Nephrectomy Registry and are subject to the many inherent biases associated with this approach. Although outcomes in our registry are collected prospectively, it is likely that a small number of recurrences or RCC-related deaths were not captured. In addition, this investigation includes patients managed ≥40 yr ago, and significant advances have been made in imaging, perioperative care, and treatment options over time. However, all patients in this study had uniform pathologic review of their specimens, and we demonstrate utility of the SSIGN score in the subset of contemporary patients managed with both RN and PN. Further, to our knowledge, this work represents the largest single experience and longest follow-up of patients evaluated with the SSIGN score.
5. Conclusions
We found that the SSIGN score, as originally described and using the original patients, retains its predictive accuracy with longer follow-up and incorporating the competing risk of non-RCC death. We also noted among contemporarily managed patients, both with RN and PN, that the SSIGN score is a valuable prognostic tool for ccRCC. Finally, we observed improvements in survival for ccRCC patient over time, even after controlling for the SSIGN score. These findings support continued utilization of the SSIGN score and serve to guide patient counseling following surgical management of ccRCC.
Supplementary Material
Updated with longer follow-up and with new cohorts managed with radical or partial nephrectomy, the tumor stage, size, grade, and necrosis (SSIGN) score remains a validated prognostic tool to predict cancer-specific survival for patients with clear cell renal cell carcinoma.
Acknowledgments
Funding/Support and role of the sponsor: This publication was made possible in part by the Clinical and Translational Science Awards Grant UL1 TR000135 from the National Center for Advancing Translational Sciences, a component of the National Institutes of Health (NIH). Its contents are solely the responsibility of the authors and do not necessarily represent the official views of the NIH.
Footnotes
Author contributions: R. Houston Thompson had full access to all the data in the study and takes responsibility for the integrity of the data and the accuracy of the data analysis.
Study concept and design: Parker, Frank, Lohse, Thompson.
Acquisition of data: Lohse.
Analysis and interpretation of data: Parker, Lohse, Thompson.
Drafting of the manuscript: Parker, Lohse, Thompson.
Critical revision of the manuscript for important intellectual content: Parker, Cheville, Frank, Zaid, Lohse, Boorjian, Leibovich, Thompson.
Statistical analysis: Lohse.
Obtaining funding: None.
Administrative, technical, or material support: None.
Supervision: Thompson.
Other: None.
Financial disclosures: R. Houston Thompson certifies that all conflicts of interest, including specific financial interests and relationships and affiliations relevant to the subject matter or materials discussed in the manuscript (eg, employment/affiliation, grants or funding, consultancies, honoraria, stock ownership or options, expert testimony, royalties, or patents filed, received, or pending), are the following: None.
Publisher's Disclaimer: This is a PDF file of an unedited manuscript that has been accepted for publication. As a service to our customers we are providing this early version of the manuscript. The manuscript will undergo copyediting, typesetting, and review of the resulting proof before it is published in its final citable form. Please note that during the production process errors may be discovered which could affect the content, and all legal disclaimers that apply to the journal pertain.
References
- 1.Frank I, Blute ML, Cheville JC, Lohse CM, Weaver AL, Zincke H. An outcome prediction model for patients with clear cell renal cell carcinoma treated with radical nephrectomy based on tumor stage, size, grade and necrosis: the SSIGN score. J Urol. 2002;168:2395–400. doi: 10.1016/S0022-5347(05)64153-5. [DOI] [PubMed] [Google Scholar]
- 2.Lau WK, Cheville JC, Blute ML, Weaver AL, Zincke H. Prognostic features of pathologic stage T1 renal cell carcinoma after radical nephrectomy. Urology. 2002;59:532–7. doi: 10.1016/s0090-4295(01)01589-8. [DOI] [PubMed] [Google Scholar]
- 3.Sengupta S, Lohse CM, Leibovich BC, et al. Histologic coagulative tumor necrosis as a prognostic indicator of renal cell carcinoma aggressiveness. Cancer. 2005;104:511–20. doi: 10.1002/cncr.21206. [DOI] [PubMed] [Google Scholar]
- 4.Thompson RH, Leibovich BC, Lohse CM, et al. Dynamic outcome prediction in patients with clear cell renal cell carcinoma treated with radical nephrectomy: the D-SSIGN score. J Urol. 2007;177:477–80. doi: 10.1016/j.juro.2006.09.057. [DOI] [PubMed] [Google Scholar]
- 5.Ficarra V, Novara G, Galfano A, et al. The ‘Stage, Size, Grade and Necrosis’ score is more accurate than the University of California Los Angeles Integrated Staging System for predicting cancer-specific survival in patients with clear cell renal cell carcinoma. BJU Int. 2009;103:165–70. doi: 10.1111/j.1464-410X.2008.07901.x. [DOI] [PubMed] [Google Scholar]
- 6.Ficarra V, Martignoni G, Lohse C, et al. External validation of the Mayo Clinic Stage, Size, Grade and Necrosis (SSIGN) score to predict cancer specific survival using a European series of conventional renal cell carcinoma. J Urol. 2006;175:1235–9. doi: 10.1016/S0022-5347(05)00684-1. [DOI] [PubMed] [Google Scholar]
- 7.Fujii Y, Saito K, Iimura Y, et al. External validation of the Mayo Clinic cancer specific survival score in a Japanese series of clear cell renal cell carcinoma. J Urol. 2008;180:1290–5. doi: 10.1016/j.juro.2008.06.014. discussion 1295–6. [DOI] [PubMed] [Google Scholar]
- 8.Zigeuner R, Hutterer G, Chromecki T, et al. External validation of the Mayo Clinic stage, size, grade, and necrosis (SSIGN) score for clear-cell renal cell carcinoma in a single European centre applying routine pathology. Eur Urol. 2010;57:102–9. doi: 10.1016/j.eururo.2008.11.033. [DOI] [PubMed] [Google Scholar]
- 9.Escudier B, Porta C, Schmidinger M, et al. Renal cell carcinoma: ESMO Clinical Practice Guidelines for diagnosis, treatment and follow-up. Ann Oncol/ESMO. 2014;25(Suppl 3):iii49–56. doi: 10.1093/annonc/mdu259. [DOI] [PubMed] [Google Scholar]
- 10.Hakimi AA, Ostrovnaya I, Jacobsen A, et al. Validation and genomic interrogation of the MET variant rs11762213 as a predictor of adverse outcomes in clear cell renal cell carcinoma. Cancer. 2016;122:402–10. doi: 10.1002/cncr.29765. [DOI] [PMC free article] [PubMed] [Google Scholar]
- 11.Ho TH, Kapur P, Joseph RW, et al. Loss of histone H3 lysine 36 trimethylation is associated with an increased risk of renal cell carcinoma-specific death. Mod Pathol. 2016;29:34–42. doi: 10.1038/modpathol.2015.123. [DOI] [PMC free article] [PubMed] [Google Scholar]
- 12.Joseph RW, Kapur P, Serie DJ, et al. Loss of BAP1 protein expression is an independent marker of poor prognosis in patients with low-risk clear cell renal cell carcinoma. Cancer. 2014;120:1059–67. doi: 10.1002/cncr.28521. [DOI] [PMC free article] [PubMed] [Google Scholar]
- 13.Joseph RW, Kapur P, Serie DJ, et al. Clear cell renal cell carcinoma subtypes identified by BAP1 and PBRM1 expression. J Urol. 2016;195:180–7. doi: 10.1016/j.juro.2015.07.113. [DOI] [PMC free article] [PubMed] [Google Scholar]
- 14.Lucca I, de Martino M, Hofbauer SL, Zamani N, Shariat SF, Klatte T. Comparison of the prognostic value of pretreatment measurements of systemic inflammatory response in patients undergoing curative resection of clear cell renal cell carcinoma. World J Urol. 2015;33:2045–52. doi: 10.1007/s00345-015-1559-7. [DOI] [PubMed] [Google Scholar]
- 15.Parker AS, Eckel-Passow JE, Serie D, et al. Higher expression of topoisomerase II alpha is an independent marker of increased risk of cancer-specific death in patients with clear cell renal cell carcinoma. Eur Urol. 2014;66:929–35. doi: 10.1016/j.eururo.2013.12.017. [DOI] [PMC free article] [PubMed] [Google Scholar]
- 16.Kane CJ, Mallin K, Ritchey J, Cooperberg MR, Carroll PR. Renal cell cancer stage migration: analysis of the National Cancer Data Base. Cancer. 2008;113:78–83. doi: 10.1002/cncr.23518. [DOI] [PubMed] [Google Scholar]
- 17.Macleod LC, Tykodi SS, Holt SK, et al. Trends in metastatic kidney cancer survival from the cytokine to the targeted therapy era. Urology. 2015;86:262–8. doi: 10.1016/j.urology.2015.05.008. [DOI] [PubMed] [Google Scholar]
- 18.Schiffmann J, Bianchi M, Sun M, Becker A. Trends in surgical management of T1 renal cell carcinoma. Curr Urol Rep. 2014;15:383. doi: 10.1007/s11934-013-0383-0. [DOI] [PubMed] [Google Scholar]
- 19.Edge SB, Compton CC. The American Joint Committee on Cancer: the 7th edition of the AJCC cancer staging manual and the future of TNM. Ann Surg Oncol. 2010;17:1471–4. doi: 10.1245/s10434-010-0985-4. [DOI] [PubMed] [Google Scholar]
- 20.Delahunt B, Cheville JC, Martignoni G, et al. The International Society of Urological Pathology (ISUP) grading system for renal cell carcinoma and other prognostic parameters. Am J Surg Pathol. 2013;37:1490–504. doi: 10.1097/PAS.0b013e318299f0fb. [DOI] [PubMed] [Google Scholar]
- 21.Moch H, Cubilla AL, Humphrey PA, Reuter VE, Ulbright TM. The 2016 WHO Classification of Tumours of the Urinary System and Male Genital Organs part A: renal, penile, and testicular tumours. Eur Urol. doi: 10.1016/j.eururo.2016.02.029. In press http://dx.doi.org/10.1016/j.eururo.2016.02.029. [DOI] [PubMed]
- 22.Gooley TA, Leisenring W, Crowley J, Storer BE. Estimation of failure probabilities in the presence of competing risks: new representations of old estimators. Stat Med. 1999;18:695–706. doi: 10.1002/(sici)1097-0258(19990330)18:6<695::aid-sim60>3.0.co;2-o. [DOI] [PubMed] [Google Scholar]
- 23.Li P, Wong YN, Armstrong K, et al. Survival among patients with advanced renal cell carcinoma in the pretargeted versus targeted therapy eras. Cancer Med. 2016;5:169–81. doi: 10.1002/cam4.574. [DOI] [PMC free article] [PubMed] [Google Scholar]
- 24.Leibovich BC, Blute ML, Cheville JC, et al. Prediction of progression after radical nephrectomy for patients with clear cell renal cell carcinoma: a stratification tool for prospective clinical trials. Cancer. 2003;97:1663–71. doi: 10.1002/cncr.11234. [DOI] [PubMed] [Google Scholar]
- 25.Hakimi AA, Chen YB, Wren J, et al. Clinical and pathologic impact of select chromatin-modulating tumor suppressors in clear cell renal cell carcinoma. Eur Urol. 2013;63:848–54. doi: 10.1016/j.eururo.2012.09.005. [DOI] [PMC free article] [PubMed] [Google Scholar]
- 26.Kapur P, Pena-Llopis S, Christie A, et al. Effects on survival of BAP1 and PBRM1 mutations in sporadic clear-cell renal-cell carcinoma: a retrospective analysis with independent validation. Lancet Oncol. 2013;14:159–67. doi: 10.1016/S1470-2045(12)70584-3. [DOI] [PMC free article] [PubMed] [Google Scholar]
- 27.Parker AS, Leibovich BC, Lohse CM, et al. Development and evaluation of BioScore: a biomarker panel to enhance prognostic algorithms for clear cell renal cell carcinoma. Cancer. 2009;115:2092–103. doi: 10.1002/cncr.24263. [DOI] [PMC free article] [PubMed] [Google Scholar]
- 28.Liu Z, Liu Y, Xu L, et al. P2X7 receptor predicts postoperative cancer-specific survival of patients with clear-cell renal cell carcinoma. Cancer Sci. 2015;106:1224–31. doi: 10.1111/cas.12736. [DOI] [PMC free article] [PubMed] [Google Scholar]
- 29.Sim SH, Messenger MP, Gregory WM, et al. Prognostic utility of pre-operative circulating osteopontin, carbonic anhydrase IX and CRP in renal cell carcinoma. Br J Cancer. 2012;107:1131–7. doi: 10.1038/bjc.2012.360. [DOI] [PMC free article] [PubMed] [Google Scholar]
Associated Data
This section collects any data citations, data availability statements, or supplementary materials included in this article.