Abstract
Zika virus (ZIKV) is causing an unprecedented epidemic linked to severe congenital syndromes1,2. In July 2016, mosquito-borne ZIKV transmission was reported in the continental United States and since then, hundreds of locally-acquired infections have been reported in Florida3,4. To gain insights into the timing, source, and likely route(s) of ZIKV introduction, we tracked the virus from its first detection in Florida by sequencing ZIKV genomes from infected patients and Aedes aegypti mosquitoes. We show that at least four introductions, but potentially as many as 40, contributed to the outbreak in Florida and that local transmission likely started in the spring of 2016 - several months before initial detection. By analyzing surveillance and genetic data, we discovered that ZIKV moved among transmission zones in Miami. Our analyses show that most introductions are linked to the Caribbean, a finding corroborated by the high incidence rates and traffic volumes from the region into the Miami area. Our study provides an understanding of how ZIKV initiates transmission in new regions.
ZIKV transmission in the Americas was first reported in Brazil in May 20155, though the virus was likely introduced 1–2 years prior to its detection6–8. By January 2016, ZIKV cases were reported from several South and Central American countries and most islands in the Caribbean9. Like dengue virus (DENV) and chikungunya virus (CHIKV), ZIKV is vectored primarily by Aedes mosquitoes10–13. The establishment of the peridomestic species Ae. aegypti in the Americas14 has facilitated DENV, CHIKV, and now likely ZIKV to become endemic in this region15. In the continental United States, transient outbreaks of DENV and CHIKV have been reported in regions of Texas and Florida4,16–21 with abundant seasonal Ae. aegypti populations14,22.
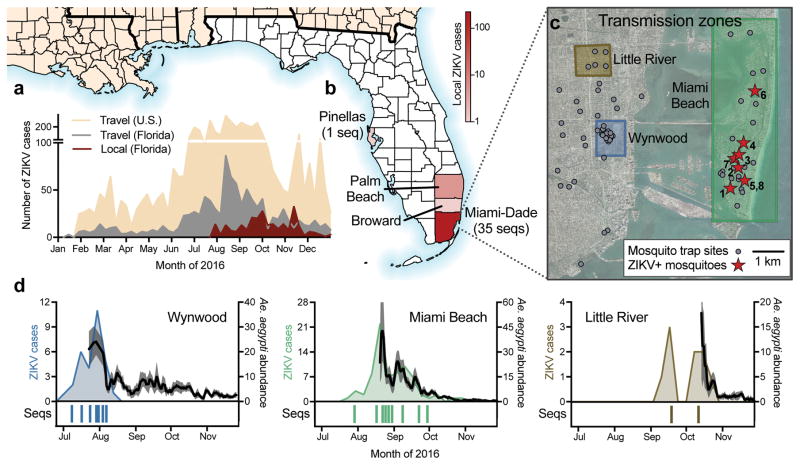
The 2016 ZIKV outbreak in Florida generated 256 confirmed ZIKV infections4 (Fig. 1a). While transmission was confirmed across four counties in Florida (Fig. 1b), the outbreak was most intense in Miami-Dade County (241 infections). Although the case location could not always be determined, at least 114 (47%) infections were likely acquired in one of three distinct transmission zones: Wynwood, Miami Beach, and Little River (Fig. 1c–d).
Figure 1. Zika virus outbreak in Florida.
(a) Weekly counts of confirmed travel-associated and locally-acquired ZIKV cases in 2016. (b) Four counties reported locally-acquired ZIKV cases in 2016: Miami-Dade (241), Broward (5), Palm Beach (8), Pinellas (1), and unknown origin (1). (c) The locations of mosquito traps and collected Ae. aegypti mosquitoes found to contain ZIKV RNA (ZIKV+) in relation to the transmission zones within Miami. (d) Temporal distribution of weekly ZIKV cases (left y-axis), sequenced cases (bottom), and Ae. aegypti abundance per trap night (right y-axis) associated with the three described transmission zones. ZIKV cases and sequences are plotted in relation to symptom onset dates (n=18). Sequenced cases without onset dates or that occurred outside of the transmission zones are not shown (n=10). Human cases and Ae. aegypti abundance per week were positively correlated (Spearman r = 0.61, Extended Data Fig. 1b). The maps were generated using open source basemaps34.
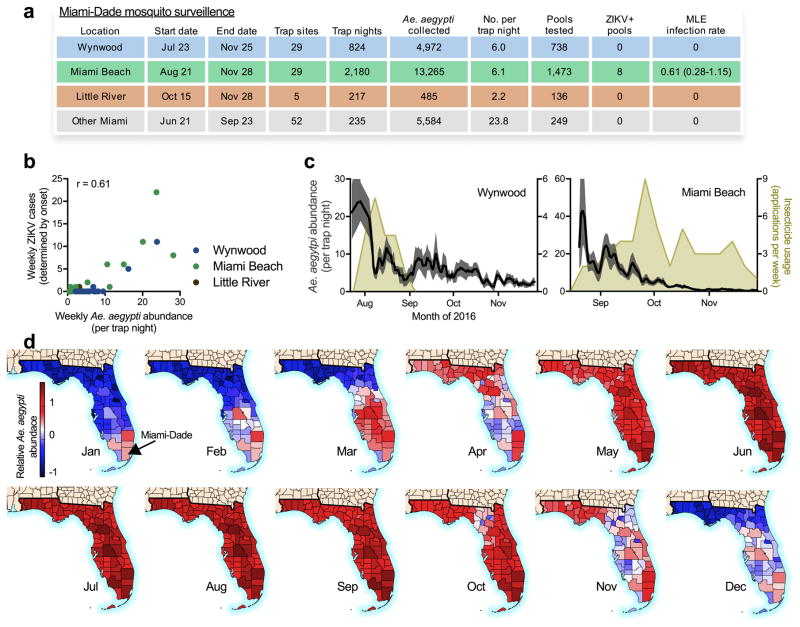
Using mosquito surveillance data, we determined the extent of mosquito-borne ZIKV transmission in Miami. Of the 24,351 mosquitoes collected from June to November 2016, 99.8% were Ae. aegypti and 8 pools of ≤ 50 mosquitoes tested positive for ZIKV (Fig. 1c, Extended Data Fig. 1). From these pools, we estimated that ~1 out of 1,600 Ae. aegypti mosquitoes were infected (0.061%, 95% CI: 0.028–0.115%, Extended Data Fig. 1a). This is similar to infection rates during DENV and CHIKV outbreaks23. Although we did not detect ZIKV-infected mosquitoes outside Miami Beach (Fig. 1c), we found that the number of human ZIKV cases correlated strongly with Ae. aegypti abundance within each transmission zone (Spearman r = 0.61, Fig. 1d, Extended Data Fig. 1b). This suggests that Ae. aegypti mosquitoes were the primary mode of transmission and that changes to vector abundance impacted human infection rates. We found that the application of insecticides3 suppressed mosquito populations during periods of intensive usage (Extended Data Fig. 1c), and therefore likely contributed to ZIKV clearance.
We sequenced 39 ZIKV genomes from clinical and mosquito samples without cell culture24 (Supplementary Table 1a). Our ZIKV dataset included 29 genomes from patients with locally-acquired infections (Fig. 1d) and 7 from Ae. aegypti pools (Fig. 1c). We also sequenced 3 ZIKV genomes from travel-associated cases from Florida. Our dataset included cases from all transmission zones in Miami (Fig. 1d) and represented ~11% of all confirmed locally-acquired cases in Florida. We made all sequence data openly available (PRJNA342539, PRJNA356429) immediately after data generation.
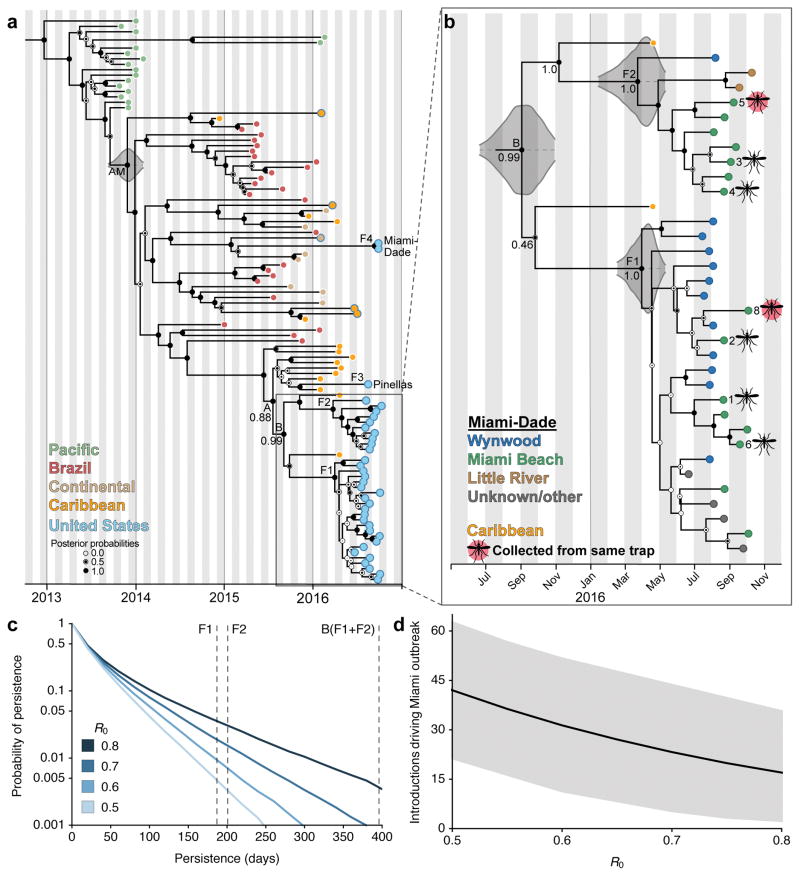
We reconstructed phylogenetic trees from our ZIKV genomes along with 65 published genomes from other affected regions (Fig. 2, Extended Data Fig. 2 and 3). We found that the Florida ZIKV genomes formed four distinct lineages (labeled F1–F4, Fig. 2a), three of which (F1–F3) belonged to the same clade (labeled A, Fig. 2a). We only sampled a single human case each from the F3 and F4 lineages, consistent with limited transmission (Fig. 2a). The other two Florida lineages (F1–F2) comprised ZIKV genomes from human and mosquito samples within Miami-Dade County (Fig. 2b).
Figure 2. Multiple introductions of Zika virus into Florida.
(a) Maximum clade credibility (MCC) tree of ZIKV genomes sequenced from outbreaks in the Pacific islands and the epidemic in the Americas. Tips are colored based on collection location. The five tips outlined in blue but filled with a different color indicate ZIKV cases in the United States associated with travel (fill color indicates the probable location of infection). Clade posterior probabilities are indicated by white circles filled with black relative to the level of support. The grey violin plot indicates the 95% highest posterior density (HPD) interval for the tMRCA for the epidemic in the Americas (AM). Lineage F4 contains two identical ZIKV genomes from the same patient. (b) A zoomed in version of the whole MCC tree showing the collection locations of Miami-Dade sequences and whether they were sequenced from mosquitoes (numbers correspond to trap locations in Fig. 1c). 95% HPD intervals are shown for the tMRCAs (c) The probability of ZIKV persistence after introduction for different R0. Persistence is measured as the number of days from initial introduction of viral lineages until their extinction. Vertical dashed lines show the inferred mean persistence time for lineages F1, F2 and B based on their tMRCA. (d) Total number of introductions (mean with 95% CI) that contributed to the outbreak of 241 local cases in Miami-Dade County for different R0.
Using time-structured phylogenies25, we estimated that at least four separate introductions were responsible for the locally-acquired cases observed in our dataset. The phylogenetic placement of lineage F4 clearly indicates that it resulted from an independent introduction of a lineage distinct from those in clade A (Fig. 2a). For the two well-supported nodes linking lineages F1–F2 (labeled B, Fig. 2a) and F1–F3 (A, Fig. 2a), we estimated the time of the most recent common ancestor (tMRCA) to be during the summer of 2015 (95% highest posterior density [HPD]: June–September, 2015). Our data displayed a strong clock signal (Extended Data Fig. 2b) and tMRCA estimates were robust across a range of models (Extended Data Table 1a). Thus while F1–F3 belong to clade A, any fewer than three distinct introductions leading to these lineages would have required undetected transmission of ZIKV in Florida for approximately one year (Fig. 2a).
To estimate the likelihood of a single ZIKV transmission chain persisting for over a year, we modeled spread under different assumptions of the basic reproductive number (R0). Using the number of locally-acquired and travel-associated cases, along with the number of observed genetic lineages, we estimated an R0 between 0.5 and 0.8 in Miami-Dade County (Extended Data Fig. 4). Even at the upper end of this range, the probability of a single transmission chain persisting for over a year is extremely low (~0.5%, Fig. 2c). This is especially true considering the low Ae. aegypti abundance during the winter months (Extended Data Fig. 1d).
Given the low probability of long-term persistence, we expect that our ZIKV genomes (F1–F4) were the result of at least four introductions. Differences in surveillance practices and a high number of travel-associated cases (Fig. 1a), however, likely mean that unsampled ZIKV introductions also contributed to the outbreak. To estimate the total number of ZIKV introductions, we modeled scenarios that resulted in 241 locally-acquired cases within Miami-Dade County, and found that with R0 values of 0.5–0.8, we expect 17–42 (95% CI 3–63) separate introductions to have contributed to the outbreak (Fig. 2d). The majority of these introductions would likely have generated a single secondary case that was undetected in our genetic sampling (Extended Data Fig. 4a). Incorporating under-reporting in a sensitivity analysis increases R0 estimates slightly to 0.7–0.9 (Extended Data Fig. 4f–i).
The two main ZIKV lineages, F1 and F2, included the majority of genomes from Florida (92%, Fig. 2a). Assuming they represent two independent introductions, we estimated when each of these lineages arrived in Florida. The probability densities for the tMRCAs of both F1 and F2 were centered around March–April, 2016 (Fig. 2b, 95% HPD: January–May, 2016). The estimated timing for these introductions corresponds with suitable Ae. aegypti populations in Miami-Dade County26 (Extended Data Fig. 1d) and suggests that ZIKV transmission could have started at least two months prior to its detection in July 2016 (Fig. 1a). The dates of the introductions could be more recent if multiple F1 or F2 lineage viruses arrived independently. However, more than 2 introductions would be necessary to substantially change our estimates for the timing of the earliest introduction.
To understand transmission dynamics within Miami, we analyzed our genomic data together with case data from the Florida Department of Health (DOH, Supplementary Table 1a). While spatially distinct, the three ZIKV transmission zones occurred within ~5 km of each other (Fig. 1c) and we found that the ZIKV infections associated with each zone overlapped temporally (Fig. 1d). Our ZIKV genomes with zone assignments all belonged to lineages F1 and F2, but neither of these lineages were confined to a single zone (Fig. 2b). In fact, we detected both F1 and F2 lineage viruses from Ae. aegypti collected from the same trap 26 days apart (mosquitoes 5 and 8, Fig. 2b). These findings suggest that ZIKV moved among areas of Miami.
Determining the sources and routes of ZIKV introductions could help mitigate future outbreaks. We found that lineages F1–F3 clustered with ZIKV genomes sequenced from the Dominican Republic and Guadeloupe (Fig. 2, Extended Data Fig. 2 and 3). In contrast, F4 clustered with genomes from Central America (Fig. 2, Extended Data Fig. 2 and 3). These findings suggest that while ZIKV outbreaks occurred throughout the Americas, the Caribbean islands were the main source of establishing local ZIKV transmission in Florida. Because of severe undersampling of ZIKV genomes, however, we cannot rule out other source areas. Similarly, even though we found that the Florida ZIKV genomes clustered together with sequences from the Dominican Republic, our results do not prove that ZIKV entered Florida from this country.
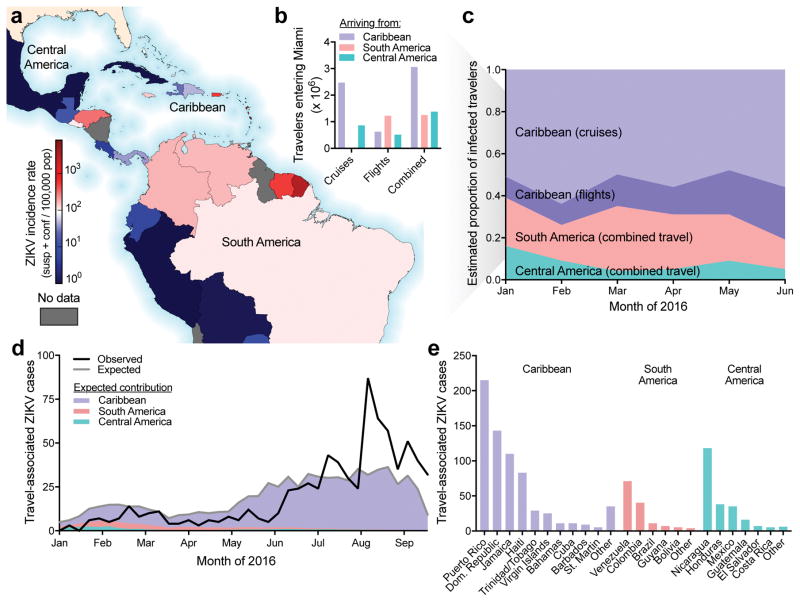
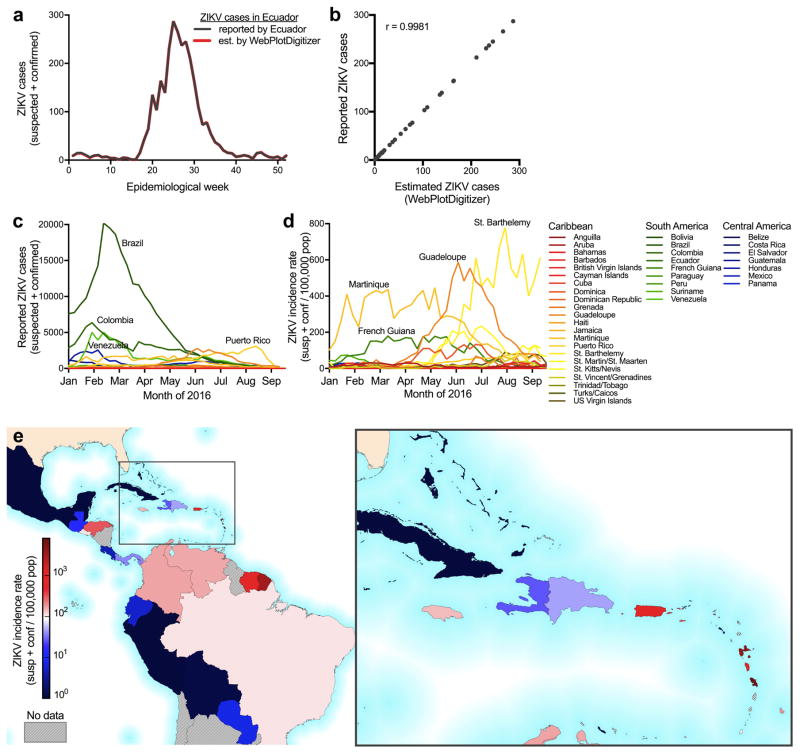
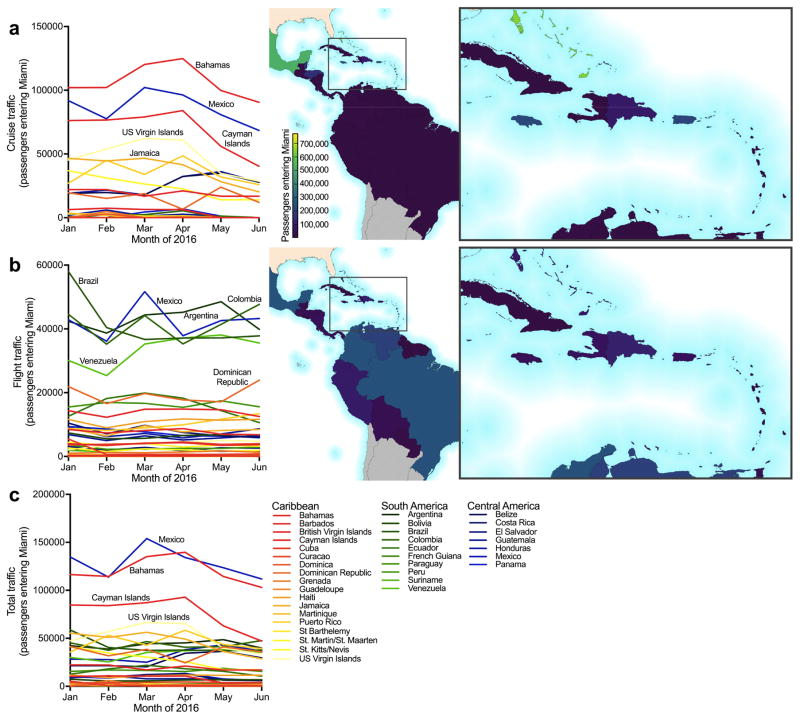
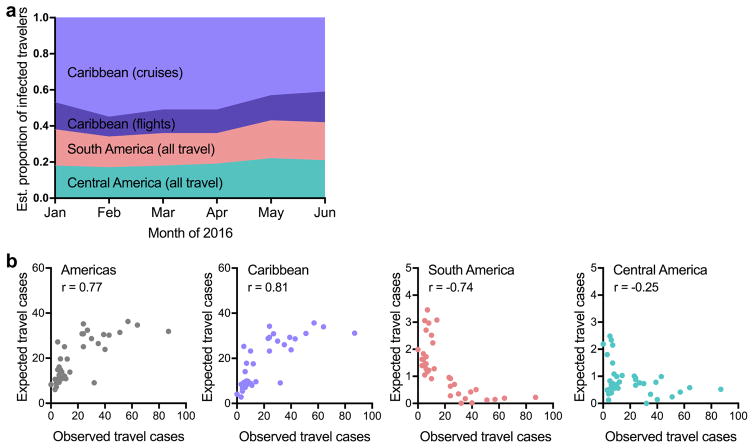
We investigated ZIKV infection rates and travel patterns to corroborate our phylogenetic evidence for Caribbean introductions. We found that the Caribbean islands bore the highest ZIKV incidence rates (Fig. 2b), despite Brazil and Colombia reporting the highest absolute number of cases (January to June, 2016, Fig. 3a, Extended Data Fig. 5, Supplementary Table 1b). During the same time period, we estimated that ~3 million travelers arrived from the Caribbean, accounting for 54% of the total traffic into Miami, with the vast majority (~2.4 million) arriving via cruise ships (Fig. 3b, Extended Data Fig. 6, Supplementary Table 1b). Combining the infection rates with travel capacities, we estimated that ~60–70% of ZIKV infected travelers arrived from the Caribbean (Fig. 3c and Extended Data Fig. 7a). We also found that the number of travel-associated ZIKV cases correlated strongly with the expected number of importations from the Caribbean (Spearman r = 0.8, Fig. 3d, Extended Data Fig. 7b). Finally, 67% of the travel-associated infections in Florida reported recent travel to the Caribbean (Fig. 3e); however, their mode of travel is unknown. Taken together, these findings suggest that a high incidence of ZIKV in the Caribbean, combined with frequent travel, could have played a key role in the establishment of ZIKV transmission in Florida. These findings, however, do not indicate that cruise ships themselves are risk factors for human ZIKV infection, but only that they served as a major mode of transportation from areas with active transmission. In addition, ZIKV exposure may vary among individuals depending on their purpose of travel and therefore we cannot determine the specific contribution of ZIKV-infected travelers arriving via airlines or cruise ships.
Figure 3. Frequent opportunities for Zika virus introductions into Miami from the Caribbean.
(a) Reported ZIKV cases per country/territory from January to June, 2016 normalized by total population. (b) The number of estimated travelers entering Miami during January to June, 2016 by method of travel. (c) The number of travelers and the reported ZIKV incidence rate for the country/territory of origin were used to estimate the proportion of infected travelers coming from each region with ZIKV in the Americas. (d) The observed number of weekly travel-associated ZIKV cases in Florida were plotted with the expected number of ZIKV-infected travelers (as estimated in panel c) coming from all of the Americas (grey line) and the regional contributions (colored areas). (e) The countries visited by the 1,016 travel-associated ZIKV cases diagnosed in Florida.
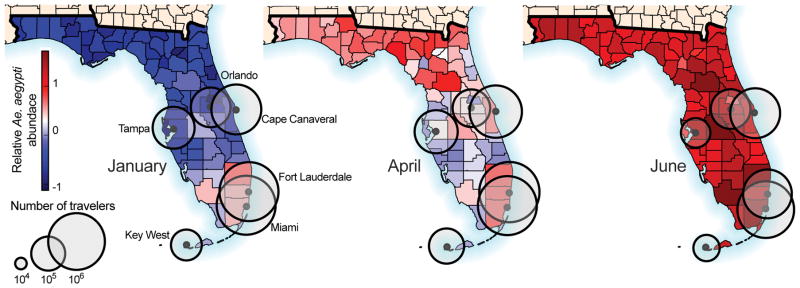
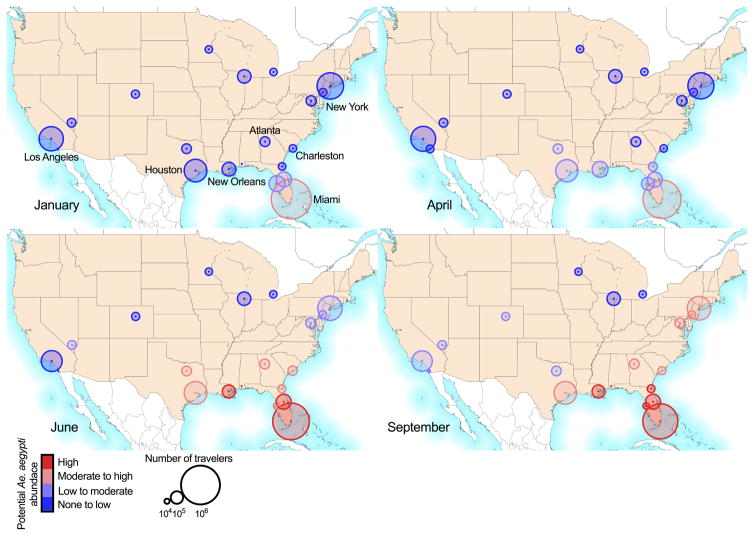
The majority of the Florida ZIKV outbreak occurred in Miami-Dade County (Fig. 1b). To determine if there is a higher potential for ZIKV outbreaks in this area, we analyzed incoming passenger traffic from regions with ZIKV transmission along with local Ae. aegypti abundance. We estimated that Miami and nearby Fort Lauderdale received ~72% of traffic (Fig. 4) and Miami received more air and sea traffic from ZIKV endemic areas than any other city in the United States (Extended Data Fig. 8). During January to April 2016, we estimated that Ae. aegypti abundance was highest in southern Florida22 (Fig. 4, Extended Data Fig. 1d, Extended Data Fig. 8). By June, most of Florida and several cities across the South likely supported high Ae. aegypti populations14,22 (Extended Data Fig. 8); however, most of this region has not reported local Ae. aegypti-borne virus transmission in at least 60 years19. In fact, the only region outside of Florida with local ZIKV transmission is southern Texas27, which is also the only other region with recent DENV outbreaks19–21. Therefore, the combination of travelers, mosquito ecology, and human population density likely make Miami one of the few places in the continental United States at risk for Ae. aegypti-borne virus outbreaks22,26,28.
Figure 4. Southern Florida has a high potential for Aedes aegypti-borne virus outbreaks.
The estimated number of travelers per month (circles) entering Florida cities via flights and cruise ships were plotted with estimated relative Ae. aegypti abundance. Only cities receiving >10,000 passengers per month are shown. Relative Ae. aegypti abundance for every month is shown in Extended Data Fig. 1d.
The extent of ZIKV transmission in Florida was unprecedented, with more reported ZIKV cases in 2016 (256) than DENV cases since 2009 (136)4,16,17. This case difference may be reflected by lower incidence of endemic DENV than epidemic ZIKV in source countries29,30, resulting in fewer DENV importations (reported travel cases since 2009: 654 DENV and 1,016 ZIKV)4. Given that the majority of ZIKV infections are asymptomatic2,31, the true number of ZIKV cases was likely much higher. Despite this, we estimated that the average R0 was less than 1 and therefore multiple introductions were necessary to give rise to the observed outbreak32. The high volume of traffic entering Florida from ZIKV-affected regions, especially the Caribbean, likely provided a substantial supply of ZIKV-infected individuals33. Because Florida is unlikely to sustain long-term ZIKV transmission32, the potential for future ZIKV outbreaks in this region is dependent upon activity elsewhere. Therefore, we expect that outbreaks in Florida will cycle with the ZIKV transmission dynamics in the Americas7,8,15.
Methods
Ethical statement
This work was evaluated and approved by relevant Institutional Review Boards (IRB)/Ethics Review Committees at The Scripps Research Institute (TSRI) and the US Army Medical Research Institute of Infectious Diseases (USAMRIID) Office of Human Use and Ethics. This work was conducted as part of the public health response in Florida and samples were collected under a waiver of consent granted by the Florida DOH Human Research Protection Program. The work received a non-human subjects research designation (category 4 exemption) by the Florida DOH since this research was performed with leftover clinical diagnostic samples involving no more than minimal risk. All samples were deidentified prior to receipt by the study investigators.
Florida Zika virus case data
Weekly reports of international travel-associated and locally-acquired ZIKV infections diagnosed in Florida were obtained from the Florida DOH mosquito-borne disease surveillance system4. Dates of symptom onset from the Miami transmission zones (Wynwood, Miami Beach, and Little River) determined by the Florida DOH investigation process were obtained from the ZIKV resource website35 and daily updates36. International travel-associated ZIKV case counts in the United States (outside of Florida) were obtained from the CDC37. The local and travel-associated ZIKV case numbers for Florida were obtained from the Florida DOH. The one local ZIKV infection diagnosed in Duval County was believed to have originated elsewhere in Florida. Therefore, this case is listed as “unknown origin” in Fig. 1b. In Fig. 3e, only the countries visited by 5 or more times by ZIKV-infected travelers diagnosed in Florida are shown. Countries with 5 or fewer visits were aggregated into an “other” category by region (i.e., Caribbean, South America, or Central America).
Clinical sample collection and RNA extraction
Clinical samples from locally-acquired ZIKV infections were collected from June 22 to October 11, 2016. The Florida DOH identified persons with compatible illness and clinical samples were shipped to the Bureau of Public Health Laboratories for confirmation by qRT-PCR and antibody tests following interim guidelines3,38–40. Clinical specimens (whole blood, serum, saliva, or urine) submitted for analysis were refrigerated or frozen at ≤ −70°C until RNA was extracted. RNA was extracted using the RNAeasy kit (QIAGEN), MagMAX for Microarrays Total RNA Isolation Kit (Ambion), or MagNA Pure LC 2.0 or 96 Systems (Roche Diagnostics). Purified RNA was eluted into 50–100 μL using the supplied elution buffers, immediately frozen at ≤ −70°C, and transported on dry ice. The Florida DOH also provided investigation data for these samples, including symptom onset dates and, when available, assignments to the zone where infection likely occurred (Supplementary Table 1).
Mosquito collection, RNA extraction, and entomological data analysis
24,351 Ae. aegypti and Ae. albopictus mosquitoes (sorted into 2,596 pools) were collected throughout Miami-Dade County during June to November, 2016 using BG-Sentinel mosquito traps (Biogents AG). Up to 50 mosquitoes of the same species and sex were pooled per trap. The pooled mosquitoes were stored in RNAlater (Invitrogen), RNA was extracted using either the RNAeasy kit (QIAGEN) or MagMAX for Microarrays Total RNA Isolation Kit (Ambion), and ZIKV RNA was detected by qRT-PCR targeting the envelope protein coding region40 or the Trioplex qRT-PCR kit41. ZIKV infection rates were calculated per 1,000 female Ae. aegypti mosquitoes using the bias-corrected maximum likelihood estimate (MLE)42. Days of insecticide usage by the Miami-Dade Mosquito Control were inferred from the zone-specific ZIKV activities timelines published by the Florida DOH35.
Relative monthly Ae. aegypti abundance
For the purpose of this study we used Ae. aegypti suitability maps from Kraemer et al.14 and derived monthly estimates based on the statistical relationships between mosquito presence and environmental correlates43. Following Hwang et al.44 we used a simple mathematical formula to transform the probability of detection maps into mosquito abundance maps. In order to do so, we assumed P (Y=1) where Y is a binary variable (presence/absence). Using a Poisson distribution X() to govern the abundance of mosquitoes, the probability of not observing any mosquitoes can be related to the probability of absence as: P(X=0)=P(Y=0). We used the following transformation to generate abundance (λ) estimates per county in Florida:
We did not consider Ae. albopictus abundance in this study because 99.8% of mosquitoes collected in Miami-Dade County were Ae. aegypti. Relative Ae. aegypti abundance in major U.S. cities presented in Extended Data Fig. 8 was estimated as previously described22.
Zika virus quantification
ZIKV genome equivalents (GE) were quantified by qRT-PCR. At TSRI, ZIKV qRT-PCR was performed as follows: ZIKV RNA standards were transcribed from the ZIKV NS5 region (8651–9498 nt) using the T7 forward primer (5′ - TAA TAC GAC TCA CTA TAG GGA GA TCA GGC TCC TGT CAA AAC CC - 3′), reverse primer (5′ - AGT GAC AAC TTG TCC GCT CC - 3′), and the T7 Megascript kit (Ambion). For qRT-PCR, primers and a probe targeting the NS5 region (9014–9123 nt) were designed using the ZIKV isolate PRVABC59 (GenBank: KU501215): forward primer (5′-AGT GCC AGA GCT GTG TGT AC - 3′), reverse primer (5′ - TCT AGC CCC TAG CCA CAT GT - 3′), and FAM-fluorescent probe (5′ - GGC AGC CGC GCC ATC TGG T - 3′). The qRT-PCR assays were performed in 25 μl reactions using the iScript One-step RT-PCR Kit for probes (Bio-Rad Laboratories Inc.) and 2 μl of sample RNA. Amplification was performed at 50°C for 20 min, 95°C for 3 min, and 40 cycles of 95°C for 10 s and 57°C for 10 s. Fluorescence was read at the end of the 57°C annealing-extension step. 10-fold dilutions of the ZIKV RNA transcripts (2 μl/reaction) were used to create a standard curve for quantification of ZIKV GE/μl of RNA. The lower limits of quantification are 4 GE/μl RNA, or at a cycle threshold of ~36.
ZIKV GE were quantified at USAMRIID using the University of Bonn ZIKV envelope protein (Bonn E) qRT-PCR assay45. RNA standards were transcribed using an amplicon generated from a ZIKV plasmid containing T7 promoter at the start of the 5′ untranslated region (UTR). The plasmid was designed using the ZIKV isolate BeH819015 (GenBank: KU365778.1) and the amplicon included nts 1–4348, which covers the 5′ UTR, C, prM, M, E, NS1, and NS2 regions. The qRT-PCR assays were performed in 25 μl reactions using the SuperScript III platinum One-step qRT-PCR Kit (ThermoFisher) and 2 μl of sample RNA was used. Amplification was performed following conditions as previously described45. 10-fold dilutions of the ZIKV RNA transcripts (5 μl/reaction) were used to create a standard curve for quantification of ZIKV GE/μl of RNA.
Amplicon-based Zika virus sequencing
ZIKV sequencing at TSRI was performed using an amplicon-based approach using the ZikaAsian V1 scheme, as described24. This approach is similar to “RNA jackhammering” to sequence low-quality viral samples developed by Worobey et al.46. Briefly, cDNA was reverse transcribed from 5 μl of RNA using SuperScript IV (Invitrogen). ZIKV cDNA (2.5 μl/reaction) was amplified in 35 × 400 bp fragments from two multiplexed PCR reactions using Q5 DNA High-fidelity Polymerase (New England Biolabs). The amplified ZIKV cDNA fragments (50 ng) were prepared for sequencing using the Kapa Hyper prep kit (Kapa Biosystems) and SureSelect XT2 indexes (Agilent). Agencourt AMPure XP beads (Beckman Coulter) were used for all purification steps. Paired-end 251 nt reads were generated on the MiSeq using the V2 500 cycle or V3 600 cycle kits (Illumina).
Trimmomatic was used to remove primer sequences (first 22 nt from the 5′ end of the reads, which is the maximum length of the primers used for the multiplexed PCR) and bases at both ends with Phred quality score < 2047. The reads were then aligned to the complete genome of a ZIKV isolate from the Dominican Republic, 2016 (GenBank: KU853012) using Novoalign v3.04.04 (www.novocraft.com). Samtools was used to sort the aligned BAM files and to generate alignment statistics48. Snakemake was used as the workflow management system49. The code and reference indexes for the pipeline can be found at https://github.com/andersen-lab/zika-pipeline. ZIKV-aligned reads were visually inspected using Geneious v9.1.550 before generating consensus sequences. A minimum of 3× read-depth coverage, in support of the consensus, was required to make a base call.
Enrichment-based Zika virus sequencing
ZIKV sequencing at USAMRIID was performed using a targeted enrichment approach. Sequencing libraries were prepared using the TruSeq RNA Access Library Prep kit (Illumina) with custom ZIKV probes. The set included 866 unique probes each of which was 80 nt in length (Supplementary Table 2a). The probes were designed to cover the entire ZIKV genome and to encompass the genetic diversity present on GenBank on January 14, 2016. In total, 26 ZIKV sequences were used during probe design (Supplementary Table 2b). Extracted RNA was fragmented at 94 °C for 0–60 s and each sample was enriched separately using a quarter of the reagents specified in the manufacturer’s protocol. Samples were barcoded, pooled and sequenced using the MiSeq Reagent kit v3 (Illumina) on an Illumina MiSeq with a minimum of 2 × 151 bp reads. Dual indexing, with no overlapping indices, was used.
The random hexamer associated with read one and the Illumina adaptors were removed from the sequencing reads using Cutadapt v1.9.dev151, and low-quality reads/bases were filtered using Prinseq-lite v0.20.352. Reads were aligned to a reference genome (GenBank: KX197192.1) using Bowtie2 v2.0.653, duplicates were removed with Picard (http://broadinstitute.github.io/picard), and a new consensus was generated using a combination of Samtools v0.1.1848 and custom scripts (https://github.com/jtladner/Scripts/blob/master/reference-based_assembly/consensus_fasta.py). Only bases with Phred quality score ≥ 20 were utilized in consensus calling, and a minimum of 3× read-depth coverage, in support of the consensus, was required to make a call; positions lacking this depth of coverage were treated as missing (i.e. called as “N”).
Validation and comparison of sequencing methods
The consensus ZIKV sequences from FL01M and FL03M generated by sequencing 35 × 400 bp amplicons on the MiSeq were validated using the following approaches: 1) sequencing the 35 × 400 bp amplicons on the Ion S5 platform (ThermoFisher), 2) sequencing amplicons generated using an Ion AmpliSeq® (ThermoFisher) panel customly targeted towards ZIKV on the Ion S5 platform, and 3) sequencing 5 × 2,150–2,400 bp ZIKV amplicons on the MiSeq. For Ion library preparation, cDNA was synthesized using the SuperScript VILO kit (ThermoFisher). ThermoFisher designed 875 custom ZIKV primers to produce 75 amplicons of ~200 bp in two PCR reactions for use with their Ion AmpliSeq Library Kit 2.0. The reagent FuPa was used to digest the modified primer sequences after amplification. The DNA templates were loaded onto Ion 520 chips using the Ion Chef and sequenced on the Ion S5 with the 200 bp output (ThermoFisher). The 35 × 400 bp amplicons generated for the MiSeq as described above were introduced into the Ion workflow using the Ion AmpliSeq Library Kit 2.0, but without fragmentation. Primers to amplify 2,150–2,400 bp ZIKV fragments (Supplementary Table 2c) were kindly provided by Shelby O’Connor, Dawn Dudly, Dave O’Connor, and Dane Gellerup (AIDS Vaccine Research Laboratory, University of Wisconsin, Madison). Each fragment was amplified individually by PCR using the cDNA generated above, Q5 DNA High-fidelity Polymerase, and the following thermocycle conditions: 55 °C for 30 m, 94 °C for 2 m, 35 cycles of 94 °C for 15 s, 56 °C for 30 s, and 68 °C for 3.5 m, 68 °C for 10 m, and held at 4 °C until use. Each PCR product was purified using Agencourt AMPure XP beads, sheared to 300 to 400 nt fragments using the Covaris S2 sonicator, indexed and prepared for sequencing as described above, and sequenced using the MiSeq V2 500 cycle kit (paired-end 251 nt reads). Compared to the consensus sequences generated using 35 × 400 bp amplicons on the MiSeq, there were no consensus-level mismatches in the coding sequence using any of the other three approaches (Extended Data Table 2). There were, however, some mismatches in the 5′ and 3′ UTRs (where the genomic RNA is heavily structured), likely a result of PCR bias and decreased coverage depth.
At least 95% of the ZIKV genome was covered from samples with as low as 4 and 9 GE/μl RNA from the amplicon and enrichment approaches, respectively. These results are similar to our previously determined clinical range of 10–16 ZIKV GE/μl RNA to achieve at least 95% genome coverage using our amplicon-based approach24. On average, the amplicon-based sequencing approach covered 97% of the ZIKV genome (≥3× read-depth) and the targeted enrichment approach covered 82% of the ZIKV genome from clinical samples (Supplementary Table 2d).
Phylogenetic analyses
All published and available complete ZIKV genomes of the Asian genotype from the Pacific and the Americas were retrieved from GenBank public database as of December 2016. Public sequences (n=65) were codon-aligned together with ZIKV genomes generated in this study (n=39) using MAFFT54 and inspected manually. The multiple alignment contained 104 ZIKV sequences collected between 2013 and 2016, from the Pacific (American Samoa, French Polynesia, and Tonga), Brazil, other South and Central Americas (Guatemala, Mexico, Suriname, and Venezuela), the Caribbean (Dominican Republic, Guadeloupe, Haiti, Martinique, and Puerto Rico), and the United States (Supplementary File 1).
In order to determine the temporal signal of the sequence dataset, a maximum likelihood (ML) phylogeny was first reconstructed with PhyML55 using the general time-reversible (GTR) nucleotide substitution model and gamma distributed rates amongst sites56 (Supplementary File 1), which was identified as the best fitting model for ML inference by jModelTest257. Then, a correlation between root-to-tip genetic divergence and date of sampling was conducted in TempEst58.
Bayesian phylogenetic analyses were performed using BEAST v.1.8.425 to infer time-structured phylogenies. We used an SDR06 nucleotide substitution model59 with a non-informative continuous time Markov chain reference prior (CTMC)60 on the molecular clock rate. Replicate analyses using multiple combinations of molecular clock and coalescent models were explored to select the best fitting model by marginal likelihood comparison using path-sampling and stepping-stone estimation approaches61–63 (Extended Data Table 1b). The best fit model was a relaxed molecular clock along with a Bayesian Skyline model64. All the Bayesian analyses were run for 30 million Markov chain Monte Carlo steps, sampling parameters and trees every 3000 generations (BEAST XML file and MCC tree available in Supplementary File 1). Support values for all nodes are embedded in the phylogenetic tree files (Supplementary File 1). Tree visualizations were generated with baltic (github.com/blab/baltic).
The travel-associated ZIKV genomes add to the Caribbean dataset, but do not directly influence our conclusions about the source of ZIKV introductions into Florida.
Expected number and distribution of local cases from Zika virus importations
We used branching process theory65,66 to generate the offspring distribution (subsequent local cases) that is expected from a single introduction. The offspring distribution L is modelled with a negative binomial distribution with mean R0 and over-dispersion parameter k. The total number of cases j that is caused by a single importation (including the index case) after an infinite time67 has the following form:
The parameter k represents the variation in the number of secondary cases generated by each case of ZIKV65. In the case of vector borne diseases, local heterogeneity is high due to a variety of factors such as mosquito population abundance, human to mosquito interaction, and control interventions68–73. Here, we assumed high heterogeneity (k=0.1) following previous estimates for vector borne diseases66. This distribution L is plotted in Extended Data Fig. 4a. For the following, we took a forward simulation approach, drawing random samples from this distribution. All estimates were based on 100,000 random simulations.
We used this formula to estimate the probability of observing 241 local cases in Miami-Dade County alongside 320 travel-associated cases. We approached this by sampling 320 introduction events from L and calculating the total number of local cases in the resulting outbreak (Extended Data Fig. 4b). We also calculated the likelihood of observing 241 local cases in the total outbreak (Extended Data Fig. 4c), finding that the MLE of R0 lies between 0.35 and 0.55. As a sensitivity analysis, we additionally modelled introductions with the assumption that only 50% of travelers were infectious at time of arrival into Miami-Dade County, resulting in an MLE of R0 of 0.45–0.8.
We further used this formula to address the probability of observing 3 distinct genetic clusters (F1, F2 and F3) representing 3 introduction events in a sample of 27 ZIKV genomes from Miami-Dade County. We approached this by sampling introduction events until we accumulated 241 local cases according to L, arriving at N introduction events with case counts (j1, j2, … jN). We then sampled 27 cases without replacement from (j1, j2, … jN) following a hypergeometric distribution and recorded the number of distinct clusters drawn in the sample. We found that higher values of R0 resulted in fewer distinct clusters within the sample of 27 genomes (Extended Data Fig. 4d). We additionally calculated the likelihood of sampling 3 distinct genetic clusters in 27 genomes (Extended Data Fig. 4e), finding an MLE estimate of R0 of 0.7–0.9. Additionally, as a sensitivity analysis we modelled a preferential sampling process in which larger clusters are more likely to be drawn from than smaller clusters. Here, we used a parameter α that enriches the hypergeometric distribution following (j1α, j2α, … jNα). In this case, we found an MLE estimate of R0 of 0.5–0.9.
Using the overlap of estimates of R0 from local case counts (0.35–0.8) and genetic clusters (0.5–0.9), we arrived at a 95% uncertainty range of R0 of 0.5–0.8. As an additional sensitivity analysis, we incorporated under-reporting in which either 50% of travel-associated cases and 25% of local cases are reported or in which 10% of travel-associated cases and 5% of local cases are reported. We find differential reporting of travel and local cases results in increased mean R0 estimates when comparing counts of travel-associated to local cases (Extended Data Figure 4f–g). Additionally, we find that under-reporting increases estimates of R0 from the sampling analysis (Extended Data Figure 4h–i). Thus, moderate under-reporting is consistent with R0 estimates of ~0.8.
We additionally perform birth-death stochastic simulations assuming a serial interval with mean 20 days15. We record the number of stochastic simulations still persisting after a particular number of days for different values of R0 (Fig. 2c).
Zika virus incidence rates
Weekly suspected and confirmed ZIKV case counts from countries and territories within the Americas with local transmission (January 1 to September 18, 2016) were obtained from the Pan American Health Organization (PAHO)30. In most cases, the weekly case numbers per country were only reported in bar graphs. We contacted PAHO multiple times with the hope of gaining access to the raw data included in the bar graphs, but our requests were unfortunately denied. Therefore we used WebPlotDigitizer v3.10 (http://arohatgi.info/WebPlotDigitizer) to estimate the numbers. We compared the actual ZIKV case numbers reported in Ecuador74 (only country with available raw data and reported cases > 10 per week) to our estimates from the PAHO bar graphs and found that the WebPlotDigitizer was ~99% accurate (Extended Data Fig. 5a–b).
Country and territory total population sizes to calculate weekly and monthly ZIKV incidence rates were also obtained from PAHO75. Incidence rates calculated from countries and territories in the Americas during January to June, 2016 (based on the earliest introduction time estimates until the first known cases) were used as an estimate for infection likelihood to investigate sources of ZIKV introductions.
Airline and cruise ship traffic
To investigate whether the transmission of ZIKV in Florida coincides with travel patterns from ZIKV endemic regions, we obtained the number of passengers arriving at airports in Florida via commercial air travel. We collated flight data from countries and territories in the Americas with local ZIKV transmission between January and June, 2016 (based on the earliest introduction time estimates until the first known cases, Supplementary Table 1b), arriving at all commercial airports in Florida. The data were obtained from the International Air Transportation Association, which collects data on an estimated 90% of all passenger trips worldwide. Nelson et al.28 previously reported flight data from 33 countries with ZIKV transmission entering major United States airports during October 2014 through September 2015, which we used to assess the potential for ZIKV introductions outside of Florida.
Schedules for cruise ships visiting Miami, Port Canaveral, Port Everglades, Fort Lauderdale, Key West, Jacksonville (all in Florida), Houston, Galveston (both in Texas), Charleston (South Carolina) and New Orleans (Louisiana) ports in the year 2016 were collated from www.cruisett.com and confirmed by cross-referencing ship logs reported by Port of Miami and reported ship schedules from www.miamidade.gov/portmiami/. Scheduled cruise ship capacities were extracted from www.cruisemapper.com. Every country/territory with ZIKV transmission visited by a cruise ship 10 days (the approximate mean time to ZIKV clearance in human blood [i.e., the infectious period])76 prior to arrival was counted as contributing the ship’s capacity worth of passengers to Miami to the month of arrival (Supplementary Table 1b). While the air traffic was based on the reported number of travelers, we estimated the sea traffic by ship capacity. Lee and Ramdeen77 reported that the average occupancy of cruise ships traveling to the Caribbean Islands exceeded 100% in 2011, and according to the Florida-Caribbean Cruise Association78, it remained >100% in 2015. Occupancy data for 2016 was not available at the time of publication, but we assumed that it was also near 100%.
Expected number of travelers infected with Zika virus
We estimated the expected number of travelers entering Miami who were infected with ZIKV (λ) by using the total travel capacity (C) and the likelihood of ZIKV infection (infections (I) per person (N)) from each country/territory (i):
We summed the number of expected infected travelers from each country/territory with ZIKV transmission by region and travel method (flights or cruises). The number of ZIKV cases reported by each country are likely under-estimates in part because the majority of ZIKV infections are asymptomatic2,31. We normalized some of the potential reporting variances between countries by reporting the data as the relative proportion of infected travelers (Fig. 3c, Extended Data Fig. 7a) and as the absolute number of infected travelers (Fig. 3d, Extended Data Fig. 7b, Supplementary Table 1b) from each region. We also accounted for potential reporting biases with incidence rates by using ZIKV attack rates (i.e., proportion infected before epidemic burnout) to estimate peak transmission intensity. Attack rates were calculated using a susceptible–infected–recovered (SIR) transmission model derived from seroprevalence studies and environmental factors as described79. Using attack rates as an estimate of infection likelihood, we predict that ~60% of the infected travelers entering Miami came from the Caribbean (Extended Data 7b), which is in agreement with our methods using incidence rates of ~60–70% (Fig. 3c). A list of countries and territories used in these analyses can be found in Supplementary Table 1b.
Maps
The maps presented in our figures were generated using Matplotlib80 and ESRI basemaps (www.esri.com/data/basemaps). The software and basemaps are open source and “freely available to anyone”.
Data availability
All ZIKV sequencing data is available under the NCBI BioProjects PRJNA342539 and PRJNA356429. Individual sample GenBank access numbers are listed in Supplementary Table 1a. All other data is available in the Extended Data, Supplemental Information, or upon request.
Extended Data
Extended Data Fig. 1. Miami-Dade mosquito surveillance and relative Aedes aegypti abundance.
(a) Mosquito surveillance data reported from June 21 to November 28, 2016 was used to evaluate the risk of ZIKV infection from mosquito-borne transmission in Miami. A total of 24,306 Ae. aegypti and 45 Ae. albopictus were collected. Trap nights are the total number of times each trap site was used and the trap locations are shown in Fig. 1d (some “Other Miami” trap sites are located outside of mapped region). Up to 50 mosquitoes of the same species and trap night were pooled together for ZIKV RNA testing. The infection rates were calculated using a maximum likelihood estimate (MLE). None of the Ae. albopictus pools contained ZIKV RNA. (b) The number of weekly ZIKV cases (based on symptoms onset) was correlated with mean Ae. aegypti abundance per trap night determined from the same week and zone (Spearman r = 0.61). This suggests that when the virus is present, mosquito abundance numbers alone could be used to target control efforts. (c) Insecticide usage, including truck and aerial adulticides and larvacides, by the Miami-Dade Mosquito Control in Wynwood (left) and Miami Beach (right) was overlaid with Ae. aegypti abundance per trap night to demonstrate that intense usage of insecticides may have helped to reduce local mosquito populations. (d) Relative Ae. aegypti abundance for each Florida county and month was estimated using a multivariate regression model, demonstrating spatial and temporal heterogeneity for the risk of ZIKV infection.
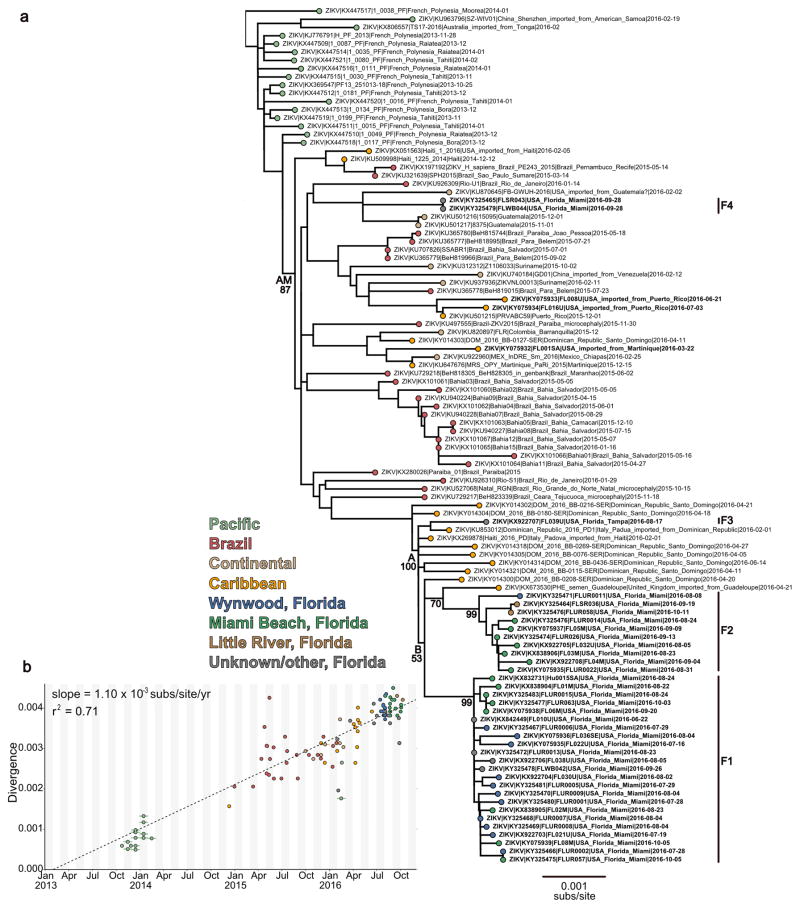
Extended Data Fig. 2. Maximum likelihood tree and root-to-tip regression of Zika virus genomes from Pacific islands and the epidemic in Americas.
(a) Maximum likelihood tree of publicly available ZIKV sequences and sequences generated in this study (n=104). tips are coloured by location, labels in bold indicate sequences generated in this study, Florida clusters F1–F4 are indicated by vertical lines to the right of the tree. Bootstrap support values are shown at key nodes. All other support values can be found in Supplementary File 1. (b) Linear regression of sample tip dates against divergence from root based on sequences with known collection dates estimates an evolutionary rate for the ZIKV phylogeny of 1.10×10⁻³ nucleotide substitutions/site/year (subs/site/yr). This is consistent with BEAST analyses using a relaxed molecular clock and a Bayesian Skyline tree prior, the best-performing combination of clock and demographic model according to marginal likelihood estimates (Extended Data Table 1c), which estimated an evolutionary rate of 1.21×10⁻³ (95% highest posterior density: 1.01 – 1.43×10⁻³) subs/site/yr (Extended Data Table 1a). These values are in agreement with previous estimates calculated based on ZIKV genomes from Brazil6.
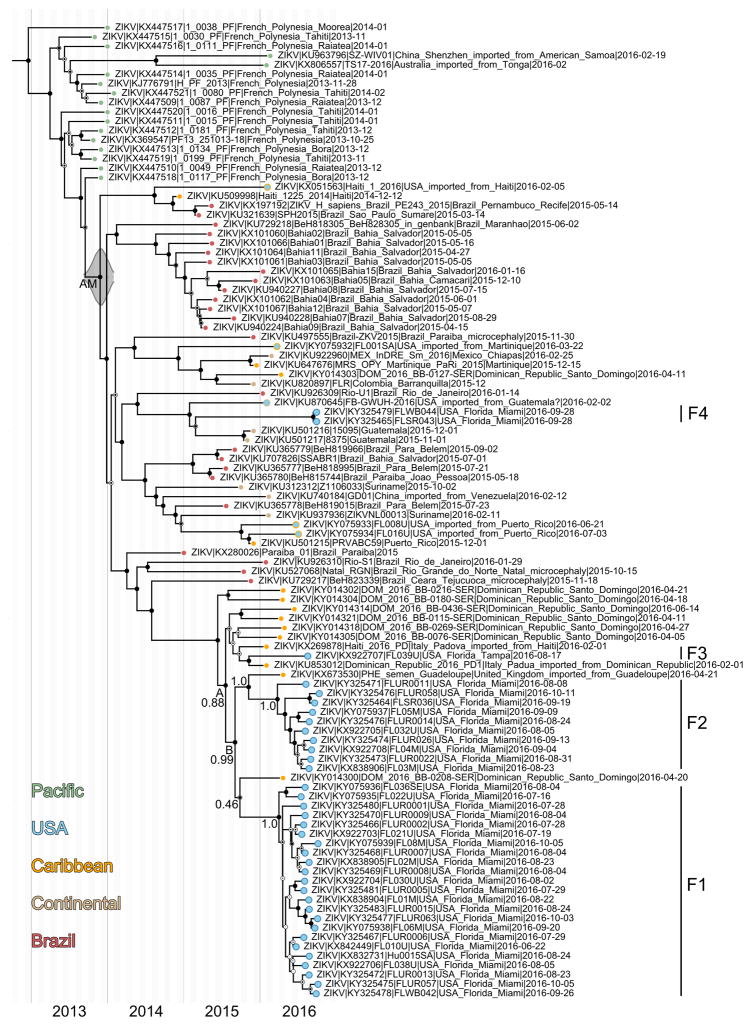
Extended Data Fig. 3. Molecular clock dating of Zika virus clades.
Maximum clade credibility (MCC) tree of ZIKV genomes collected from Pacific islands and the epidemic in Americas (n=104). Circles at the tips are colored based on origin location. Clade posterior probabilities are indicated by white circles filled with black relative to the support. A posterior probability of 1 fills the entire circle black. The grey violin plot indicates the 95% highest posterior density (HPD) interval for the tMRCA of the American epidemic. We estimated that the tMRCA for the ongoing epidemic in the Americas occurred during October, 2013 (node AM, Extended Table 1, 95% HPD: August, 2013-January, 2014), which is consistent with previous analysis based on ZIKV genomes from Brazil6.
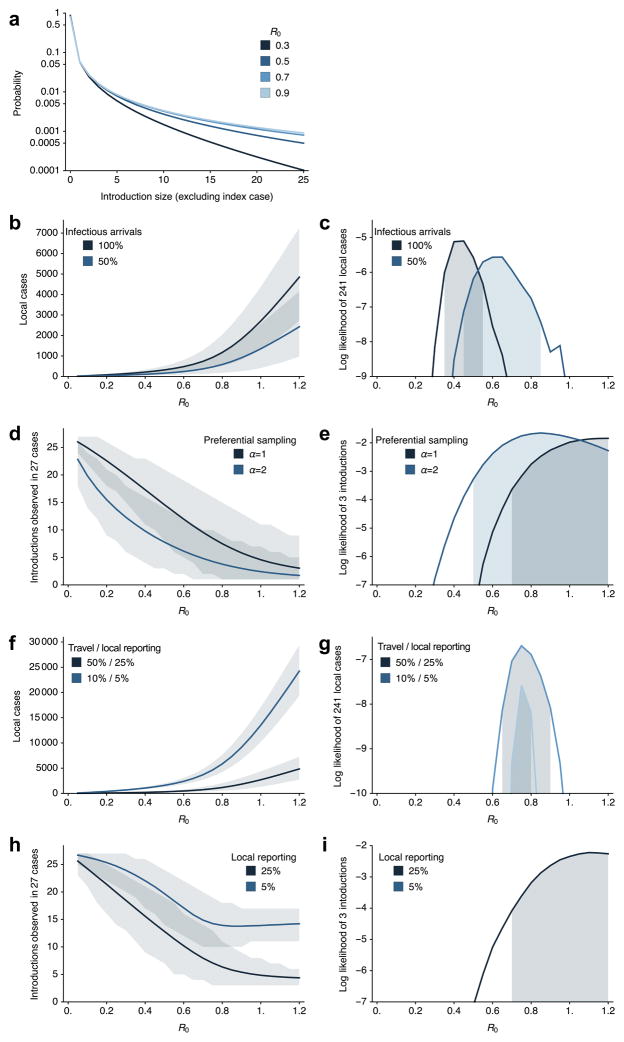
Extended Data Fig. 4. Estimation of basic reproductive number and number of introductions in Miami-Dade County.
(a) Probability distribution of estimated total number of cases caused by a single introduction (excluding the index case) for different values of R0. (b) Mean and 95% CI for total number of local cases caused by 320 introduction events (i.e., travel-associated cases diagnosed in Miami-Dade County) for different values of R0 and for different assumptions of proportion of infectious travelers. (c) Log likelihood of observing 241 local cases in Miami-Dade County with 320 introduction events for different values of R0 along with 95% maximum likelihood estimate (MLE) bounds on R0. (d) Mean and 95% uncertainty interval for total number of distinct phylogenetic clusters observed in 27 sequenced ZIKV genomes from human cases diagnosed in Miami-Dade County for different values of R0 and for different assumptions of sampling bias, from α=1 (no sampling bias) to α=2 (skewed toward preferentially sampling larger clusters). (e) Log likelihood of observing 3 clusters (i.e., ZIKV lineages F1, F2, and F4, Fig. 2a) in 27 sequenced cases for different values of R0 along with 95% MLE bounds on R0. (f) Mean and 95% CI for total number of local cases caused by 320 observed travel-associated cases with travel-associated vs local reporting rates of 50%/25% and 10%/5%. This assumes 50% of travelers are infectious. (g) Log likelihood of observing 241 local cases with 320 introduction events for different values of R0 along with 95% MLE bounds on R0 with travel-associated vs local reporting rates of 50%/25% and 10%/5%. (h) Mean and 95% uncertainty interval for total number of distinct phylogenetic clusters observed in 27 sequenced ZIKV genomes for different values of R0 and for assumptions of local reporting rate of 5% and 25%. This assumes preferential sampling (α=2). (i) Log likelihood of observing 3 clusters in 27 sequenced cases for different values of R0 along with 95% MLE bounds on R0 with local reporting rate of 5% and 25%. At 5% local reporting rate, 0 of the 100,000 replicates for all R0 values showed 3 clusters.
Extended Data Fig. 5. Weekly reported Zika virus case numbers and incidence rates in the Americas.
(a) Most ZIKV case numbers reported by PAHO30 were only available as bar graphs (raw data was not made available to us at the time of request). Therefore we used the WebPlotDigitizer to estimate the weekly case numbers from the PAHO bar graphs. ZIKV cases reported from Ecuador was the only data set to include a link to the actual case numbers that also had >10 cases per week74. To validate the WebPlotDigitizer, we compared the weekly reported case numbers from Ecuador to our estimates. (b) The reported and estimated case numbers were strongly correlated (Spearman r = 0.9981). The WebPlotDigitizer was used to estimate the ZIKV case numbers for all subsequent analysis. (c) ZIKV cases (suspected and confirmed) and (d) incidence rates (normalized per 100,000 population) are shown for each country or territory with available data per epidemiological week from January 1 to September 18, 2016. (e) Each country or territory with available data is colored by its reported ZIKV incidence rate from January to June, 2016 (the time frame for analysis of ZIKV introductions into Florida).
Extended Data Fig. 6. Cruise and flight traffic entering Miami from regions with Zika virus transmission.
The estimated number of passengers entering Miami, by either (a) cruises or (b) flights, from each country or territory in the Americas with ZIKV transmission per month (left panel). The center map and inset show the cumulative numbers of travelers entering Miami during January to June, 2016 (the time frame for analysis of ZIKV introductions into Florida) from each country or territory per method of travel. (c) The total traffic (i.e. cruises and flights) is shown entering Miami per month.
Extended Data Fig. 7. Expected number of Zika virus infected travelers from the Caribbean is correlated with the total observed number of travel-associated infections.
(a) In order to account for potential biases in ZIKV reporting accuracies, we also estimated the proportion of infected travelers using projected ZIKV attack rates79 (i.e. predicted proportion of population infected before epidemic burnout). About 60% of the infected travelers are expected to have arrived from the Caribbean, similar to our results using incidence rates (Fig. 3c). (b) The expected number of travel-associated ZIKV cases were estimated by the number of travelers coming into Miami from each country/territory (travel capacity) and the in-country/territory infection likelihood (incidence rate per person) per week. The expected travel cases were summed from all of the Americas (left), Caribbean (left center), South America (right center), and Central America (right) and plotted with the observed travel-associated ZIKV cases. Numbers in each plot indicate Spearman correlation coefficients. Negative Spearman r coefficients indicated a negative correlation between the number of expected and observed travel cases.
Extended Data Fig. 8. Greater early season potential for Zika virus introductions into Miami.
The monthly cruise ship and airline28 capacity from countries/territories with ZIKV transmission for the major United States travel hubs (shown as circle diameter) with monthly potential Ae. aegypti abundance (circle color), as previously estimated22. The abundance ranges were chosen with respect to the May-Oct Miami mean: “None to low” (<2%), “Low to moderate” (2–25%), “Moderate to high (25–75%), and “High” (>75%). Mosquito-borne transmission is unlikely in the “None to low” range. Cruise capacities from Houston and Galveston, Texas were combined.
Extended Data Table 1.
(a) Time of the most recent common ancestor and evolutionary rate and (b) Model selection to infer time-structured phylogenies.
| a | |||||||||
|---|---|---|---|---|---|---|---|---|---|
| Model combination | Clade AM tMRCA | Clade A tMRCA | Clade B tMRCA | ||||||
|
|
|
|
|||||||
| Mean | Lower 95% HPD | Higher 95% HPD | Mean | Lower 95% HPD | Higher 95% HPD | Mean | Lower 95% HPD | Higher 95% HPD | |
|
|
|
|
|||||||
| Strict, Constant | 2013.87 | 2013.65 | 2014.09 | 2015.59 | 2015.43 | 2015.76 | 2015.70 | 2015.52 | 2015.86 |
|
|
|
|
|||||||
| Strict, Exponential | 2013.90 | 2013.69 | 2014.09 | 2015.55 | 2015.36 | 2015.72 | 2015.66 | 2015.47 | 2015.83 |
|
|
|
|
|||||||
| Strict, Bayesian Skyline | 2013.92 | 2013.70 | 2014.12 | 2015.56 | 2015.38 | 2015.74 | 2015.69 | 2015.50 | 2015.86 |
|
|
|
|
|||||||
| UCLN, Constant | 2013.95 | 2013.66 | 2014.21 | 2015.70 | 2015.49 | 2015.88 | 2015.82 | 2015.63 | 2016.03 |
|
|
|
|
|||||||
| UCLN, Exponential | 2013.95 | 2013.70 | 2014.19 | 2015.62 | 2015.39 | 2015.81 | 2015.73 | 2015.51 | 2015.93 |
|
|
|
|
|||||||
| UCLN, Bayesian Skyline | 2013.97 | 2013.72 | 2014.23 | 2015.62 | 2015.40 | 2015.81 | 2015.76 | 2015.54 | 2015.94 |
|
|
|
|
|||||||
| Model combination | Clade F1 tMRCA | Clade F2 tMRCA | Evolutionary Rate | ||||||
|---|---|---|---|---|---|---|---|---|---|
|
|
|
|
|||||||
| Mean | Lower 95% HPD | Higher 95% HPD | Mean | Lower 95% HPD | Higher 95% HPD | Mean | Lower 95% HPD | Higher 95% HPD | |
|
|
|
|
|||||||
| Strict, Constant | 2016.16 | 2016.02 | 2016.28 | 2016.16 | 2016.00 | 2016.31 | 1.09E-03 | 9.27E-04 | 1.23E-03 |
|
|
|
|
|||||||
| Strict, Exponential | 2016.12 | 2015.97 | 2016.25 | 2016.13 | 2015.94 | 2016.28 | 1.08E-03 | 9.35E-04 | 1.23E-03 |
|
|
|
|
|||||||
| Strict, Bayesian Skyline | 2016.25 | 2016.13 | 2016.36 | 2016.24 | 2016.06 | 2016.37 | 1.13E-03 | 9.80E-04 | 1.28E-03 |
|
|
|
|
|||||||
| UCLN, Constant | 2016.19 | 2016.05 | 2016.31 | 2016.21 | 2016.05 | 2016.36 | 1.22E-03 | 9.95E-04 | 1.47E-03 |
|
|
|
|
|||||||
| UCLN, Exponential | 2016.14 | 2015.98 | 2016.27 | 2016.16 | 2015.98 | 2016.32 | 1.17E-03 | 9.68E-04 | 1.39E-03 |
|
|
|
|
|||||||
| UCLN, Bayesian Skyline | 2016.27 | 2016.16 | 2016.38 | 2016.27 | 2016.08 | 2016.39 | 1.21E-03 | 1.01E-03 | 1.43E-03 |
|
|
|
|
|||||||
| b | ||||
|---|---|---|---|---|
| Model combination | Path Sampling | Ranking | Stepping Stone | Ranking |
| Strict, Constant | −20379.871 | 5 | −20384.201 | 5 |
| Strict, Exponential | −20375.747 | 4 | −20379.272 | 4 |
| Strict, Bayesian Skyline | −20358.676 | 2 | −20363.748 | 2 |
| UCLN, Constant | −20381.228 | 6 | −20385.807 | 6 |
| UCLN, Exponential | −20370.555 | 3 | −20374.418 | 3 |
| UCLN, Bayesian Skyline | −20354.940 | 1 | −20361.218 | 1 |
HPD, highest posterior density. Dates listed as proportion of days elapsed with a year. Clades refer to Fig. 2a.
Extended Data Table 2.
Validation of sequencing results.
| Sample | Amplicon method | NGS platform | Mismatches/nucleotides covereda | ||
|---|---|---|---|---|---|
| 3′UTR | CDS | 5′ UTR | |||
| FL01M | 35 × 400 bp | Ion S5 | 1/80 | 0/10272 | 7/252 |
| 75 × ~200 bpb | Ion S5 | 2/75 | 0/10272 | 4/205 | |
| 5 × ~2,200 bp | MiSeq | 0/80 | 0/10272 | 0/32 | |
| FL03M | 35 × 400 bp | Ion S5 | 3/87 | 0/10272 | 20/252 |
| 75 × ~200 bpb | Ion S5 | 4/78 | 0/10272 | 5/198 | |
| 5 × ~2,200 bp | MiSeq | 0/82 | 0/10272 | 0/32 | |
Compared to the consensus genomes generated by sequencing 35 × 400 bp amplicons on the MiSeq.
Amplicons produced using Ion AmpliSeq and 875 custom ZIKV primers.
NGS, next-generation sequencing; UTR, untranslated region; CDS, coding sequence.
Supplementary Material
Acknowledgments
We thank J. Weger-Lucarelli, G. Ebel, C. Moore, B. Alto, G. Donatti, and S. Taylor for discussions, E. Spencer for IRB and logistics support, M. Pilcher for sequencing assistance, and G. Schroth and S. Gross for designing and providing enrichment probes. N.D.G. is supported by NIH training grant 5T32AI007244-33. G.D. is supported by the Mahan Postdoctoral Fellowship from the Computational Biology Program at Fred Hutch. K.G.B. is supported by the ASTMH Shope Fellowship. N.R.F. is funded by a Sir Henry Dale Fellowship (Wellcome Trust/Royal Society Grant 204311/Z/16/Z). D.A.T.C. was supported by US NIH MIDAS program (U54-GM088491) and CDC Cooperative Agreement U01CK000510. A.R. is supported by EU Seventh Framework Programme (FP7/2007-2013) under Grant 278433-PREDEMICS, ERC Grant 260864, Horizon 2020 Grant 643476-COMPARE. T.B. is a Pew Biomedical Scholar and is supported by NIH R35 GM119774-01. O.G.P. received funding from EU ERC Seventh Framework Programme (FP7/2007-2013)/ERC number 614725-PATHPHYLODYN and the USAID Emerging Pandemic Threats Program-2 PREDICT-2 (Cooperative Agreement No. AID-OAA-A-14-00102). S.I. and S.F.M. are supported by NIH NIAID 4R01AI099210-04. ZIKV sequencing at USAMRIID was supported by DARPA (PI: C. Kane). K.G.A. is a Pew Biomedical Scholar, and is supported by NIH NCATS CTSA UL1TR001114, NIAID contract HHSN272201400048C, and The Ray Thomas Foundation. The content of this publication does not necessarily reflect the views or policies of the US Army, the Department of Health and Human Services, the CDC, or the Florida DOH.
Footnotes
Author Contributions
All contributions are listed in order of authorship. Designed the experiments: N.D.G., J.T.L., G.D., M.U.G.K., D.A.T.C., P.C.S, L.D.G., S.F.M., T.B., O.G.P., S.I., G.P., and K.G.A.; Collected samples: A.L.T., S.W., D.M.M., A.B., L.M.P., D.P., P.N.L., M.R., V.K.B., D.I.W., M.R.C., E.W.K., K.N.H., A.C.C., R.J., M.C.P., C.V., D.S., L.D.G., S.F.M., and S.I.; Performed the sequencing: N.D.G., M.W.R., K.P., D.R., R.R.-S., G.O., and E.N.; Provided data, reagents, or protocols: N.D.G., J.T.L., G.D., M.U.G.K., K.G., M.R.W., R.R.-S., G.O., H.C.M., M.L.B., K.G.B., B.C., C.A.F., A.G.-Y., A.G., C.L., B.M., C.B.M., D.J.P., J.Q., S.F.S., C.T.-T., K.L.M., S.M.W., S.W., N.L.Y., J.Q., J.R.F., K.K., S.E.B., A.J.M., R.F.G., N.J.L., M.C.P., C.V., P.C.S., S.F.M., and S.I.; Analyzed the data: N.D.G., J.T.L., G.D., M.U.G.K., K.G., J.T., J.R.F., R.C.R., N.R.F., D.A.T.C., A.K., M.S.-L., T.B., S.F.M, O.G.P., S.I., and K.G.A.; Edited manuscript: G.D., M.U.G.K., J.T., S.F.S., A.R., T.B., O.G.P., S.I., and G.P.; Wrote manuscript: N.D.G., J.T.L., and K.G.A.; All authors read and approved the manuscript.
The authors declare no competing financial interests.
References
- 1.Zika virus and complications. World Health Organization; [Accessed: 1st November 2016]. Available at: http://www.who.int/features/qa/zika/en/ [Google Scholar]
- 2.Lazear HM, Diamond MS. Zika Virus: New Clinical Syndromes and Its Emergence in the Western Hemisphere. J Virol. 2016;90:4864–4875. doi: 10.1128/JVI.00252-16. [DOI] [PMC free article] [PubMed] [Google Scholar]
- 3.Likos A, et al. Local Mosquito-Borne Transmission of Zika Virus - Miami-Dade and Broward Counties, Florida, June-August 2016. MMWR Morb Mortal Wkly Rep. 2016;65:1032–1038. doi: 10.15585/mmwr.mm6538e1. [DOI] [PubMed] [Google Scholar]
- 4.Mosquito-Borne Disease Surveillance. Florida Department of Health; [Accessed: 10th January 2017]. Available at: http://www.floridahealth.gov/diseases-and-conditions/mosquito-borne-diseases/surveillance.html. [Google Scholar]
- 5.Hennessey M, Fischer M, Staples JE. Zika Virus Spreads to New Areas — Region of the Americas, May 2015–January 2016. MMWR Morb Mortal Wkly Rep. 2016;65:1–4. doi: 10.15585/mmwr.mm6503e1. [DOI] [PubMed] [Google Scholar]
- 6.Faria NR, et al. Zika virus in the Americas: Early epidemiological and genetic findings. Science. 2016;352:345–349. doi: 10.1126/science.aaf5036. [DOI] [PMC free article] [PubMed] [Google Scholar]
- 7.Faria NR, Quick J, Morales I, Theze J, de Jesus JG. Epidemic establishment and cryptic transmission of Zika virus in Brazil and the Americas. 2017 doi: 10.1038/nature22401. bioRxiv. [DOI] [PMC free article] [PubMed] [Google Scholar]
- 8.Metsky HC, et al. Genome sequencing reveals Zika virus diversity and spread in the Americas. 2017;109348 doi: 10.1101/109348. bioRxiv. [DOI] [Google Scholar]
- 9.Regional Zika Epidemiological Update (Americas) Pan American Health Organization; 2016. [Accessed: 1st December 2016]. Available at: http://www.paho.org/hq/index.php?option=com_content&view=article&id=11599&Itemid=41691&lang=en. [Google Scholar]
- 10.Weger-Lucarelli J, et al. Vector Competence of American Mosquitoes for Three Strains of Zika Virus. PLoS Negl Trop Dis. 2016;10:e0005101. doi: 10.1371/journal.pntd.0005101. [DOI] [PMC free article] [PubMed] [Google Scholar]
- 11.Guerbois M, et al. Outbreak of Zika virus infection, Chiapas State, Mexico, 2015, and first confirmed transmission by Aedes aegypti mosquitoes in the Americas. J Infect Dis. 2016 doi: 10.1093/infdis/jiw302. [DOI] [PMC free article] [PubMed] [Google Scholar]
- 12.Ferreira-de-Brito A, et al. First detection of natural infection of Aedes aegypti with Zika virus in Brazil and throughout South America. Mem Inst Oswaldo Cruz. 2016;0 doi: 10.1590/0074-02760160332. [DOI] [PMC free article] [PubMed] [Google Scholar]
- 13.Chouin-Carneiro T, et al. Differential Susceptibilities of Aedes aegypti and Aedes albopictus from the Americas to Zika Virus. PLoS Negl Trop Dis. 2016;10:e0004543. doi: 10.1371/journal.pntd.0004543. [DOI] [PMC free article] [PubMed] [Google Scholar]
- 14.Kraemer MUG, et al. The global distribution of the arbovirus vectors Aedes aegypti and Ae. albopictus. Elife. 2015;4:e08347. doi: 10.7554/eLife.08347. [DOI] [PMC free article] [PubMed] [Google Scholar]
- 15.Ferguson NM, et al. Countering the Zika epidemic in Latin America. Science. 2016;353:353–354. doi: 10.1126/science.aag0219. [DOI] [PMC free article] [PubMed] [Google Scholar]
- 16.Teets FD, et al. Origin of the dengue virus outbreak in Martin County, Florida, USA 2013. Virol Rep. 2014;1–2:2–8. doi: 10.1016/j.virep.2014.05.001. [DOI] [PMC free article] [PubMed] [Google Scholar]
- 17.Graham AS, et al. Mosquito-associated dengue virus, Key West, Florida, USA, 2010. Emerg Infect Dis. 2011;17:2074–2075. doi: 10.3201/eid1711.110419. [DOI] [PMC free article] [PubMed] [Google Scholar]
- 18.Kendrick K, et al. Notes from the field: transmission of chikungunya virus in the continental United States—Florida, 2014. MMWR Morb Mortal Wkly Rep. 2014;63:1137. [PMC free article] [PubMed] [Google Scholar]
- 19.Bouri N, et al. Return of epidemic dengue in the United States: implications for the public health practitioner. Public Health Rep. 2012;127:259–266. doi: 10.1177/003335491212700305. [DOI] [PMC free article] [PubMed] [Google Scholar]
- 20.Ramos MM, et al. Epidemic Dengue and Dengue Hemorrhagic Fever at the Texas–Mexico Border: Results of a Household-based Seroepidemiologic Survey, December 2005. Am J Trop Med Hyg. 2008;78:364–369. [PubMed] [Google Scholar]
- 21.Murray KO, et al. Identification of dengue fever cases in Houston, Texas, with evidence of autochthonous transmission between 2003 and 2005. Vector Borne Zoonotic Dis. 2013;13:835–845. doi: 10.1089/vbz.2013.1413. [DOI] [PMC free article] [PubMed] [Google Scholar]
- 22.Monaghan AJ, et al. On the Seasonal Occurrence and Abundance of the Zika Virus Vector Mosquito Aedes Aegypti in the Contiguous United States. PLoS Curr. 2016;8 doi: 10.1371/currents.outbreaks.50dfc7f46798675fc63e7d7da563da76. [DOI] [PMC free article] [PubMed] [Google Scholar]
- 23.Dzul-Manzanilla F, et al. Evidence of vertical transmission and co-circulation of chikungunya and dengue viruses in field populations of Aedes aegypti (L.) from Guerrero, Mexico. Trans R Soc Trop Med Hyg. 2016;110:141–144. doi: 10.1093/trstmh/trv106. [DOI] [PubMed] [Google Scholar]
- 24.Quick J, et al. Multiplex PCR method for MinION and Illumina sequencing of Zika and other virus genomes directly from clinical samples. 2017;098913 doi: 10.1038/nprot.2017.066. bioRxiv. [DOI] [PMC free article] [PubMed] [Google Scholar]
- 25.Drummond AJ, Suchard MA, Xie D, Rambaut A. Bayesian phylogenetics with BEAUti and the BEAST 1.7. Mol Biol Evol. 2012;29:1969–1973. doi: 10.1093/molbev/mss075. [DOI] [PMC free article] [PubMed] [Google Scholar]
- 26.Robert MA, et al. Modeling Mosquito-Borne Disease Spread in U.S. Urbanized Areas: The Case of Dengue in Miami. PLoS One. 2016;11:e0161365. doi: 10.1371/journal.pone.0161365. [DOI] [PMC free article] [PubMed] [Google Scholar]
- 27.McCarthy M. First US case of Zika virus infection is identified in Texas. BMJ. 2016;352:i212. doi: 10.1136/bmj.i212. [DOI] [PubMed] [Google Scholar]
- 28.Nelson B, et al. Travel Volume to the United States from Countries and U.S. Territories with Local Zika Virus Transmission. PLoS Curr. 2016;8 doi: 10.1371/currents.outbreaks.ac6d0f8c9c35e88825c1a1147697531c. [DOI] [PMC free article] [PubMed] [Google Scholar]
- 29.Dengue in Puerto Rico. The Centers for Disease Control and Prevention; [Accessed: 17th March 2017]. Available at: https://www.cdc.gov/dengue/about/inpuerto.html. [Google Scholar]
- 30.Zika-Epidemiological Report. Pan American Health Organization; [Accessed: 1st December 2016]. Available at: http://www.paho.org/hq/index.php?option=com_content&view=article&id=11603&Itemid=41696&lang=en. [Google Scholar]
- 31.Duffy MR, et al. Zika virus outbreak on Yap Island, Federated States of Micronesia. N Engl J Med. 2009;360:2536–2543. doi: 10.1056/NEJMoa0805715. [DOI] [PubMed] [Google Scholar]
- 32.Dinh L, Chowell G, Mizumoto K, Nishiura H. Estimating the subcritical transmissibility of the Zika outbreak in the State of Florida, USA, 2016. Theor Biol Med Model. 2016;13:20. doi: 10.1186/s12976-016-0046-1. [DOI] [PMC free article] [PubMed] [Google Scholar]
- 33.Nunes MRT, et al. Air travel is associated with intracontinental spread of dengue virus serotypes 1–3 in Brazil. PLoS Negl Trop Dis. 2014;8:e2769. doi: 10.1371/journal.pntd.0002769. [DOI] [PMC free article] [PubMed] [Google Scholar]
- 34.Basemaps. ESRI; [Accessed: 1st October 2016]. Available at: http://www.esri.com/data/basemaps. [Google Scholar]
- 35.Zika virus. Florida Department of Health; [Accessed: 10th January 2017]. Available at: http://www.floridahealth.gov/diseases-and-conditions/zika-virus/index.html?utm_source=flhealthIndex. [Google Scholar]
- 36.Daily Zika update. Florida Department of Health; [Accessed: 10th January 2017]. Available at: http://www.floridahealth.gov/newsroom/all-articles.html. [Google Scholar]
- 37.Zika virus case counts in the US. The Centers for Disease Control and Prevention; 2016. [Accessed: 10th January 2017]. Available at: http://www.cdc.gov/zika/geo/united-states.html. [Google Scholar]
- 38.Rabe IB, et al. Interim Guidance for Interpretation of Zika Virus Antibody Test Results. MMWR Morb Mortal Wkly Rep. 2016;65:543–546. doi: 10.15585/mmwr.mm6521e1. [DOI] [PubMed] [Google Scholar]
- 39.Waggoner JJ, Pinsky BA. Zika Virus: Diagnostics for an Emerging Pandemic Threat. J Clin Microbiol. 2016;54:860–867. doi: 10.1128/JCM.00279-16. [DOI] [PMC free article] [PubMed] [Google Scholar]
- 40.Lanciotti RS, et al. Genetic and serologic properties of Zika virus associated with an epidemic, Yap State, Micronesia, 2007. Emerg Infect Dis. 2008;14:1232–1239. doi: 10.3201/eid1408.080287. [DOI] [PMC free article] [PubMed] [Google Scholar]
- 41.Interim Guidance for Zika Virus Testing of Urine - United States, 2016. MMWR Morb Mortal Wkly Rep. 2016;65:474. doi: 10.15585/mmwr.mm6518e1. [DOI] [PubMed] [Google Scholar]
- 42.Biggerstaff B. An Excel Add-In to Compute Infection Rates from Pooled Data. Centers for Disease Control; Fort Collins, CO: 2009. PooledInfRate, version 4.0. [Google Scholar]
- 43.Bogoch II, et al. Potential for Zika virus introduction and transmission in resource-limited countries in Africa and the Asia-Pacific region: a modelling study. Lancet Infect Dis. 2016 doi: 10.1016/S1473-3099(16)30270-5. [DOI] [PMC free article] [PubMed] [Google Scholar]
- 44.Hwang WH, He F. Estimating abundance from presence/absence maps. Methods Ecol Evol. 2011;2:550–559. [Google Scholar]
- 45.Corman VM, et al. Clinical comparison, standardization and optimization of Zika virus molecular detection. Bull World Health Organ. 2016 doi: 10.2471/BLT.16.175950. [DOI] [PMC free article] [PubMed] [Google Scholar]
- 46.Worobey M, et al. 1970s and ‘Patient 0’ HIV-1 genomes illuminate early HIV/AIDS history in North America. Nature. 2016 doi: 10.1038/nature19827. [DOI] [PMC free article] [PubMed] [Google Scholar]
- 47.Bolger AM, Lohse M, Usadel B. Trimmomatic: a flexible trimmer for Illumina sequence data. Bioinformatics. 2014;30:2114–2120. doi: 10.1093/bioinformatics/btu170. [DOI] [PMC free article] [PubMed] [Google Scholar]
- 48.Li H, et al. The Sequence Alignment/Map format and SAMtools. Bioinformatics. 2009;25:2078–2079. doi: 10.1093/bioinformatics/btp352. [DOI] [PMC free article] [PubMed] [Google Scholar]
- 49.Köster J, Rahmann S. OASIcs-OpenAccess Series in Informatics. Vol. 26. Schloss Dagstuhl-Leibniz-Zentrum fuer Informatik; 2012. Building and documenting workflows with python-based snakemake. [Google Scholar]
- 50.Kearse M, et al. Geneious Basic: an integrated and extendable desktop software platform for the organization and analysis of sequence data. Bioinformatics. 2012;28:1647–1649. doi: 10.1093/bioinformatics/bts199. [DOI] [PMC free article] [PubMed] [Google Scholar]
- 51.Martin M. Cutadapt removes adapter sequences from high-throughput sequencing reads. EMBnet journal. 2011;17:10–12. [Google Scholar]
- 52.Schmieder R, Edwards R. Quality control and preprocessing of metagenomic datasets. Bioinformatics. 2011;27:863–864. doi: 10.1093/bioinformatics/btr026. [DOI] [PMC free article] [PubMed] [Google Scholar]
- 53.Langmead B, Salzberg SL. Fast gapped-read alignment with Bowtie 2. Nat Methods. 2012;9:357–359. doi: 10.1038/nmeth.1923. [DOI] [PMC free article] [PubMed] [Google Scholar]
- 54.Katoh K, Standley DM. MAFFT multiple sequence alignment software version 7: improvements in performance and usability. Mol Biol Evol. 2013;30:772–780. doi: 10.1093/molbev/mst010. [DOI] [PMC free article] [PubMed] [Google Scholar]
- 55.Guindon S, Gascuel O. A simple, fast, and accurate algorithm to estimate large phylogenies by maximum likelihood. Syst Biol. 2003;52:696–704. doi: 10.1080/10635150390235520. [DOI] [PubMed] [Google Scholar]
- 56.Yang Z. Maximum likelihood phylogenetic estimation from DNA sequences with variable rates over sites: approximate methods. J Mol Evol. 1994;39:306–314. doi: 10.1007/BF00160154. [DOI] [PubMed] [Google Scholar]
- 57.Darriba D, Taboada GL, Doallo R, Posada D. jModelTest 2: more models, new heuristics and parallel computing. Nat Methods. 2012;9:772. doi: 10.1038/nmeth.2109. [DOI] [PMC free article] [PubMed] [Google Scholar]
- 58.Rambaut A, Lam TT, Max Carvalho L, Pybus OG. Exploring the temporal structure of heterochronous sequences using TempEst (formerly Path-O-Gen) Virus Evol. 2016;2:vew007. doi: 10.1093/ve/vew007. [DOI] [PMC free article] [PubMed] [Google Scholar]
- 59.Shapiro B, Rambaut A, Drummond AJ. Choosing appropriate substitution models for the phylogenetic analysis of protein-coding sequences. Mol Biol Evol. 2006;23:7–9. doi: 10.1093/molbev/msj021. [DOI] [PubMed] [Google Scholar]
- 60.Ferreira MAR, Suchard MA. Bayesian analysis of elapsed times in continuous-time Markov chains. The Canadian Journal of Statistics/La Revue Canadienne de Statistique. 2008;36:355–368. [Google Scholar]
- 61.Baele G, et al. Improving the accuracy of demographic and molecular clock model comparison while accommodating phylogenetic uncertainty. Mol Biol Evol. 2012;29:2157–2167. doi: 10.1093/molbev/mss084. [DOI] [PMC free article] [PubMed] [Google Scholar]
- 62.Xie W, Lewis PO, Fan Y, Kuo L, Chen MH. Improving marginal likelihood estimation for Bayesian phylogenetic model selection. Syst Biol. 2011;60:150–160. doi: 10.1093/sysbio/syq085. [DOI] [PMC free article] [PubMed] [Google Scholar]
- 63.Gelman A, Meng XL. Simulating Normalizing Constants: From Importance Sampling to Bridge Sampling to Path Sampling. Stat Sci. 1998;13:163–185. [Google Scholar]
- 64.Drummond AJ, Rambaut A, Shapiro B, Pybus OG. Bayesian coalescent inference of past population dynamics from molecular sequences. Mol Biol Evol. 2005;22:1185–1192. doi: 10.1093/molbev/msi103. [DOI] [PubMed] [Google Scholar]
- 65.Churcher TS, et al. Public health. Measuring the path toward malaria elimination. Science. 2014;344:1230–1232. doi: 10.1126/science.1251449. [DOI] [PMC free article] [PubMed] [Google Scholar]
- 66.Lloyd-Smith JO, Schreiber SJ, Kopp PE, Getz WM. Superspreading and the effect of individual variation on disease emergence. Nature. 2005;438:355–359. doi: 10.1038/nature04153. [DOI] [PMC free article] [PubMed] [Google Scholar]
- 67.Nishiura H, Yan P, Sleeman CK, Mode CJ. Estimating the transmission potential of supercritical processes based on the final size distribution of minor outbreaks. J Theor Biol. 2012;294:48–55. doi: 10.1016/j.jtbi.2011.10.039. [DOI] [PMC free article] [PubMed] [Google Scholar]
- 68.Perkins TA, Scott TW, Le Menach A, Smith DL. Heterogeneity, mixing, and the spatial scales of mosquito-borne pathogen transmission. PLoS Comput Biol. 2013;9:e1003327. doi: 10.1371/journal.pcbi.1003327. [DOI] [PMC free article] [PubMed] [Google Scholar]
- 69.Kraemer MUG, et al. Big city, small world: density, contact rates, and transmission of dengue across Pakistan. J R Soc Interface. 2015;12:20150468. doi: 10.1098/rsif.2015.0468. [DOI] [PMC free article] [PubMed] [Google Scholar]
- 70.Kraemer MUG, et al. Spread of yellow fever virus outbreak in Angola and the Democratic Republic of the Congo 2015–16: a modelling study. Lancet Infect Dis. 2017 Mar;17:330–338. doi: 10.1016/S1473-3099(16)30513-8. [DOI] [PMC free article] [PubMed] [Google Scholar]
- 71.Struchiner CJ, Rocklöv J, Wilder-Smith A, Massad E. Increasing Dengue Incidence in Singapore over the Past 40 Years: Population Growth, Climate and Mobility. PLoS One. 2015;10:e0136286. doi: 10.1371/journal.pone.0136286. [DOI] [PMC free article] [PubMed] [Google Scholar]
- 72.Fauver JR, et al. Temporal and Spatial Variability of Entomological Risk Indices for West Nile Virus Infection in Northern Colorado: 2006–2013. J Med Entomol. 2016;53:425–434. doi: 10.1093/jme/tjv234. [DOI] [PMC free article] [PubMed] [Google Scholar]
- 73.Rocklöv J, et al. Assessing Seasonal Risks for the Introduction and Mosquito-borne Spread of Zika Virus in Europe. EBioMedicine. 2016;9:250–256. doi: 10.1016/j.ebiom.2016.06.009. [DOI] [PMC free article] [PubMed] [Google Scholar]
- 74.Ministry of Public Health, Ecuador. [Accessed: 19th March 2017];National Direction of Epidemiological Surveillance for Vector Transmitted Diseases (Spanish) Available at: http://www.salud.gob.ec/wp-content/uploads/2015/12/GACETA-ZIKA_SE5corregido.pdf.
- 75.Zika Cumulative Cases. Pan American Health Organization; [Accessed: 1st December 2016]. Available at: http://www.paho.org/hq/index.php?option=com_content&view=article&id=12390&Itemid=42090&lang=en. [Google Scholar]
- 76.Lessler JT, et al. Times to key events in the course of Zika infection and their implications: a systematic review and pooled analysis. Bull World Health Organ. 2016 doi: 10.2471/BLT.16.174540. [DOI] [PMC free article] [PubMed] [Google Scholar]
- 77.Lee S, Ramdeen C. Cruise ship itineraries and occupancy rates. Tourism Manage. 2013 Feb34:236–237. [Google Scholar]
- 78.FCCA Research & Statistics. Florida-Caribbean Cruise Association; [Accessed: 1st March 2017]. Available at: http://www.f-cca.com/research.html. [Google Scholar]
- 79.Perkins TA, Siraj AS, Ruktanonchai CW, Kraemer MUG, Tatem AJ. Model-based projections of Zika virus infections in childbearing women in the Americas. Nat Microbiol. 2016;1:16126. doi: 10.1038/nmicrobiol.2016.126. [DOI] [PubMed] [Google Scholar]
- 80.Hunter JD. Matplotlib: A 2D Graphics Environment. Comput Sci Eng. 2007;9:90–95. [Google Scholar]
Associated Data
This section collects any data citations, data availability statements, or supplementary materials included in this article.
Supplementary Materials
Data Availability Statement
All ZIKV sequencing data is available under the NCBI BioProjects PRJNA342539 and PRJNA356429. Individual sample GenBank access numbers are listed in Supplementary Table 1a. All other data is available in the Extended Data, Supplemental Information, or upon request.


