

This Resource describes the Image Data Resource (IDR), a prototype online system for biological image data that links experimental and analytic data across multiple data sets and promotes image data sharing and reanalysis.
Supplementary information
The online version of this article (doi:10.1038/nmeth.4326) contains supplementary material, which is available to authorized users.
Subject terms: Protein databases, Data integration, Protein databases
Abstract
Access to primary research data is vital for the advancement of science. To extend the data types supported by community repositories, we built a prototype Image Data Resource (IDR). IDR links data from several imaging modalities, including high-content screening, multi-dimensional microscopy and digital pathology, with public genetic or chemical databases and cell and tissue phenotypes expressed using controlled ontologies. Using this integration, IDR facilitates the analysis of gene networks and reveals functional interactions that are inaccessible to individual studies. To enable reanalysis, we also established a computational resource based on Jupyter notebooks that allows remote access to the entire IDR. IDR is also an open-source platform for publishing imaging data. Thus IDR provides an online resource and a software infrastructure that promotes and extends publication and reanalysis of scientific image data.
Supplementary information
The online version of this article (doi:10.1038/nmeth.4326) contains supplementary material, which is available to authorized users.
Main
Much of the published research in the life sciences is based on image data sets that sample 3D space, time and the spectral characteristics of detected signal to provide quantitative measures of cell, tissue and organismal processes and structures. The sheer size of biological image data sets makes data submission, handling and publication challenging. An image-based genome-wide 'high-content' screen (HCS) may contain more than 1 million images, and new 'virtual slide' and 'light sheet' tissue imaging technologies generate individual images that contain gigapixels of data showing tissues or whole organisms at subcellular resolutions. At the same time, published versions of image data are often mere illustrations: they are presented in processed, compressed formats that cannot convey the measurements and multiple dimensions contained in the original image data and cannot easily be reanalyzed. Furthermore, conventional publications do not include the metadata that define imaging protocols, biological systems and perturbations or the processing and analytic outputs that convert the image data into quantitative measurements.
Several public image databases have appeared over the past few years. These provide online access to image data, enable browsing and visualization and, in some cases, include experimental metadata. The Allen Brain Atlas, the Human Protein Atlas and the Edinburgh Mouse Atlas all synthesize measurements of gene expression, protein localization and/or other analytic metadata with coordinate systems that place biomolecular localization and concentration into a spatial and biological context1,2,3. There are many other examples of dedicated databases for specific imaging projects, each tailored for specific aims and target communities4,5,6,7,8. A number of public resources serve as scientific, structured repositories for image data—i.e., they collect, store and provide persistent identifiers for long-term access to submitted data sets and provide rich functionalities for browsing, search and query. One archetype is the EMDataBank, the definitive community repository for molecular reconstructions recorded by electron microscopy9. The Journal of Cell Biology has built the JCB DataViewer, which publishes image data sets associated with its online publications. The CELL Image Library includes several thousand community-submitted images, some of which are linked to publications10. Figshare stores 2D pictures derived from image data sets and can provide links to download image data. The EMDataBank recently released a prototype repository for 3D tomograms, the EMPIAR resource11. Finally, the BioStudies and Dryad archives include support for browsing and downloading image data files linked to studies or publications12. Some of these provide a resource for a specific imaging domain (for example, EMDataBank) or experiment (MitoCheck), whereas others archive data sets and provide links to related publications at external journal websites (BioStudies). However, no existing resource links independent biological imaging data sets to provide an 'added-value' platform similar to Expression Atlas, for gene expression data13, or UniProt, for protein sequence and function data14.
Inspired by these added-value resources, we built IDR, an added-value platform that combines data from multiple independent imaging experiments and imaging modalities and integrates them into a single resource for reanalysis in a convenient, scalable form. IDR provides a prototyped resource that supports browsing, search, visualization and computational processing within and across data sets acquired from a wide variety of imaging domains. For each study, image data are stored along with metadata related to the experimental design, data acquisition and analysis and made available for search and query through a web interface and a single application program interface (API). Where possible, we have mapped the phenotypes determined by data set authors to a common ontology. For several studies, we have calculated comprehensive sets of image features that can be used by others for reanalysis and the development of phenotypic classifiers. By harmonizing data from multiple imaging studies into a single system, IDR enables users to query across studies and identify phenotypic links between different experiments and perturbations.
Results
Current IDR
IDR is currently populated with 24 imaging studies, comprising 35 screens or biological imaging experiments, most of which are linked to published works (Table 1). IDR holds ∼42 TB of image data in ∼36 million image planes and ∼1 million individual experiments and includes all associated experimental annotations (such as genes, RNAi, chemistry, geographic location), analytic annotations (submitter-calculated image regions and features) and functional annotations. Data sets from studies in human, mouse, fly, plant and fungal cells are included. The imaging modalities and experimental approaches supported include super-resolution 3DSIM and dSTORM, high-content chemical and siRNA screening, whole-slide histopathology imaging and live imaging of human and fungal cells and intact mice. Imaging data from Tara Oceans, a global survey of plankton and other marine organisms, are also included. The current collection samples biomedically relevant features such as cell shape, division and adhesion, from nanometer-scale localization of cellular proteins to millimeter-scale structures of animal tissues (Table 2).
Table 1.
Data sets in IDR
| Study identifier | Species | Type | Screens or experiments | 5D images | Size (TB) | Pheno- typesa | Targetsb | Experimentsc | Reference |
|---|---|---|---|---|---|---|---|---|---|
| idr0001-graml-sysgro | S. pombe | Gene deletion screen | 1 | 109,728 | 10.06 | 19 | 3,005 | 18,432 | 5 |
| idr0002-heriche-condensation | Human | RNAi screen | 1 | 1,152 | 2.10 | 2 | 102 | 1,152 | 26 |
| idr0003-breker-plasticity | Saccharomyces cerevisiae | Protein screen | 1 | 97,920 | 0.20 | 14 | 6,234 | 32,640 | 41 |
| idr0004-thorpe-rad52 | S. cerevisiae | Gene deletion screen | 1 | 3,765 | 0.17 | 1 | 4,195 | 4,512 | 42 |
| idr0005-toret-adhesion | Drosophila melanogaster | RNAi screen | 2 | 45,792 | 0.14 | 1 | 13,035 | 15,264 | 43 |
| idr0006-fong-nuclearbodies | Human | Protein localization screen | 1 | 240,848 | 1.40 | 8 | 12,743 | 16,224 | 44 |
| idr0007-srikumar-sumo | S. cerevisiae | Protein localization screen | 1 | 3,456 | 0.02 | 23 | 377 | 1,152 | 45 |
| idr0008-rohn-actinome | D. melanogaster, human | RNAi screen | 2 | 55,944 | 0.12 | 46 | 12,826 | 26,496 | 40 |
| idr0009-simpson-secretion | Human | RNAi screen | 2 | 397,056 | 3.25 | 3 | 17,960 | 397,056 | 27 |
| idr0010-doil-dnadamage | Human | RNAi screen | 1 | 56,832 | 0.08 | 2 | 18,675 | 56,832 | 46 |
| idr0011-ledesmafernandez-dad4 | S. cerevisiae | Gene deletion screen | 5 | 8,957 | 0.4 | 1 | 5,209 | 8,736 | NA |
| idr0012-fuchs-cellmorph | Human | RNAi screen | 1 | 45,692 | 0.38 | 18 | 16,701 | 26,112 | 39 |
| idr0013-neumann-mitocheck | Human | RNAi screen | 2 | 200,995 | 14.54 | 18 | 18,393 | 206,592 | 4 |
| idr0015-UNKNOWN-taraoceans | Multi-species | Geographic screen | 1 | 32,776 | 2.49 | 0 | 84 | 84 | 47 |
| idr0016-wawer- bioactivecompoundprofiling | Human | Small molecule screen | 1 | 869,820 | 3.19 | 2 | 29,542 | 144,000 | 48 |
| idr0017-breinig-drugscreen | Human | Small molecule screen | 1 | 147,456 | 2.48 | 0 | 1,281 | 36,864 | 49 |
| idr0018-neff-histopathology | Mus musculus | Histopathology of gene knockouts | 1 | 899 | 0.27 | 48 | 9 | 248 | — |
| idr0019-sero-nfkappab | Human | HCS image analysis | 1 | 25,872 | 0.03 | 0 | 198 | 2,156 | 50 |
| idr0020-barr-chtog | Human | RNAi screen | 1 | 36,960 | 0.03 | 2 | 241 | 1,232 | 51 |
| idr0021-lawo- pericentriolarmaterial | Human | Protein localization using 3D-SIM | 1 | 414 | 0.0003 | 1 | 9 | 414 | 52 |
| idr0023-szymborska- nuclearpore | Human | Protein localization using dSTORM | 1 | 524 | 0.0005 | 1 | 7 | 359 | 53 |
| idr0027-dickerson- chromatin | S. cerevisiae | 3D-tracking of tagged chromatin loci | 1 | 229 | 0.03 | 0 | 8 | 112 | 54 |
| idr0028-pascualvargas-rhogtpases | Human | RNAi screen | 4 | 155,332 | 0.18 | 9 | 170 | 5,544 | 55 |
| idr0032-yang-meristem | Arabidopsis thaliana | In situ hybridization | 1 | 458 | 0.003 | 5 | 115 | 115 | 56 |
| Sum | 35 | 2,538,777 | 42 | 224 | 161,119 | 1,002,328 | |||
| Average | 105,782 | 1.73 | 9 | 6,713 | 41,764 |
aThe number of submitted phenotypes.
bThe number of genes, compounds or proteins identified as targets for analysis.
cThe number of individual wells (in HCS studies) or imaging experiments (in nonscreen data sets). NA, not applicable (unpublished data).
Table 2.
Example URLs and views of IDR data sets
Genetic, chemical and functional annotation in IDR
To enable querying across data sets in IDR, we have included annotations describing experimental perturbations (such as genetic mutants, siRNA targets and reagents, expressed proteins, cell lines and drugs) and phenotypes declared by study authors either from quantitative analysis or visual inspection of image data. Where possible, experimental metadata in IDR link to authoritative external resources (such as Ensembl, NCBI or PubChem).
Many of the studies in IDR perturb gene function by mutation or siRNA depletion. To calculate the sampling of gene orthologs, we used Ensembl's BioMart resource15 to access a normalized list of gene orthologs. Overall, 19,601 gene orthologs are sampled; of these, 84.1% are sampled more than 20 times and 90.3% are sampled in three or more studies. Even in this early incarnation, the phenotypes of perturbations in the majority of known genes are sampled in several assays and organisms.
We normalized the phenotypes included in studies submitted to IDR. Functional annotations were converted to defined terms in the Cellular Microscopy Phenotype Ontology (CMPO)16 or other ontologies, in collaboration with the data submitters. Overall, 88% of the functional annotations have links to defined, published controlled vocabularies. IDR includes 158 ontology-normalized phenotypes (for example, 'increased number of actin filaments' and 'mitosis arrested'), and 136 are reported in only one study. Nonetheless, these phenotypes were well sampled, with an average of 698 samples per phenotype across HCSs and other imaging data sets, and a median of 144. This skewing occurs because some phenotypes are very common or over-represented in specific assays, for example, 'protein localized in cytosol phenotype' (CMPO_0000393). Nonetheless, several phenotypes were observed in multiple orthogonal assays (e.g., 'round cell' (CMPO_0000118) and 'increased nuclear size' (CMPO_0000140)). Figure 1 summarizes the sampling of phenotypes across the current IDR data sets. Several classes of phenotypes are included, and many cases are sampled in thousands of experiments. In total, IDR includes >1 million individual experiments (Table 1), ∼9% of which are annotated with experimentally observed phenotypes.
Figure 1. Sampling of phenotypes in the IDR.

Each sample represents a well from a microwell plate in a screen or an image from a data set. Wells annotated as controls were not included. User-submitted phenotype terms were mapped to the CMPO terms shown here. Colors represent higher-level groupings of phenotype terms. Point size represents the number of studies each phenotype is linked to (1, 2, 3 or 4 studies).
Data visualization in IDR
IDR integrates image data and metadata from several studies. The current IDR web user interface (WUI) is based on OMERO.web, an open-source application17, and is supplemented with a plugin allowing data sets to be viewed by study, genes, phenotypes, siRNAs, antibodies, compounds and organisms (Supplementary Note). This architecture makes the integrated data resource available for access and reuse in several ways (Supplementary Note). Image data are viewable as thumbnails for each study, and multidimensional images can be viewed and browsed. Tiled whole-slide images used in histopathology are also supported. Any regions of interest (ROIs) submitted with the image data are included and linked and, where possible, made available through the IDR WUI. IDR images, thumbnails and metadata are accessible through the IDR WUI and web-based API in JSON format (Supplementary Note). They also can be embedded into other pages (e.g., Euro-BioImaging, (https://www.eurobioimaging-interim.eu/image-data-resource.html) using the OMERO.web gateway.
Standardized interfaces for imaging metadata
IDR integrates imaging data from many studies. These data were acquired by various imaging modalities, in the absence of overarching standards for experimental, imaging or analytic metadata. While efforts such as MIACA (http://miaca.sourceforge.net/), NeuroVault18, MULTIMOT19 have proposed data standards in specific imaging subdomains, there is not yet a metadata standard that crosses all the imaging domains potentially served by IDR. We therefore sought to adopt lightweight methods from other communities that have had broad acceptance20 and converted metadata submitted in custom formats—spreadsheets, PDFs, MySQL databases and Microsoft Word documents—into a consistent tabular format, inspired by the MAGE-TAB and ISA-TAB specifications21,22, that could then be used for importing semistructured metadata such as gene and ontology identifiers into OMERO23. We also used the Bio-Formats software library to identify and convert well-defined, semantically typed elements that describe imaging metadata (for example, image pixel size) as specified in the OME Data Model24,25, and we used the resulting translation scripts to integrate data sets into a single resource. The scripts are publicly available (Online Methods) and thus comprise a framework for recognizing and reading a range of metadata types across several imaging domains into a common, open specification.
Added value of IDR
Because IDR links gene names and phenotypes, query results that combine genes and phenotypes across multiple studies are possible through simple text-based search. Searching for the gene SGOL1 (https://idr.openmicroscopy.org/mapr/gene/?value=SGOL1) returns a range of phenotypes from four studies associated with mitotic defects (for example, CMPO_0000118, CMPO_0000305, CMPO_0000212 and CMPO_0000344)4,26 but also an accelerated secretion phenotype (CMPO_0000246) in a screen for defects in protein secretion27. A second example is provided in a histopathology study of tissue phenotypes in a series of mouse mutants. Knockout of Car4, which encodes carbonic anhydrase 4 in mouse, results in a range of defects in homeostasis in the brain, rib growth and male fertility28,29,30. Data in IDR show abnormal nuclear phenotypes in several tissues from Car4−/− mice, including gastrointestinal (https://idr.openmicroscopy.org/webclient/?show=dataset-153), liver (https://idr.openmicroscopy.org/webclient/?show=image-1918940) and male reproductive tract (https://idr.openmicroscopy.org/webclient/?show=image-1918953). The human ortholog, CA4, is involved in certain forms of retinitis pigmentosa31,32. Data in IDR from the MitoCheck study show that siRNA-mediated depletion of CA4 in HeLa cells4 also results in abnormally shaped nuclei (https://idr.openmicroscopy.org/webclient/?show=well-828419), consistent with a defect in some aspect of the cell division cycle.
Phenotypes across distinct studies can also be used to build novel representations of gene networks. Figure 2a shows the gene network created when knockouts or knockdowns that caused an elongated cell phenotype (CMPO_0000077) in Schizosaccharomyces pombe and human cells are linked by queries to String DB33 and visualized in Cytoscape34 (Supplementary Note and Supplementary Table 1). The genes discovered in the three studies form nonoverlapping, complementary networks that connect specific macromolecular complexes to the elongated cell phenotype. For example, HELZ2, MED30, MED18 and MED20 are all part of the mediator complex but were identified as 'elongated cell' hits in separate studies using different biological models (idr0001-A, idr0008-B and idr0012-A) (Fig. 2b). POLR2G (idr0012-A), PAF1 (idr0001-A) and SUPT16H (idr0008-B) were scored as elongated cell hits in these studies and are all part of the elongation complex in the RNA polymerase II transcription pathway. Finally, ASH2L (elongated cell phenotype in idr0012-A), associates with SETD1A and SETD1B (elongated cell phenotype in idr0001-A) to form the Set1 histone methyltransferase (HMT). These examples show that the individual hits are probably not due to off-target effects or characteristics of individual biological models but arise through conserved, specific functions of large macromolecular complexes.
Figure 2. Network analysis of genes linked to the elongated cell phenotype in the IDR.
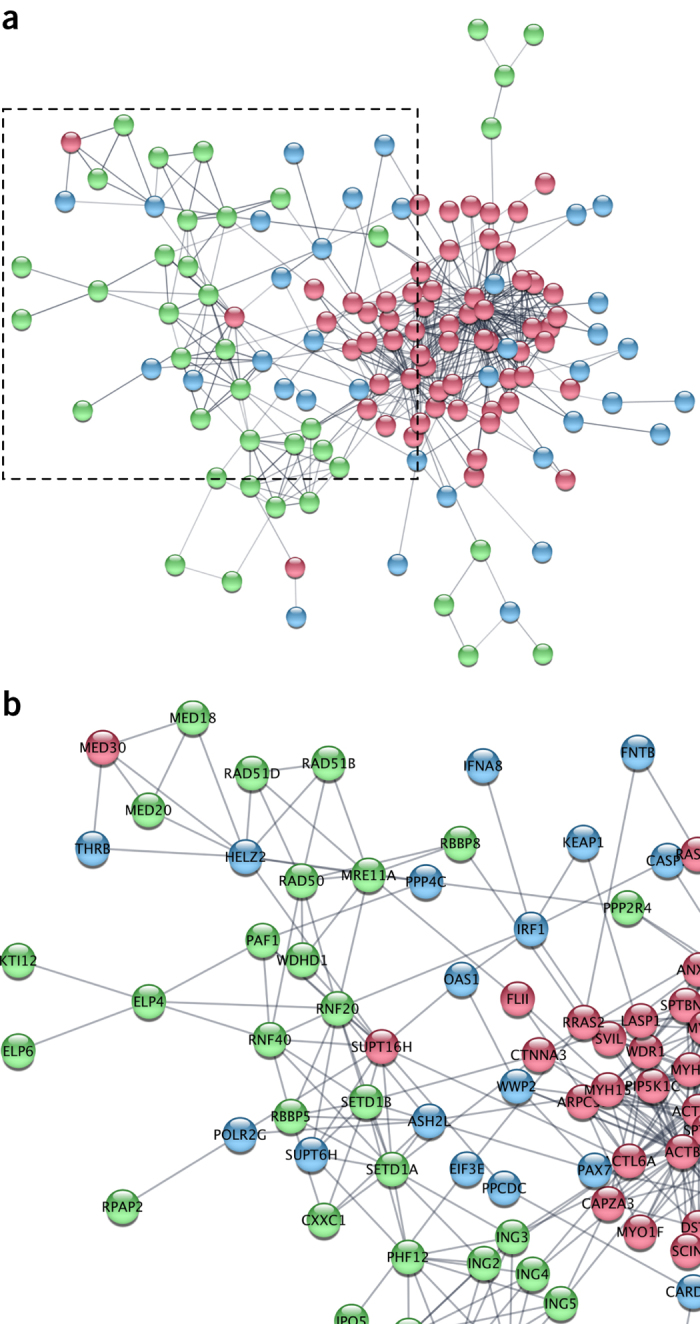
(a) Protein–protein interaction network based on the genes linked to the elongated cell phenotype (CMPO_0000077) in three IDR studies. Genes from S. pombe (green, idr0001-A)5, HeLa cell morphology (blue, idr0012-A)39 and HeLa Actinome (red, idr0008-B)40 are displayed with linkages (gray) from StringDB33. To enable comparisons in Cytoscape, the human orthologs of S. pombe genes are used for the genes identified in idr0001-A (Supplementary Note). (b) Close-up view of network in a. Genes are listed in Supplementary Note.
The integration of experimental, imaging and analytic metadata also provides an opportunity to include new functionalities for data visualization and analysis, adding further value to the original studies and data sets. We have added the data analytics tool Mineotaur35 to one of IDR's data sets (https://idr.openmicroscopy.org/mineotaur/). This allows visual querying and analysis of quantitative feature data. For instance, having shown that components of the Set1 HMT function in controlling cell morphology in S. pombe and human cells, we noticed that genes such as ASH2L were in the 'elongated cell' network based on human cell data (idr0012-A) but not S. pombe data. We noted that ash2 has a microtubule cytoskeleton phenotype (https://idr.openmicroscopy.org/webclient/?show=well-592371), then we queried the criteria used for cell shape hits in the Sysgro screen (idr0001-A) and found that ash2 fell just below the cutoff originally used in this study to define phenotypic hits for cell shape (Supplementary Note). When combined with results on ASH2L from HeLa cells (Fig. 2b) these results suggest that the Set1 HMT has a strongly conserved role in controlling cell shape and the cytoskeleton in unicellular and multicellular organisms.
Data integration and access
Like most modern online resources, IDR makes data available through a web user interface as well as a web-based JSON API. This encourages third parties to make use of IDR on their own sites. For example, image data in IDR have been linked to study data in BioStudies (for example, BioStudies S-EPMC4704494) and to PhenoImageShare36, an online phenotypic repository (http://www.phenoimageshare.org/search/?term=&hostName=Image+Data+Repository+(IDR)).
To further extend the possibilities for reuse of IDR data, we are calculating comprehensive sets of feature vectors of IDR image data using the open-source tool WND-CHARM37. To date, full WND-CHARM features have been calculated for images in idr0002-A, idr0005-A, idr0008-B, idr0009-A, idr0009-B and idr0012-A and for parts of idr0013-A and idr0013-B. Features are stored in IDR using OMERO's HDF5-based data store and available through the OMERO API (Supplementary Note).
The integration of image-based phenotypes and calculated features makes IDR an attractive candidate for computational reanalysis. To ease the access to IDR's TB-scale data sets, we have connected IDR to a Jupyter notebook-based computational resource (https://idr.openmicroscopy.org/jupyter) that exposes IDR data sets via an API (https://idr.openmicroscopy.org/about/api.html). We include example notebooks that provide visualization of image features using PCA, access to images annotated with CMPO phenotypes, calculations of gene networks and WND-CHARM features for individual images and recreation of Figures 1 and 2 from IDR data. Users can also run their own analyses using notebooks stored in GitHub (https://github.com/IDR/idr-notebooks). To allow reuse of IDR metadata locally, we have made all IDR databases, metadata and thumbnails available for download and have built Ansible scripts that automate deployment of the IDR software stack (original image data are not included; see Supplementary Note).
Discussion
Making data public and available is a critical part of the scientific enterprise38. To help facilitate the reuse and meta-analysis of image data sets, we have built IDR, a next-generation data technology that integrates and publishes image data and metadata from a wide range of imaging modalities and scales in a consistent format. IDR integrates experimental, imaging, phenotypic and analytic metadata from several independent studies into a single resource, allowing new modes of biological Big Data querying and analysis. As more data sets are added to IDR, they will potentiate and catalyze the generation of new biological hypotheses and discoveries.
In IDR, we have linked image metadata from several independent studies. Experimental, imaging phenotypic and analytic metadata are recorded in a consistent format. Rather than attempting to enforce a strict imaging data standard, IDR provides tools for supporting community formats and releases these as a framework that facilitates data reuse. We hope that the availability of this framework will provide incentives for others to structure metadata in shareable formats that can be read into IDR or other applications. In the future, we can imagine that these and other capabilities could be extended in IDR—or similar repositories that link to IDR—to enable systematic integration, visualization and analytics across imaging studies, thereby helping to harness and capitalize on the increasing amounts of bioimaging data that the community generates.
As of this writing, IDR has published 35 reference image data sets grouped into 24 studies (Table 1) and, using EMBL-EBI's Embassy Cloud, has the capacity to receive and publish many more. Authors can submit image data sets for publication in IDR using the metadata specifications and formats we have built (details about the submission process are available at https://idr.openmicroscopy.org/about/submission.html). Once published, the data sets can be browsed and viewed through IDR's WUI or queried and reanalyzed using the IDR computational resource.
IDR software and technology is open source, so it can be accessed and built into other systems for image data publication. This supports the building of technology and installations that integrate and publish bioimaging data for the scientific community. IDR therefore functions both as a resource for image data publication and as a technology platform that supports online scientific image databases and services. In the future, those databases and services may amalgamate to form resources analogous to the genomic resources that are the foundation of much of modern biology.
Methods
Architecture and population of IDR.
IDR (https://idr.openmicroscopy.org) was built using open-source OMERO17 and Bio-Formats24 as a foundation. Deployments are managed by Ansible playbooks along with re-usable roles on an OpenStack-based cloud contained within the EMBL-EBI Embassy resource. Data sets (Table 1) were collected by shipped USB drive or transferred by Aspera. Included data sets were selected according to the criteria defined by the Euro-BioImaging/Elixir Data Strategy concept of reference images (http://www.eurobioimaging.eu/content-news/euro-bioimaging-elixir-image-data-strategy), which states that image data sets for publication should be related to published studies, linked as much as possible to other resources and candidates for reuse, reanalysis and/or integration with other studies.
Experimental and analytic metadata were submitted in spreadsheets (CSV, XLS), PDF or HDF5 format or a MySQL database, each using its own custom format. We converted these custom formats to a consistent tabular format inspired by the MAGE and ISA-TAB specifications21,22 and combined them into a single CSV file using a custom script and imported into OMERO. Imaging metadata and binary data were imported into OMERO using Bio-Formats. Experimental and analytic metadata were stored using OMERO.tables, an HDF5-backed tabular data store used by OMERO. For each data set, metadata that were valuable for querying and search were copied to OMERO's key-value-based Map Annotation facility23. This means that different metadata types and elements can be accessed using different parts of the OMERO API, depending on the search and querying capabilities they require. For more information on the construction of queries, see Supplementary Note.
Code availability.
All software for building and running the IDR and reading metadata of the IDR data sets is open source and available at https://github.com/IDR and https://github.com/openmicroscopy. The custom scripts used to combine metadata into a single CSV files are available at https://github.com/IDR/idr-metadata.
Data availability.
All data sets described in this paper are available at https://idr.openmicroscopy.org.
Additional information
Publisher's note: Springer Nature remains neutral with regard to jurisdictional claims in published maps and institutional affiliations.
Supplementary information
Supplementary Note. (PDF 1279 kb)
Genes linked to the elongated cell phenotype in IDR. (XLSX 21 kb)
Acknowledgements
We thank all the study authors who submitted data sets for inclusion in the IDR for their contributions and help in incorporating their data sets. We also thank the systems support team at EMBL-EBI, in particular R. Boyce, D. Ocana, C. Short and A. Cafferkey for their support of the project's use of the Embassy Cloud. We are particularly grateful to S. Jupp for help with adding and defining new ontology terms. The IDR project was funded by the BBSRC (BB/M018423/1 to J.R.S., A.B. and R.E.C.S.) and Horizon 2020 Framework Programme of the European Union under grant agreement 688945 (Euro-BioImaging Prep Phase II to J.R.S. and A.B.). Updates to OMERO and Bio-Formats were supported by awards to J.R.S. from the Wellcome Trust (095931/Z/11/Z) and Horizon 2020 Framework Programme of the European Union under grant agreement 634107 (MULTIMOT). R.E.C.S. was funded by a BBSRC Responsive Mode grant (BB/K006320/1), a European Research Council Starting Researcher Investigator Grant (SYSGRO) and the University of Bristol.
Author Contributions
J.R.S., A.B. and R.E.C.S. conceived and funded the project, which was overseen by J.R.S. J.M. designed the software architecture and managed the software development team; S.W.L. built all the tools for deploying IDR in the OpenStack cloud and ran all the IDR systems; A.T. built Mapr, the metadata querying application, and updated the IDR web stack; S.L. updated Bio-Formats to read the incoming data sets and, along with S.W.L, developed and ran the feature calculation software; E.W. performed all data curation and annotation. G.R., S.W.L. and E.W. sourced and received the data sets. A.C. analyzed features of the integrated data sets. B.A. helped with the IDR–Mineotaur integration. R.K.F. designed the updates to the OMERO user interface. U.S. helped with the integration of IDR data sets into BioStudies.
Competing interests
J.R.S. is affiliated with Glencoe Software, Inc., an open-source US-based commercial company that provides commercial licenses for OME software.
Footnotes
Eleanor Williams, Josh Moore and Simon W Li: These authors contributed equally to this work.
Change history
10/4/2018
This paper was originally published under standard Nature America Inc. copyright. As of the date of this correction, the Resource is available online as an open-access paper with a CC-BY license. No other part of the paper has been changed.
References
- 1.Uhlén M, et al. Proteomics. Tissue-based map of the human proteome. Science. 2015;347:1260419. doi: 10.1126/science.1260419. [DOI] [PubMed] [Google Scholar]
- 2.Hawrylycz MJ, et al. An anatomically comprehensive atlas of the adult human brain transcriptome. Nature. 2012;489:391–399. doi: 10.1038/nature11405. [DOI] [PMC free article] [PubMed] [Google Scholar]
- 3.Armit C, et al. eMouseAtlas, EMAGE, and the spatial dimension of the transcriptome. Mamm. Genome. 2012;23:514–524. doi: 10.1007/s00335-012-9407-1. [DOI] [PMC free article] [PubMed] [Google Scholar]
- 4.Neumann B, et al. Phenotypic profiling of the human genome by time-lapse microscopy reveals cell division genes. Nature. 2010;464:721–727. doi: 10.1038/nature08869. [DOI] [PMC free article] [PubMed] [Google Scholar]
- 5.Graml V, et al. A genomic Multiprocess survey of machineries that control and link cell shape, microtubule organization, and cell-cycle progression. Dev. Cell. 2014;31:227–239. doi: 10.1016/j.devcel.2014.09.005. [DOI] [PMC free article] [PubMed] [Google Scholar]
- 6.Koh JL, et al. CYCLoPs: a comprehensive database constructed from automated analysis of protein abundance and subcellular localization patterns in Saccharomyces cerevisiae. G3 (Bethesda) 2015;5:1223–1232. doi: 10.1534/g3.115.017830. [DOI] [PMC free article] [PubMed] [Google Scholar]
- 7.Gönczy P, et al. Functional genomic analysis of cell division in C. elegans using RNAi of genes on chromosome III. Nature. 2000;408:331–336. doi: 10.1038/35042526. [DOI] [PubMed] [Google Scholar]
- 8.Fowlkes CC, et al. A quantitative spatiotemporal atlas of gene expression in the Drosophila blastoderm. Cell. 2008;133:364–374. doi: 10.1016/j.cell.2008.01.053. [DOI] [PubMed] [Google Scholar]
- 9.Lawson CL, et al. EMDataBank.org: unified data resource for CryoEM. Nucleic Acids Res. 2011;39:D456–D464. doi: 10.1093/nar/gkq880. [DOI] [PMC free article] [PubMed] [Google Scholar]
- 10.Orloff DN, Iwasa JH, Martone ME, Ellisman MH, Kane CM. The cell: an image library-CCDB: a curated repository of microscopy data. Nucleic Acids Res. 2013;41:D1241–D1250. doi: 10.1093/nar/gks1257. [DOI] [PMC free article] [PubMed] [Google Scholar]
- 11.Iudin A, Korir PK, Salavert-Torres J, Kleywegt GJ, Patwardhan A. EMPIAR: a public archive for raw electron microscopy image data. Nat. Methods. 2016;13:387–388. doi: 10.1038/nmeth.3806. [DOI] [PubMed] [Google Scholar]
- 12.McEntyre J, Sarkans U, Brazma A. The BioStudies database. Mol. Syst. Biol. 2015;11:847. doi: 10.15252/msb.20156658. [DOI] [PMC free article] [PubMed] [Google Scholar]
- 13.Petryszak R, et al. Expression Atlas update—an integrated database of gene and protein expression in humans, animals and plants. Nucleic Acids Res. 2016;44:D746–D752. doi: 10.1093/nar/gkv1045. [DOI] [PMC free article] [PubMed] [Google Scholar]
- 14.UniProt Consortium. UniProt: a hub for protein information. Nucleic Acids Res.43, D204–D212 (2015). [DOI] [PMC free article] [PubMed]
- 15.Yates A, et al. Ensembl 2016. Nucleic Acids Res. 2016;44:D710–D716. doi: 10.1093/nar/gkv1157. [DOI] [PMC free article] [PubMed] [Google Scholar]
- 16.Jupp S, et al. The cellular microscopy phenotype ontology. J. Biomed. Semantics. 2016;7:28. doi: 10.1186/s13326-016-0074-0. [DOI] [PMC free article] [PubMed] [Google Scholar]
- 17.Allan C, et al. OMERO: flexible, model-driven data management for experimental biology. Nat. Methods. 2012;9:245–253. doi: 10.1038/nmeth.1896. [DOI] [PMC free article] [PubMed] [Google Scholar]
- 18.Gorgolewski KJ, et al. NeuroVault.org: a web-based repository for collecting and sharing unthresholded statistical maps of the human brain. Front. Neuroinform. 2015;9:8. doi: 10.3389/fninf.2015.00008. [DOI] [PMC free article] [PubMed] [Google Scholar]
- 19.Masuzzo P, et al. An open data ecosystem for cell migration research. Trends Cell Biol. 2015;25:55–58. doi: 10.1016/j.tcb.2014.11.005. [DOI] [PubMed] [Google Scholar]
- 20.Brazma A, Krestyaninova M, Sarkans U. Standards for systems biology. Nat. Rev. Genet. 2006;7:593–605. doi: 10.1038/nrg1922. [DOI] [PubMed] [Google Scholar]
- 21.Sansone SA, et al. Toward interoperable bioscience data. Nat. Genet. 2012;44:121–126. doi: 10.1038/ng.1054. [DOI] [PMC free article] [PubMed] [Google Scholar]
- 22.Rayner TF, et al. A simple spreadsheet-based, MIAME-supportive format for microarray data: MAGE-TAB. BMC Bioinformatics. 2006;7:489. doi: 10.1186/1471-2105-7-489. [DOI] [PMC free article] [PubMed] [Google Scholar]
- 23.Li S, et al. Metadata management for high content screening in OMERO. Methods. 2016;96:27–32. doi: 10.1016/j.ymeth.2015.10.006. [DOI] [PMC free article] [PubMed] [Google Scholar]
- 24.Linkert M, et al. Metadata matters: access to image data in the real world. J. Cell Biol. 2010;189:777–782. doi: 10.1083/jcb.201004104. [DOI] [PMC free article] [PubMed] [Google Scholar]
- 25.Goldberg IG, et al. The Open Microscopy Environment (OME) Data Model and XML file: open tools for informatics and quantitative analysis in biological imaging. Genome Biol. 2005;6:R47. doi: 10.1186/gb-2005-6-5-r47. [DOI] [PMC free article] [PubMed] [Google Scholar]
- 26.Hériché JK, et al. Integration of biological data by kernels on graph nodes allows prediction of new genes involved in mitotic chromosome condensation. Mol. Biol. Cell. 2014;25:2522–2536. doi: 10.1091/mbc.E13-04-0221. [DOI] [PMC free article] [PubMed] [Google Scholar]
- 27.Simpson JC, et al. Genome-wide RNAi screening identifies human proteins with a regulatory function in the early secretory pathway. Nat. Cell Biol. 2012;14:764–774. doi: 10.1038/ncb2510. [DOI] [PubMed] [Google Scholar]
- 28.Shah GN, et al. Carbonic anhydrase IV and XIV knockout mice: roles of the respective carbonic anhydrases in buffering the extracellular space in brain. Proc. Natl. Acad. Sci. USA. 2005;102:16771–16776. doi: 10.1073/pnas.0508449102. [DOI] [PMC free article] [PubMed] [Google Scholar]
- 29.Scheibe RJ, et al. Carbonic anhydrases IV and IX: subcellular localization and functional role in mouse skeletal muscle. Am. J. Physiol. Cell Physiol. 2008;294:C402–C412. doi: 10.1152/ajpcell.00228.2007. [DOI] [PubMed] [Google Scholar]
- 30.Wandernoth PM, et al. Role of carbonic anhydrase IV in the bicarbonate-mediated activation of murine and human sperm. PLoS One. 2010;5:e15061. doi: 10.1371/journal.pone.0015061. [DOI] [PMC free article] [PubMed] [Google Scholar]
- 31.Rebello G, et al. Apoptosis-inducing signal sequence mutation in carbonic anhydrase IV identified in patients with the RP17 form of retinitis pigmentosa. Proc. Natl. Acad. Sci. USA. 2004;101:6617–6622. doi: 10.1073/pnas.0401529101. [DOI] [PMC free article] [PubMed] [Google Scholar]
- 32.Yang Z, et al. Mutant carbonic anhydrase 4 impairs pH regulation and causes retinal photoreceptor degeneration. Hum. Mol. Genet. 2005;14:255–265. doi: 10.1093/hmg/ddi023. [DOI] [PubMed] [Google Scholar]
- 33.Szklarczyk D, et al. STRING v10: protein-protein interaction networks, integrated over the tree of life. Nucleic Acids Res. 2015;43:D447–D452. doi: 10.1093/nar/gku1003. [DOI] [PMC free article] [PubMed] [Google Scholar]
- 34.Cline MS, et al. Integration of biological networks and gene expression data using Cytoscape. Nat. Protoc. 2007;2:2366–2382. doi: 10.1038/nprot.2007.324. [DOI] [PMC free article] [PubMed] [Google Scholar]
- 35.Antal B, Chessel A, Carazo Salas RE. Mineotaur: a tool for high-content microscopy screen sharing and visual analytics. Genome Biol. 2015;16:283. doi: 10.1186/s13059-015-0836-5. [DOI] [PMC free article] [PubMed] [Google Scholar]
- 36.Adebayo S, et al. PhenoImageShare: an image annotation and query infrastructure. J. Biomed. Semantics. 2016;7:35. doi: 10.1186/s13326-016-0072-2. [DOI] [PMC free article] [PubMed] [Google Scholar]
- 37.Orlov N, et al. WND-CHARM: Multi-purpose image classification using compound image transforms. Pattern Recognit. Lett. 2008;29:1684–1693. doi: 10.1016/j.patrec.2008.04.013. [DOI] [PMC free article] [PubMed] [Google Scholar]
- 38.Boulton G, Rawlins M, Vallance P, Walport M. Science as a public enterprise: the case for open data. Lancet. 2011;377:1633–1635. doi: 10.1016/S0140-6736(11)60647-8. [DOI] [PubMed] [Google Scholar]
- 39.Fuchs F, et al. Clustering phenotype populations by genome-wide RNAi and multiparametric imaging. Mol. Syst. Biol. 2010;6:370. doi: 10.1038/msb.2010.25. [DOI] [PMC free article] [PubMed] [Google Scholar]
- 40.Rohn JL, et al. Comparative RNAi screening identifies a conserved core metazoan actinome by phenotype. J. Cell Biol. 2011;194:789–805. doi: 10.1083/jcb.201103168. [DOI] [PMC free article] [PubMed] [Google Scholar]
- 41.Breker M, Gymrek M, Schuldiner M. A novel single-cell screening platform reveals proteome plasticity during yeast stress responses. J. Cell Biol. 2013;200:839–850. doi: 10.1083/jcb.201301120. [DOI] [PMC free article] [PubMed] [Google Scholar]
- 42.Thorpe PH, Alvaro D, Lisby M, Rothstein R. Bringing Rad52 foci into focus. J. Cell Biol. 2011;194:665–667. doi: 10.1083/jcb.201108095. [DOI] [PMC free article] [PubMed] [Google Scholar]
- 43.Toret CP, D'Ambrosio MV, Vale RD, Simon MA, Nelson WJ. A genome-wide screen identifies conserved protein hubs required for cadherin-mediated cell–cell adhesion. J. Cell Biol. 2014;204:265–279. doi: 10.1083/jcb.201306082. [DOI] [PMC free article] [PubMed] [Google Scholar]
- 44.Fong KW, et al. Whole-genome screening identifies proteins localized to distinct nuclear bodies. J. Cell Biol. 2013;203:149–164. doi: 10.1083/jcb.201303145. [DOI] [PMC free article] [PubMed] [Google Scholar]
- 45.Srikumar T, et al. Global analysis of SUMO chain function reveals multiple roles in chromatin regulation. J. Cell Biol. 2013;201:145–163. doi: 10.1083/jcb.201210019. [DOI] [PMC free article] [PubMed] [Google Scholar]
- 46.Doil C, et al. RNF168 binds and amplifies ubiquitin conjugates on damaged chromosomes to allow accumulation of repair proteins. Cell. 2009;136:435–446. doi: 10.1016/j.cell.2008.12.041. [DOI] [PubMed] [Google Scholar]
- 47.Karsenti E, et al. A holistic approach to marine eco-systems biology. PLoS Biol. 2011;9:e1001177. doi: 10.1371/journal.pbio.1001177. [DOI] [PMC free article] [PubMed] [Google Scholar]
- 48.Wawer MJ, et al. Toward performance-diverse small-molecule libraries for cell-based phenotypic screening using multiplexed high-dimensional profiling. Proc. Natl. Acad. Sci. USA. 2014;111:10911–10916. doi: 10.1073/pnas.1410933111. [DOI] [PMC free article] [PubMed] [Google Scholar]
- 49.Breinig M, Klein FA, Huber W, Boutros M. A chemical-genetic interaction map of small molecules using high-throughput imaging in cancer cells. Mol. Syst. Biol. 2015;11:846. doi: 10.15252/msb.20156400. [DOI] [PMC free article] [PubMed] [Google Scholar]
- 50.Sero JE, et al. Cell shape and the microenvironment regulate nuclear translocation of NF-κB in breast epithelial and tumor cells. Mol. Syst. Biol. 2015;11:790. doi: 10.15252/msb.20145644. [DOI] [PMC free article] [PubMed] [Google Scholar]
- 51.Barr AR, Bakal C. A sensitised RNAi screen reveals a ch-TOG genetic interaction network required for spindle assembly. Sci. Rep. 2015;5:10564. doi: 10.1038/srep10564. [DOI] [PMC free article] [PubMed] [Google Scholar]
- 52.Lawo S, Hasegan M, Gupta GD, Pelletier L. Subdiffraction imaging of centrosomes reveals higher-order organizational features of pericentriolar material. Nat. Cell Biol. 2012;14:1148–1158. doi: 10.1038/ncb2591. [DOI] [PubMed] [Google Scholar]
- 53.Szymborska A, et al. Nuclear pore scaffold structure analyzed by super-resolution microscopy and particle averaging. Science. 2013;341:655–658. doi: 10.1126/science.1240672. [DOI] [PubMed] [Google Scholar]
- 54.Dickerson D, et al. High resolution imaging reveals heterogeneity in chromatin states between cells that is not inherited through cell division. BMC Cell Biol. 2016;17:33. doi: 10.1186/s12860-016-0111-y. [DOI] [PMC free article] [PubMed] [Google Scholar]
- 55.Pascual-Vargas P, et al. RNAi screens for Rho GTPase regulators of cell shape and YAP/TAZ localisation in triple negative breast cancer. Sci. Data. 2017;4:170018. doi: 10.1038/sdata.2017.18. [DOI] [PMC free article] [PubMed] [Google Scholar]
- 56.Yang W, et al. Regulation of meristem morphogenesis by cell wall synthases in Arabidopsis. Curr. Biol. 2016;26:1404–1415. doi: 10.1016/j.cub.2016.04.026. [DOI] [PMC free article] [PubMed] [Google Scholar]
Associated Data
This section collects any data citations, data availability statements, or supplementary materials included in this article.
Supplementary Materials
Supplementary Note. (PDF 1279 kb)
Genes linked to the elongated cell phenotype in IDR. (XLSX 21 kb)
Data Availability Statement
All data sets described in this paper are available at https://idr.openmicroscopy.org.