

Abstract
The familial aggregation indicated the inheritance of cancer risk. Recent genome-wide association studies (GWAS) have identified a number of common single nucleotide polymorphisms (SNPs). Following heritability analyses have shown that SNPs could explain a moderate amount of variance for different cancer phenotypes among Caucasians. However, little information was available in Chinese population. We performed a genome-wide complex trait analysis (GCTA) for common cancers at nine anatomical sites in Chinese population (14,629 cancer cases vs. 17,554 controls) and estimated the heritability of these cancers based on the common SNPs. We found that common SNPs explained certain amount of heritability with significance for all nine cancer sites: gastric cancer (20.26%), esophageal squamous cell carcinoma (19.86%), colorectal cancer (16.30%), lung cancer (15.17%), and epithelial ovarian cancer (13.31%), and a similar heritability around 10% for Hepatitis B virus (HBV)-related hepatocellular carcinoma, prostate cancer, breast cancer and nasopharyngeal carcinoma. We found that nearly or less than 25% change was shown when removing the regions expanding 250kb or 500kb up and downwards of the GWAS-reported SNPs. We also found strong linear correlations between variance partitioned by each chromosome and chromosomal length only for lung cancer (R2=0.641, P=0.001) and esophageal squamous cell cancer (R2=0.633, P=0.002), which implied us the complex heterogeneity of cancers. These results indicate polygenic genetic architecture of the nine common cancers in Chinese population. Further efforts should be made to discover the hidden heritability of different cancer types among Chinese.
Keywords: Cancer, heritability, Single Nucleotide polymorphisms (SNPs), Chinese population, genome-wide complex trait analysis (GCTA)
Introduction
Cancer remains to be a heavy burden in both developed and developing countries. Approximately 14.1 million new cases and 8.2 million deaths emerged in 2012 worldwide according to GLOBOCAN estimates 1. Both environmental and genetic components have been proved to contribute to cancer susceptibility 2, 3. Previous studies have consistently demonstrated that almost every cancer exhibit familial aggregation 4-7. Twin studies have revealed a certain amount of heritability for some cancers such as lung cancer (LC) (18%), gastric cancer (GC) (22%), ovarian cancer (OC) (39%), prostate cancer (PrC) (57%), colorectal cancer (CRC) (15%), and breast cancer (BrC) (31%) in Nordic countries 2, 8.
In the past years, candidate-gene studies and genome-wide association studies (GWASs) have discovered important germline variants (especially SNPs) that are associated with cancer risk using case-control designs, indicating sporadic cancers bear genetic components 9, 10. However, the variants identified so far present relatively small increments in risk, and explain only a small proportion of familial clustering (heritability) 11. The gap between the phenotypic variance explained by GWAS and those estimated by traditional heritability methods (e.g. using relatives) has been termed “missing heritability”. 11-13. Several aspects could be explained for this phenomenon, including common variants with smaller effects yet to be found, rarer variants and structural variants failed to be tagged by SNPs on the genotyping arrays, and epistasis was underestimated, etc. 11.
In recent years, heritability from numbers of common and rare causal variants mentioned above has been able to be estimated by genome-wide genotype data in unrelated individuals 14-16. Estimation results for some traits and diseases (e.g., cancer) using common SNPs could partially fill the gap of “missing heritability” 15, 17-20. However, most of the heritability estimations using GWAS array data were performed among European descendants. Due to the heterogeneity of different ethnics, it is necessary to explore the genetic architecture of common cancers in the Chinese population, figuring out how much heritability yet to be found using GWAS strategy in China.
In the current study, we performed a genome-wide complex trait analysis (GCTA) for nine common cancers with GWAS data in Chinese population and estimated the heritability explained by common SNPs in commercial GWAS arrays. We compared the differences of heritability between subgroups such as gender, smoking and drinking status, BMI, and age at menarche, which are well-defined risk factors for some of the cancers. We also regressed the variance partitioned by each chromosome with chromosomal length to dissect the genetic architecture among different cancer types.
Materials and Methods
Subjects
The study enrolled 32,183 individuals in total (14,629 cancer cases vs 17,554 controls), who participated in nine case-control GWAS studies conducted between 2008 and 2013 in Chinese population: lung cancer 21 (2,231 cases, 2774 controls; from Nanjing, Shanghai, Beijing, and Wuhan), non-cardia gastric cancer 22 (935 cases, 2046 controls; from Nanjing and Beijing), hepatitis B virus (HBV)- related hepatocellular carcinoma 23 (1518 cases, 1441 controls; from Shanghai and Guangdong), epithelial ovarian cancer 24 (1038 cases, 1158 controls; from Tianjin, Beijing, Shanghai and Nanjing), prostate cancer 25 (1401 cases, 920 controls; from Shanghai and surrounding areas), breast cancer 26 (2722 cases, 2139 controls; from Shanghai), nasopharyngeal cancer 27 (1432 cases, 913 controls; from Guangdong), esophageal squamous cell carcinoma 28 (1983 cases, 1909 controls; from Beijing), colorectal cancer 29 (1369 cases, 4254 controls, aggregated by three case-control datasets; from Shanghai and Guangzhou). Details of the subjects, SNPs and genotyping arrays for the nine cancer studies were summarized in Table 1. The detailed characteristics of the population were presented in their original papers. All study individuals provided written informed consent and each institutional review boards approved the corresponding procedures and experiments, respectively.
Table 1. Characteristics of each cancer GWAS study (post-QC).
| Cancer | Sample | Status | Gender | Smoking Status | Drinking Status | SNPs | Arrays | Reference | ||||
|---|---|---|---|---|---|---|---|---|---|---|---|---|
|
| ||||||||||||
| Cases | Controls | Male | Female | Yes | No | Yes | No | |||||
| LC | 5005 | 2231 | 2774 | 3510 | 1495 | 2605 | 2400 | NA | NA | 424288 | Affymetrix SNP Array 6.0 | (Hu et al. 2011) |
| GC | 2981 | 935 | 2046 | 2174 | 807 | 1369 | 1612 | 1202 | 1779 | 312116 | Affymetrix SNP Array 6.0 | (Shi et al. 2011) |
| HCC | 2959 | 1518 | 1441 | 2801 | 158 | 1405 | 1554 | 1114 | 1845 | 465792 | Illumina HumanOmniExpress | (Li et al. 2012) |
| OC | 2196 | 1038 | 1158 | 0 | 2196 | NA | NA | NA | NA | 633296 | Illumina HumanOmniZhongHua-8 | (Chen et al. 2014) |
| PrC | 2321 | 1401 | 920 | 2321 | 0 | NA | NA | NA | NA | 483981 | Illumina HumanOmniExpress | (Xu et al. 2012) |
| BrC | 4861 | 2722 | 2139 | 0 | 4861 | NA | NA | NA | NA | 521924 | Affymetrix SNP Array 6.0, Affymetrix Mapping 500K | (Cai et al. 2014) |
| NPC 1 | 2345 | 1432 | 913 | 1712 | 633 | 1253 | 1083 | 1045 | 1285 | 417834 | Illumina Human610-Quad | (Bei et al. 2010) |
| ESCC | 3892 | 1983 | 1909 | 3183 | 709 | 2360 | 1532 | 1970 | 1922 | 548128 | Affymetrix SNP Array 6.0 | (Wu et al. 2011) |
| CRC | 5623 | 1369 | 4254 | 1769 | 3854 | NA | NA | NA | NA | 456545/230517/234974 | Illumina Human610-Quad, Illumina HumanOmniExpress, Illumina HumanHap610, Affymetrix SNP Array 5.0, Affymetrix SNP Array 6.0 | (Zhang et al. 2014) |
There were 9 and 15 missing subjects for smoking and drinking status of NPC, respectively. NA: not available.
Quality Control
In order to reduce the influence of technical artifacts, which may contribute to the estimation of spurious genetic variation, we implemented a more stringent quality control (QC) than standard GWAS QC strategy 14, 18. Detailed exclusion criteria were listed as following: (1) individuals level: 1) call rate <95%; 2) gender discrepancies; 3) heterozygosity rate outliers (> 6 s.d.); 4) unexpected duplicates or probable relatives based on pairwise identity by descent (IBD: PI_HAT>0.05); 5) population stratification outliers based on EIGENSTRAT (> 3 s.d.). (2) SNPs level: 1) non-autosomal chromosomes; 2) call rate < 95%; 3) MAF in controls < 0.05; 4) deviated from Hardy-Weinberg Equilibrium (HWE) in controls (P<0.05); 5) missing rate discrepancies between cases and controls (P<0.05). Finally, a total of 32,183 samples for nine cancer types and the numbers of SNPs passed QC were all summarized in Table 1.
Estimation of Heritability
We used GCTA to estimate both of the genetic relationship matrix (GRM) of all the individuals and the heritability explained by the selected sets of autosomal SNPs (i.e. SNPs remained after stringent quality control based on original GWAS commercial arrays) in restricted maximum likelihood analysis. The method developed by Yang et al 14, 30 used a mixed linear model (MLM) to fit the effects of all the SNPs as random effects, regardless of whether they pass a certain significant threshold, allowing the estimation of the germline polygenetic variance. We used cancer prevalence to transform the estimated heritability from observed scale to liability scale, just as it does when estimating total heritability of liability from pedigree or twin analyses. And the cancer prevalence values in Chinese population were listed in the Supplementary Table S1, which were derived from Globocan 2012 (http://globocan.iarc.fr/Pages/fact_sheets_population.aspx). Adjusted covariates in the models were consistent with original GWAS papers (LC: age, gender and pack-year of smoking; GC, HCC and ESCC: age, gender, drinking and smoking status; CRC and NPC: age and gender; BrC: age, age of menarche, age at first birth, Body Mass Index (BMI) and education status; PrC: age; OC: age). Top 20 eigenvectors were also adjusted for population stratification in each cancer separately.
To estimate the heritability attributable to discovered loci by GWAS and also undiscovered loci, we identified SNPs in National Human Genome Research Institute (NHGRI) catalog (https://www.genome.gov/gwastudies/) that were associated with a given cancer (P < 5×10⁻⁸) (Supplementary Table S2) and defined the known regions as ± 250kb or 500kb of the significant SNPs. We estimated the GRMs from the SNPs on each chromosome and calculated the variance attributable to each chromosome by fitting the GRMs of all the chromosomes simultaneously 31. Subgroup estimation for heritability was also conducted according to gender, smoking and drinking status if these variables were available. The heterogeneity between subgroups was assessed using χ2-based Cochrane's Q test. For colorectal cancer, we combined the heritability estimations from three datasets using meta-analysis based method (Fixed effect model: inverse-variance weighting).
Results
As shown in Table 1, we analyzed heritability for cancer at nine anatomical sites in Chinese population (32,183 participants: 14,629 cancer cases vs. 17,554 controls, with CRC bearing the largest sample size of 5,623 and OC bearing the smallest sample size of 2,196). Except that OC and BrC were for only females, and PrC was for only males, 70.1%, 72.9%, 94.7%, 73.0%, 81.8%, and 31.5% of the subjects were males in LC, GC, HCC, NPC, ESCC, and CRC, separately. The proportion of smoking subjects in LC, GC, HCC, NPC, and ESCC are 52.0%, 45.9%, 47.5%, 53.4% and 60.6%, respectively. And the proportion of drinking subjects in GC, HCC, NPC, and ESCC are 40.3%, 37.6%, 44.6% and 50.6%, respectively. LC, GC, BrC, ESCC used GWAS arrays from Affymetrix while HCC, OC, PrC, NPC used arrays from Illumina, and CRC used both Affymetrix and Illumina arrays. Numbers of SNPs were ranged from 230,517 to 633,296 after quality control. Detailed information please refer to Table 1.
As shown in Table 2 and Figure 1, all the nine datasets demonstrated significant genetic components for cancer phenotypic variance (P<0.05). GC, ESCC, CRC and LC rank the first four with heritability larger than 15% [heritability (Standard Error, SE): 20.26% (3.59%), 19.86% (2.15%), 16.30% (4.21%) and 15.17% (1.99%)]. Heritability for other five cancers were ranged 10% to 15% [OC: 13.31% (4.31%); PrC: 11.20% (4.09%); HCC: 10.55% (3.31%); NPC: 10.34% (2.52%); BrC: 10.19% (2.44%)]. Similar results were presented when we removed SNPs within 250kb or 500kb on either direction of the GWAS reported significant loci (P<5×10⁻⁸). And compared with the overall heritability, nearly or less than 25% change were seen after removing known regions (±250kb and ±500kb). More obvious changes were shown for BrC (24.1%, 26.6%), NPC (21.4%, 21.2%), PrC (17.8%, 19.5%), and HCC (11.9%, 12.0%), while changes for the other 5 cancers were nearly or less than 5% (OC: 4.7%, 4.4%; ESCC: 4.2%, 6.4%; LC: 3.4%, 4.2%; CRC: 3.1%, 5.0%; GC: 3.0%, 2.6%) (Figure 1).
Table 2. Heritability explained by all autosomal SNPs for each cancer type.
| Cancer | h2 (95%CI) 1 | h2 (95%CI) 2 | h2L3 | h2r250 3 | h2r500 3 | |||
|---|---|---|---|---|---|---|---|---|
|
|
|
|
||||||
| h2L (SE) | P | h2r250 (SE) | P | h2r500 (SE) | P | |||
| LC | 0.10(0.00-0.24) | 0.12(0.06-0.18) † 0.21(0.14-0.27) ‡ |
0.152(0.020) | 3.11E-15 | 0.147(0.020) | 2.58E-14 | 0.145 (0.020) | 3.34E-14 |
| GC | 0.11(0.00-0.27) * | 0.25(0.00-0.52) | 0.203(0.036) | 4.61E-09 | 0.197(0.036) | 8.94E-09 | 0.197(0.036) | 8.00E-09 |
| HCC | NA | NA | 0.106(0.033) | 5.89E-04 | 0.093(0.033) | 2.07E-03 | 0.093(0.033) | 2.21E-03 |
| OC | 0.30(0.18-0.42) | NA | 0.133(0.043) | 8.15E-04 | 0.127(0.043) | 1.14E-03 | 0.127(0.042) | 1.04E-03 |
| PrC | 0.81(0.32-1.00) | 0.38(0.24-0.51) | 0.112(0.041) | 2.70E-03 | 0.092(0.041) | 1.08E-02 | 0.090(0.040) | 1.13E-02 |
| BrC | 0.13(0.00-0.56) | 0.10(0.00-0.20) | 0.102(0.024) | 1.28E-05 | 0.077(0.024) | 6.21E-04 | 0.075(0.024) | 8.56E-04 |
| NPC | NA | NA | 0.103(0.025) | 1.79E-05 | 0.081(0.023) | 2.15E-04 | 0.082(0.023) | 2.21E-04 |
| ESCC | 0.19(0.07-0.31) * | 0.38(0.17-0.59) | 0.199(0.022) | <1.00E-15 | 0.190(0.022) | <1.00E-15 | 0.186(0.022) | <1.00E-15 |
| CRC | 0.07(0.05-0.10) | NA | 0.163(0.042) | 1.36E-04 | 0.158(0.042) | 2.05E-04 | 0.155(0.042) | 2.23E-04 |
Yi Lu et al. estimated for lung cancer, ovarian cancer, prostate cancer, breast cancer for European population, and gastric cancer (*), esophageal squamous cancer (*) for Chinese population. Shuo Jiao et al. estimated colorectal cancer for European population.
Sampson JN et al. estimated lung cancer for Asian nonsmoking women (†) and European population (‡), esophageal cancer and stomach cancer for Asian population, prostate cancer, breast cancer for European population.
h2L is the estimated heritability on the liability scale (and SE) using all qualifying SNPs, while h2r250 and h2r500 are the heritability after removing SNPs within the region of 250kb and 500kb both up and downwards of GWAS significant SNPs (P< 5E-8) for each cancer. NA: not available.
Figure 1.
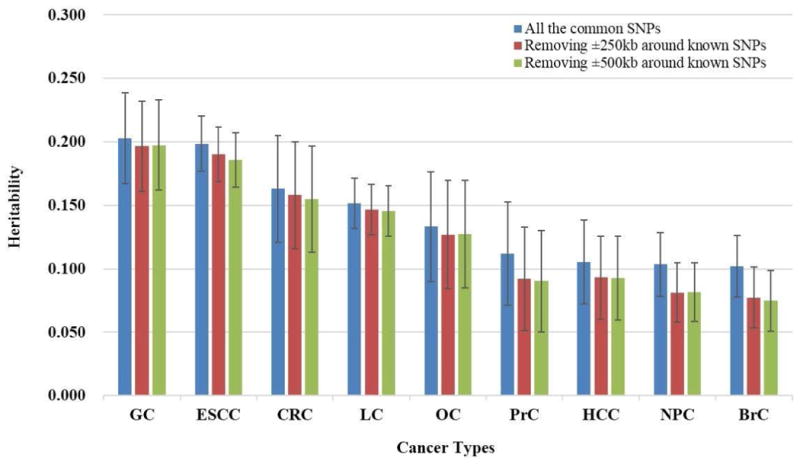
Heritability explained by all autosomal SNPs and after removing known regions (±250kb, 500kb of known SNPs) on GWAS arrays for nine cancer types.
Subgroup analyses were performed according to gender, smoking and drinking status, BMI and Age of menarche if these variables were available (Table 3). We estimated the variance explained by all the autosomal SNPs in each subgroup
Table 3. Subgroup analyses of heritability for six cancers.
| Cancer types | Subgroups | hL 1(SE) | P | P 2 |
|---|---|---|---|---|
| Lung cancer | Male | 0.153(0.023) | 1.61E-07 | 0.190 |
| Female | 0.243(0.062) | 4.73E-05 | ||
|
| ||||
| Smoker | 0.144(0.038) | 6.45E-05 | 0.165 | |
| Nonsmoker | 0.225(0.045) | 8.60E-08 | ||
|
| ||||
| Gastric Cancer | Male | 0.227(0.053) | 7.17E-06 | 0.421 |
| Female | 0.336(0.125) | 3.44E-04 | ||
|
| ||||
| Smoker | 0.192(0.088) | 1.34E-02 | 0.144 | |
| Nonsmoker | 0.347(0.059) | 8.00E-10 | ||
|
| ||||
| Drinker | 0.247(0.111) | 1.36E-02 | 0.805 | |
| Nondrinker | 0.278(0.054) | 6.97E-08 | ||
|
| ||||
| Hepatocellular carcinoma | Male | 0.088(0.043) | 1.80E-02 | 0.876 |
| Female | 0.059(0.180) | 3.67E-01 | ||
|
| ||||
| Smoker | 0.100(0.069) | 6.64E-02 | 0.727 | |
| Nonsmoker | 0.067(0.064) | 1.40E-01 | ||
|
| ||||
| Drinker | 0.000(0.090) | 5.00E-01 | 0.315 | |
| Nondrinker | 0.105(0.053) | 2.19E-02 | ||
|
| ||||
| Nasopharyngeal Cancer | Male | 0.158(0.042) | 1.05E-04 | 0.307 |
| Female | 0.084(0.059) | 8.55E-02 | ||
|
| ||||
| Esophageal squamous cell carcinoma | Male | 0.214(0.028) | 3.29E-14 | 0.917 |
| Female | 0.224(0.096) | 8.44E-04 | ||
|
| ||||
| Smoker | 0.187(0.036) | 1.22E-07 | 0.190 | |
| Nonsmoker | 0.272(0.053) | 2.95E-07 | ||
|
| ||||
| Drinker | 0.221(0.043) | 1.44E-07 | 0.315 | |
| Nondrinker | 0.159(0.044) | 1.04E-04 | ||
|
| ||||
| Breast Cancer | BMI ≤ 23.44 | 0.128(0.047) | 2.33E-03 | 0.734 |
| BMI > 23.44 | 0.106(0.047) | 1.29E-02 | ||
|
| ||||
| Age of menarche ≤ 14 | 0.048(0.048) | 1.63E-01 | 0.110 | |
| Age of menarche > 14 | 0.157(0.049) | 7.58E-04 | ||
Variance explained by all the autosomal SNPs in liability scale;
P value for genetic heterogeneity between subgroups.
No significant heterogeneity between each groups was observed. For gender status, common SNPs on arrays explained more heritability for females than males in lung cancer (0.243 vs 0.153), and gastric cancer (0.336 vs 0.227), while for nasopharyngeal cancer, the heritability was explained larger for males than females (0.158 vs 0.084). As regard with smoking, more variance of common SNPs was seen in nonsmokers than smokers for lung cancer (0.225 vs 0.144), gastric cancer (0.347 vs 0.192), and esophageal squamous cell carcinoma (0.272 vs 0.187). For breast cancer, common SNPs explained more heritability for those women whose menarche appear at an older age (Age of menarche > 14).
For Linear correlation analysis between variances for chromosome and chromosome length, we observed strong linear relationships between the estimate of variance explained by each chromosome and chromosome length (LC, in MB units) for LC (R2=0.641, P=0.001) and ESCC (R2=0.633, P=0.002) (Table 4 and Figure 2). Conditioning on the chromosomal length, it showed that chromosome 6 and 3 explains the largest variation for lung cancer and esophageal squamous cell cancer, respectively. And both diseases showed a smaller proportion of variance explained by chromosome 1. For nasopharyngeal carcinoma and colorectal cancer, the chromosomal model failed to constrain, no relationship matrixes were available. No significant correlations were observed for other 5 cancer types.
Table 4. The relationship between variance explained by each chromosome and chromosomal length.
| Cancer 1 | Regression slope | P | R2 |
|---|---|---|---|
| Lung Cancer | 7.41E-05 | 0.001 | 0.641 |
| Gastric Cancer | 8.58E-05 | 0.081 | 0.380 |
| Hepatocellular Carcinoma | 2.19E-05 | 0.348 | 0.210 |
| Breast Cancer | 3.69E-05 | 0.055 | 0.415 |
| Ovarian Cancer | -1.85E-05 | 0.578 | -0.125 |
| Esophageal Squamous Cancer | 5.32E-05 | 0.002 | 0.633 |
| Prostate Cancer | 1.46E-05 | 0.511 | 0.148 |
For nasopharyngeal carcinoma and colorectal cancer, the model of chromosomal heritability failed to constrain, data is unavailable.
Figure 2.
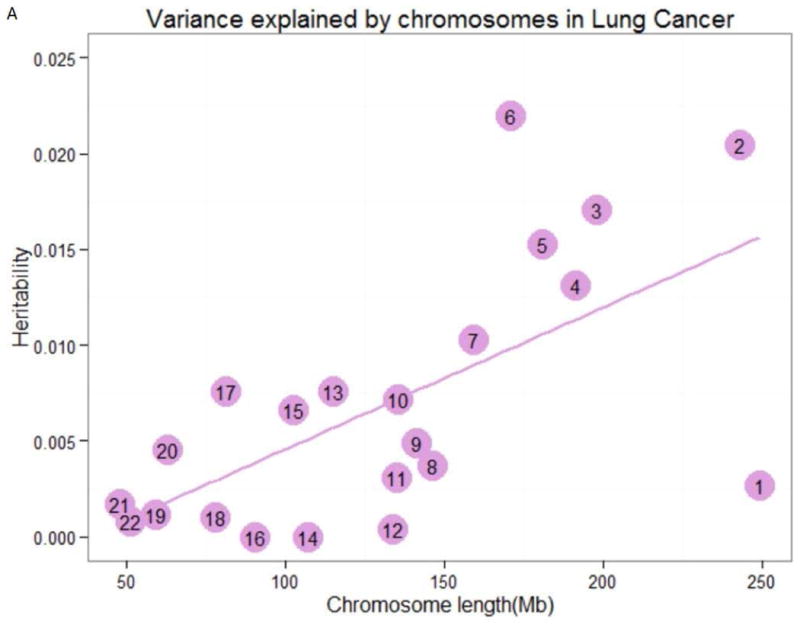
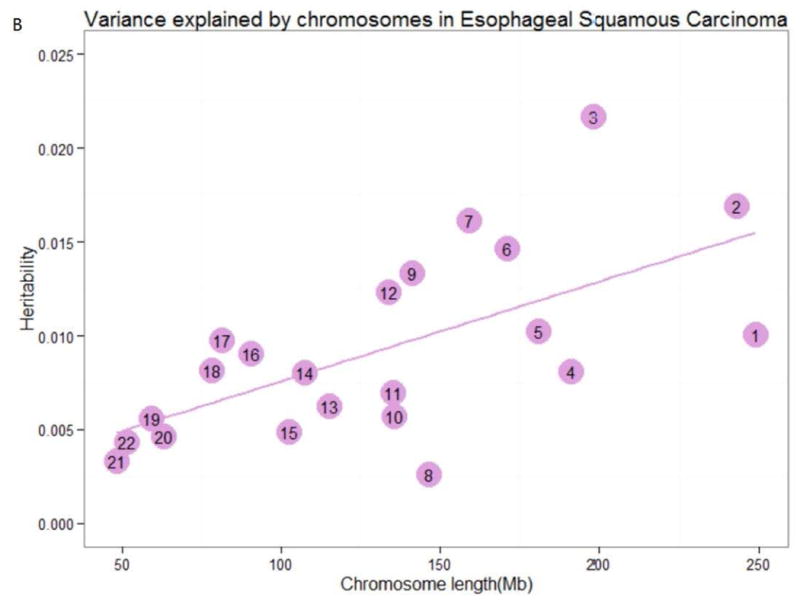
Variance explained by chromosomes. The estimation of the variance explained by each chromosome for (A) lung cancer, and (B) esophageal squamous carcinoma by joint analysis. The numbers in the circles are the chromosome numbers. The regression slopes and R2 were 7.41×10⁻⁵ (P=0.001) and 0.641 for lung cancer, 5.32×10⁻⁵ (P=0.002) and 0.633 for esophageal squamous carcinoma, respectively.
Discussion
The goal of the current study is to explore the amount of genetic variation that can be explained by common SNPs on Commercial arrays and further dissect the genetic architecture of nine common cancers in Chinese population. We discovered that common SNPs explained a certain amount of heritability for GC (20.26%), ESCC (19.86%), CRC (16.30%), LC (15.17%), and OC (13.31%), and a heritability of around 10% for PrC (11.20%), HCC (10.55%), NPC (10.34%), and BrC (10.19%). Analogous to other studies for heritability of cancer, we found either known SNPs or known regions (±250kb or 500kb from the known SNPs) from previous GWAS partitioned a small variance (the value were obtained through subtracting the variance excluding known regions from the total variance). These results partially filled the gap of heritability estimations for cancer in Chinese population and indicated that additional loci should be discovered by interrogation of increasingly larger studies in the future.
The heritability estimated in our study is different from that of traditional heritability estimation methods [e.g. pedigree (twin) or full-sibling (within-family) studies]. We here estimated narrow-sense heritability (additive heritability) dependent on the Linkage Disequilibrium (LD) relationship between genotyped germline SNPs and casual variants 14, while the twin and within-family studies estimate total heritability including both additive and non-additive effects or also confounded by environmental variation. The within-family design is based on LD produced by the inheritance of large chromosome segments from parents to offspring within a family so the SNPs track all causal variants 32. However, estimates here only consist of those common variants in LD with the SNPs genotyped on the chips as well as those passed QC. We have expected that some heritability was still missing compared to the relatively small variance explained by known regions in GWAS, coming from the causal variants not tagged by the SNPs here 11, 16. When compared with heritability estimated by other studies, an obvious distinction was seen for prostate cancer (0.11 in our data vs. 0.81 or 0.38 in other studies) and ovarian cancer (0.13 in our data vs. 0.30 in other study) (Table 2). The possible explanation should be that the incidence rate and prevalence of prostate cancer and ovarian cancer are much higher in Caucasian population than in Chinese population 1, 33, which may indicate genetic specificities except different proportion of prostate-specific antigen screening (PSA) or dietary habits for prostate cancer 34, and different distribution of obesity, exogenous and endogenous hormonal exposures, exposure to radiation, and caffeine consumption for ovarian cancer. For example, prevalence of BRCA1 or BRCA2 mutation (important genetic risk factors for ovarian cancer) differs significantly among race/ethnic groups, which is much lower in Chinese or Asian population 35, 36. These results re-confirmed the genetic discrepancy among different ancestries. In addition, stages, malignancy degree and proportion of subtypes in cancer cases also result in discrepant estimates of heritability. Lu et al calculated heritability for predominantly invasive epithelial ovarian cancer, while the cases in our study were epithelial ovarian cancer with a different proportion of subtypes 24, 37. Following subgroup results revealed that people who carried negative cancer risk factors (e.g. Nonsmokers, nondrinkers and older age of menarche) had the trend to explain larger amount of heritability (but there is no significance for the heterogeneity of subgroups), which also implied that multiple factors were interacted in the process of carcinogenesis. Finally, diversity in age of diagnosis of the cancer cases will also lead to different heritability estimates. As a result, our results should be generalized with caution even within the same origin of population.
Generally, known GWAS –identified risk regions explain a rather small proportion of variance in the nine common cancers (nearly or less than 25% changes were shown when removing the SNPs within 250kb or 500kb of the known variants on either direction). These findings were consistent with those reported by some other studies for cancers 17, 38 or other traits 15, 39, 40. As compared with the much larger variance partitioned by all the common SNPs on the arrays, it indicated that additional loci with low allele frequency could be detected if we use large-scale samples 41, 42. The results estimated by common SNPs could partially fill the gap of “missing heritability”, which means heritability is not missing but hidden. Also intriguingly, we found changes after removing SNPs within 500kb of known variants varied among cancers. Breast cancer changes the greatest with 26.6% decrease, followed by nasopharyngeal carcinoma (21.1%) and prostate cancer (19.5%). The possible reason is more SNPs from breast and prostate cancer GWASs have been discovered, for example, nearly 90 variants have been discovered for breast cancer and prostate cancer, respectively. On the other hand, heterogeneity exists among different cancers. For instance, although only 9 variants 27, 43, 44 have so far been discovered associated with nasopharyngeal cancer, a disease mostly occurs in Southern China 45, they (250kb and 500kb up and downwards expanded) seem to explain larger proportion of the overall heritability (21.4% and 21.1%). However, as regard with some more common cancers in various populations such as OC, ESCC, LC, and GC, more Chinese-specifically causal variants are yet to be found.
Linear relationships between chromosomal length and heritability were presented, especially for lung cancer and esophageal squamous cell carcinoma. This indicates that there are many polymorphisms affecting these cancers and there exists imparity of heritability in those chromosomes with different lengths (slightly increase of variance with larger length of chromosomes). Jian Yang et al 31 has provided the evidence that the linear relationship can't be due to the fact that longer chromosomes have more SNPs and thus smaller sampling errors when estimating genetic relationships between individuals. Although it is statistically significant, the linear relationship of the two cancers between the estimates of variances explained and genomic length is not so perfect. Heritability explained by chromosomal 17, 6 and 3 positively deviated from the linear relation for lung cancer and esophageal squamous cell carcinoma, respectively, while heritability of chromosome 1 negatively deviated for both cancers. For chromosome 7, larger variance was explained for esophageal squamous cell carcinoma, but not for lung cancer. For chromosome 12, much smaller variance was explained for lung cancer, which was, however, converse for esophageal squamous cell cancer. Besides, chromosomes with similar lengths can explain different amounts of variation for the same cancer. It is possible that mutate rate differs among chromosomes, and certain chromosomes bear larger numbers or larger effects of mutations towards tendency for different cancers 46. Further evidences should be provided for the two types of cancer, especially for those chromosomes bearing larger variances. Our study here provided further evidence for the highly polygenic nature of cancer as well as the heterogeneity among cancers.
We successfully estimated the array based heritability and found the polygenic genetic architecture of common cancers for Chinese population. However, there were also some limitations in the current study. Firstly, although we analyzed the most common cancers in Chinese population with an overall large sample size, the sample size was relatively small for each cancer, especially in specific subgroups, which may result in limited statistical power to estimate the relationship matrix in chromosomal model. Secondly, cancer prevalence for specific subgroups such as smokers, nonsmokers, drinkers and nondrinkers were not available among Chinese population, which possibly introduce bias in subgroup analyses. Thirdly, the criteria for QC may be too stringent, especially for HWE. More SNPs have been removed under this criteria, which may lead to insufficient representativeness of SNPs and heritability estimations for some cancers (for example, 66% of the array SNPs were removed after QC for gastric cancer). Finally, it might be interesting to explore whether the SNPs in or around genes and the intergenic SNPs explain different variation. This might be the next step of our research. In summary, to our knowledge, this is the first attempt to explore the heritability of nine cancer types using GWAS strategy in Chinese population. These results indicate polygenic genetic architecture of the nine common cancers in Chinese population and more efforts should be made to discover the hidden heritability by interrogation of increasingly larger studies in the future.
Supplementary Material
What's new?
This study conducted a genome-wide complex trait analysis (GCTA) to estimate the heritability explained by genome-wide common SNPs for cancer in Chinese population. The results indicate polygenic architecture of the nine cancer types (explained heritability ranged from 10.19% to 20.26%). Strong linear correlations between variance partitioned by each chromosome and chromosomal length were found only for lung cancer (R2=0.641, P=0.001) and esophageal squamous cell cancer (R2=0.633, P=0.002). Subgroup analysis have also been performed.
Acknowledgments
We thank all the subjects who took part in the genome-wide association studies. As regard with the methods to estimate heritability, we would like to thank Sang Hong Lee and Jian Yang of Queensland Institute of Medical Research, Australia, for their kind help.
Grant Support: This work was supported in part by the National Natural Science Foundation of China (81230067, 81521004, 81225020, 81422042, 81373090, 81573228, 81270044, 81573238); Science Foundation for Distinguished Young Scholars in Jiangsu (BK20130042); National Program for Support of Top-notch Young Professionals; and Priority Academic Program for the Development of Jiangsu Higher Education Institutions (Public Health and Preventive Medicine). This work was also supported in part by the NIH grants (UM1CA182910, R01CA188214, R01CA148667 and R37CA07867).
Abbreviations
- LC
lung cancer
- GC
gastric cancer
- HCC
hepatocellular carcinoma
- OC
ovarian cancer
- PrC
prostate cancer
- BrC
breast cancer
- NPC
nasopharyngeal carcinoma
- ESCC
esophageal squamous cell cancer
- CRC
colorectal cancer
- GWAS
genome-wide association studies
- SNPs
single nucleotide polymorphisms
- GCTA
genome-wide complex trait analysis
- NGS
next-generation sequencing
- LD
Linkage Disequilibrium
- QC
quality control
- HWE
Hardy-Weinberg Equilibrium
- IBD
identity by descent
- PSA
prostate-specific antigen screening
- GRM
genetic relationship matrix
- MLM
mixed linear model
- BMI
Body Mass Index
Footnotes
Conflict of interest statement: The authors have no conflicts of interest to declare.
References
- 1.Torre LA, Bray F, Siegel RL, Ferlay J, Lortet-Tieulent J, Jemal A. Global cancer statistics, 2012. CA Cancer J Clin. 2015;65:87–108. doi: 10.3322/caac.21262. [DOI] [PubMed] [Google Scholar]
- 2.Lichtenstein P, Holm NV, Verkasalo PK, Iliadou A, Kaprio J, Koskenvuo M, Pukkala E, Skytthe A, Hemminki K. Environmental and heritable factors in the causation of cancer--analyses of cohorts of twins from Sweden, Denmark, and Finland. N Engl J Med. 2000;343:78–85. doi: 10.1056/NEJM200007133430201. [DOI] [PubMed] [Google Scholar]
- 3.Peters U, Bien S, Zubair N. Genetic architecture of colorectal cancer. Gut. 2015 doi: 10.1136/gutjnl-2013-306705. [DOI] [PMC free article] [PubMed] [Google Scholar]
- 4.Li XJ, Hemmini K. Inherited predisposition to early onset lung cancer according to histological type. International Journal of Cancer. 2004;112:451–57. doi: 10.1002/ijc.20436. [DOI] [PubMed] [Google Scholar]
- 5.Hemminki K, Li X. Familial risk in testicular cancer as a clue to a heritable and environmental aetiology. Br J Cancer. 2004;90:1765–70. doi: 10.1038/sj.bjc.6601714. [DOI] [PMC free article] [PubMed] [Google Scholar]
- 6.Dong CH, Hemminki K. Modification of cancer risks in offspring by sibling and parental cancers from 2,112,616 nuclear families. International Journal of Cancer. 2001;92:144–50. [PubMed] [Google Scholar]
- 7.Czene K, Lichtenstein P, Hemminki K. Environmental and heritable causes of cancer among 9.6 million individuals in the Swedish family-cancer database. International Journal of Cancer. 2002;99:260–66. doi: 10.1002/ijc.10332. [DOI] [PubMed] [Google Scholar]
- 8.Mucci LA, Hjelmborg JB, Harris JR, Czene K, Havelick DJ, Scheike T, Graff RE, Holst K, Moller S, Unger RH, McIntosh C, Nuttall E, et al. Familial Risk and Heritability of Cancer Among Twins in Nordic Countries. JAMA. 2016;315:68–76. doi: 10.1001/jama.2015.17703. [DOI] [PMC free article] [PubMed] [Google Scholar]
- 9.Hirschhorn JN, Daly MJ. Genome-wide association studies for common diseases and complex traits. Nat Rev Genet. 2005;6:95–108. doi: 10.1038/nrg1521. [DOI] [PubMed] [Google Scholar]
- 10.Marshall AL, Christiani DC. Genetic susceptibility to lung cancer--light at the end of the tunnel? Carcinogenesis. 2013;34:487–502. doi: 10.1093/carcin/bgt016. [DOI] [PMC free article] [PubMed] [Google Scholar]
- 11.Manolio TA, Collins FS, Cox NJ, Goldstein DB, Hindorff LA, Hunter DJ, McCarthy MI, Ramos EM, Cardon LR, Chakravarti A, Cho JH, Guttmacher AE, et al. Finding the missing heritability of complex diseases. Nature. 2009;461:747–53. doi: 10.1038/nature08494. [DOI] [PMC free article] [PubMed] [Google Scholar]
- 12.Maher B. Personal genomes: The case of the missing heritability. Nature. 2008;456:18–21. doi: 10.1038/456018a. [DOI] [PubMed] [Google Scholar]
- 13.Zaitlen N, Kraft P. Heritability in the genome-wide association era. Hum Genet. 2012;131:1655–64. doi: 10.1007/s00439-012-1199-6. [DOI] [PMC free article] [PubMed] [Google Scholar]
- 14.Lee SH, Wray NR, Goddard ME, Visscher PM. Estimating missing heritability for disease from genome-wide association studies. Am J Hum Genet. 2011;88:294–305. doi: 10.1016/j.ajhg.2011.02.002. [DOI] [PMC free article] [PubMed] [Google Scholar]
- 15.Yang J, Benyamin B, McEvoy BP, Gordon S, Henders AK, Nyholt DR, Madden PA, Heath AC, Martin NG, Montgomery GW, Goddard ME, Visscher PM. Common SNPs explain a large proportion of the heritability for human height. Nat Genet. 2010;42:565–9. doi: 10.1038/ng.608. [DOI] [PMC free article] [PubMed] [Google Scholar]
- 16.Mancuso N, Rohland N, Rand KA, Tandon A, Allen A, Quinque D, Mallick S, Li H, Stram A, Sheng X, Kote-Jarai Z, Easton DF, et al. The contribution of rare variation to prostate cancer heritability. Nat Genet. 2015 doi: 10.1038/ng.3446. [DOI] [PMC free article] [PubMed] [Google Scholar]
- 17.Jiao S, Peters U, Berndt S, Brenner H, Butterbach K, Caan BJ, Carlson CS, Chan AT, Chang-Claude J, Chanock S, Curtis KR, Duggan D, et al. Estimating the heritability of colorectal cancer. Hum Mol Genet. 2014;23:3898–905. doi: 10.1093/hmg/ddu087. [DOI] [PMC free article] [PubMed] [Google Scholar]
- 18.Lu Y, Ek WE, Whiteman D, Vaughan TL, Spurdle AB, Easton DF, Pharoah PD, Thompson DJ, Dunning AM, Hayward NK, Chenevix-Trench G, Q M, et al. Most common ‘sporadic’ cancers have a significant germline genetic component. Hum Mol Genet. 2014;23:6112–8. doi: 10.1093/hmg/ddu312. [DOI] [PMC free article] [PubMed] [Google Scholar]
- 19.Lee SH, Harold D, Nyholt DR, Consortium AN, International Endogene C, Genetic, Environmental Risk for Alzheimer's disease C. Goddard ME, Zondervan KT, Williams J, Montgomery GW, Wray NR, et al. Estimation and partitioning of polygenic variation captured by common SNPs for Alzheimer's disease, multiple sclerosis and endometriosis. Hum Mol Genet. 2013;22:832–41. doi: 10.1093/hmg/dds491. [DOI] [PMC free article] [PubMed] [Google Scholar]
- 20.Sampson JN, Wheeler WA, Yeager M, Panagiotou O, Wang Z, Berndt SI, Lan Q, Abnet CC, Amundadottir LT, Figueroa JD, Landi MT, Mirabello L, et al. Analysis of Heritability and Shared Heritability Based on Genome-Wide Association Studies for Thirteen Cancer Types. J Natl Cancer Inst. 2015;107 doi: 10.1093/jnci/djv279. [DOI] [PMC free article] [PubMed] [Google Scholar]
- 21.Hu Z, Wu C, Shi Y, Guo H, Zhao X, Yin Z, Yang L, Dai J, Hu L, Tan W, Li Z, Deng Q, et al. A genome-wide association study identifies two new lung cancer susceptibility loci at 13q12.12 and 22q12.2 in Han Chinese. Nat Genet. 2011;43:792–6. doi: 10.1038/ng.875. [DOI] [PubMed] [Google Scholar]
- 22.Shi Y, Hu Z, Wu C, Dai J, Li H, Dong J, Wang M, Miao X, Zhou Y, Lu F, Zhang H, Hu L, et al. A genome-wide association study identifies new susceptibility loci for non-cardia gastric cancer at 3q13.31 and 5p13.1. Nat Genet. 2011;43:1215–8. doi: 10.1038/ng.978. [DOI] [PubMed] [Google Scholar]
- 23.Li S, Qian J, Yang Y, Zhao W, Dai J, Bei JX, Foo JN, McLaren PJ, Li Z, Yang J, Shen F, Liu L, et al. GWAS identifies novel susceptibility loci on 6p21.32 and 21q21.3 for hepatocellular carcinoma in chronic hepatitis B virus carriers. PLoS Genet. 2012;8:e1002791. doi: 10.1371/journal.pgen.1002791. [DOI] [PMC free article] [PubMed] [Google Scholar]
- 24.Chen K, Ma H, Li L, Zang R, Wang C, Song F, Shi T, Yu D, Yang M, Xue W, Dai J, Li S, et al. Genome-wide association study identifies new susceptibility loci for epithelial ovarian cancer in Han Chinese women. Nat Commun. 2014;5:4682. doi: 10.1038/ncomms5682. [DOI] [PubMed] [Google Scholar]
- 25.Xu J, Mo Z, Ye D, Wang M, Liu F, Jin G, Xu C, Wang X, Shao Q, Chen Z, Tao Z, Qi J, et al. Genome-wide association study in Chinese men identifies two new prostate cancer risk loci at 9q31.2 and 19q13.4. Nat Genet. 2012;44:1231–5. doi: 10.1038/ng.2424. [DOI] [PMC free article] [PubMed] [Google Scholar]
- 26.Cai Q, Zhang B, Sung H, Low SK, Kweon SS, Lu W, Shi J, Long J, Wen W, Choi JY, Noh DY, Shen CY, et al. Genome-wide association analysis in East Asians identifies breast cancer susceptibility loci at 1q32.1, 5q14.3 and 15q26.1. Nat Genet. 2014;46:886–90. doi: 10.1038/ng.3041. [DOI] [PMC free article] [PubMed] [Google Scholar]
- 27.Bei JX, Li Y, Jia WH, Feng BJ, Zhou G, Chen LZ, Feng QS, Low HQ, Zhang H, He F, Tai ES, Kang T, et al. A genome-wide association study of nasopharyngeal carcinoma identifies three new susceptibility loci. Nat Genet. 2010;42:599–603. doi: 10.1038/ng.601. [DOI] [PubMed] [Google Scholar]
- 28.Wu C, Hu Z, He Z, Jia W, Wang F, Zhou Y, Liu Z, Zhan Q, Liu Y, Yu D, Zhai K, Chang J, et al. Genome-wide association study identifies three new susceptibility loci for esophageal squamous-cell carcinoma in Chinese populations. Nat Genet. 2011;43:679–84. doi: 10.1038/ng.849. [DOI] [PubMed] [Google Scholar]
- 29.Zhang B, Jia WH, Matsuda K, Kweon SS, Matsuo K, Xiang YB, Shin A, Jee SH, Kim DH, Cai Q, Long J, Shi J, et al. Large-scale genetic study in East Asians identifies six new loci associated with colorectal cancer risk. Nat Genet. 2014;46:533–42. doi: 10.1038/ng.2985. [DOI] [PMC free article] [PubMed] [Google Scholar]
- 30.Yang J, Lee SH, Goddard ME, Visscher PM. GCTA: a tool for genome-wide complex trait analysis. Am J Hum Genet. 2011;88:76–82. doi: 10.1016/j.ajhg.2010.11.011. [DOI] [PMC free article] [PubMed] [Google Scholar]
- 31.Yang J, Manolio TA, Pasquale LR, Boerwinkle E, Caporaso N, Cunningham JM, de Andrade M, Feenstra B, Feingold E, Hayes MG, Hill WG, Landi MT, et al. Genome partitioning of genetic variation for complex traits using common SNPs. Nat Genet. 2011;43:519–25. doi: 10.1038/ng.823. [DOI] [PMC free article] [PubMed] [Google Scholar]
- 32.Vinkhuyzen AA, Wray NR, Yang J, Goddard ME, Visscher PM. Estimation and partition of heritability in human populations using whole-genome analysis methods. Annu Rev Genet. 2013;47:75–95. doi: 10.1146/annurev-genet-111212-133258. [DOI] [PMC free article] [PubMed] [Google Scholar]
- 33.Lowe KA, Chia VM, Taylor A, O'Malley C, Kelsh M, Mohamed M, Mowat FS, Goff B. An international assessment of ovarian cancer incidence and mortality. Gynecol Oncol. 2013;130:107–14. doi: 10.1016/j.ygyno.2013.03.026. [DOI] [PubMed] [Google Scholar]
- 34.Kimura T. East meets West: ethnic differences in prostate cancer epidemiology between East Asians and Caucasians. Chin J Cancer. 2012;31:421–9. doi: 10.5732/cjc.011.10324. [DOI] [PMC free article] [PubMed] [Google Scholar]
- 35.John EM, Miron A, Gong G, Phipps AI, Felberg A, Li FP, West DW, Whittemore AS. Prevalence of pathogenic BRCA1 mutation carriers in 5 US racial/ethnic groups. JAMA. 2007;298:2869–76. doi: 10.1001/jama.298.24.2869. [DOI] [PubMed] [Google Scholar]
- 36.Schorge JO, Modesitt SC, Coleman RL, Cohn DE, Kauff ND, Duska LR, Herzog TJ. SGO White Paper on ovarian cancer: etiology, screening and surveillance. Gynecol Oncol. 2010;119:7–17. doi: 10.1016/j.ygyno.2010.06.003. [DOI] [PubMed] [Google Scholar]
- 37.Song H, Ramus SJ, Tyrer J, Bolton KL, Gentry-Maharaj A, Wozniak E, Anton-Culver H, Chang-Claude J, Cramer DW, DiCioccio R, Dork T, Goode EL, et al. A genome-wide association study identifies a new ovarian cancer susceptibility locus on 9p22.2. Nat Genet. 2009;41:996–1000. doi: 10.1038/ng.424. [DOI] [PMC free article] [PubMed] [Google Scholar]
- 38.Chen D, Cui T, Ek WE, Liu H, Wang H, Gyllensten U. Analysis of the genetic architecture of susceptibility to cervical cancer indicates that common SNPs explain a large proportion of the heritability. Carcinogenesis. 2015 doi: 10.1093/carcin/bgv083. [DOI] [PubMed] [Google Scholar]
- 39.Mitchell JS, Johnson DC, Litchfield K, Broderick P, Weinhold N, Davies FE, Gregory WA, Jackson GH, Kaiser M, Morgan GJ, Houlston RS. Implementation of genome-wide complex trait analysis to quantify the heritability in multiple myeloma. Sci Rep. 2015;5:12473. doi: 10.1038/srep12473. [DOI] [PMC free article] [PubMed] [Google Scholar]
- 40.Keller MF, Saad M, Bras J, Bettella F, Nicolaou N, Simon-Sanchez J, Mittag F, Buchel F, Sharma M, Gibbs JR, Schulte C, Moskvina V, et al. Using genome-wide complex trait analysis to quantify ‘missing heritability’ in Parkinson's disease. Hum Mol Genet. 2012;21:4996–5009. doi: 10.1093/hmg/dds335. [DOI] [PMC free article] [PubMed] [Google Scholar]
- 41.Michailidou K, Beesley J, Lindstrom S, Canisius S, Dennis J, Lush MJ, Maranian MJ, Bolla MK, Wang Q, Shah M, Perkins BJ, Czene K, et al. Genome-wide association analysis of more than 120,000 individuals identifies 15 new susceptibility loci for breast cancer. Nat Genet. 2015;47:373–80. doi: 10.1038/ng.3242. [DOI] [PMC free article] [PubMed] [Google Scholar]
- 42.Al Olama AA, Kote-Jarai Z, Berndt SI, Conti DV, Schumacher F, Han Y, Benlloch S, Hazelett DJ, Wang Z, Saunders E, Leongamornlert D, Lindstrom S, et al. A meta-analysis of 87,040 individuals identifies 23 new susceptibility loci for prostate cancer. Nat Genet. 2014;46:1103–9. doi: 10.1038/ng.3094. [DOI] [PMC free article] [PubMed] [Google Scholar]
- 43.Tse KP, Su WH, Chang KP, Tsang NM, Yu CJ, Tang P, See LC, Hsueh C, Yang ML, Hao SP, Li HY, Wang MH, et al. Genome-wide association study reveals multiple nasopharyngeal carcinoma-associated loci within the HLA region at chromosome 6p21.3. Am J Hum Genet. 2009;85:194–203. doi: 10.1016/j.ajhg.2009.07.007. [DOI] [PMC free article] [PubMed] [Google Scholar]
- 44.Ng CC, Yew PY, Puah SM, Krishnan G, Yap LF, Teo SH, Lim PV, Govindaraju S, Ratnavelu K, Sam CK, Takahashi A, Kubo M, et al. A genome-wide association study identifies ITGA9 conferring risk of nasopharyngeal carcinoma. J Hum Genet. 2009;54:392–7. doi: 10.1038/jhg.2009.49. [DOI] [PubMed] [Google Scholar]
- 45.McDermott AL, Dutt SN, Watkinson JC. The aetiology of nasopharyngeal carcinoma. Clin Otolaryngol Allied Sci. 2001;26:82–92. doi: 10.1046/j.1365-2273.2001.00449.x. [DOI] [PubMed] [Google Scholar]
- 46.Burrell RA, McGranahan N, Bartek J, Swanton C. The causes and consequences of genetic heterogeneity in cancer evolution. Nature. 2013;501:338–45. doi: 10.1038/nature12625. [DOI] [PubMed] [Google Scholar]
Associated Data
This section collects any data citations, data availability statements, or supplementary materials included in this article.