

Abstract
Final infarct volume in stroke trials is assessed on images obtained between 30 and 90 days after stroke onset. Imaging at such delayed timepoints is problematic because patients may be lost to follow-up or die before the scan. Obtaining an early assessment of infarct volume on subacute scans avoids these limitations; however, it overestimates true infarct volume because of edema. The aim of this study was to develop a novel approach to quantify edema so that final infarct volumes can be approximated on subacute scans. We analyzed data from 20 stroke patients (median age, 75 years) who had baseline, subacute (fu5d) and late (fu90d) MRI scans. Edema displaces CSF from sulci and ventricles; therefore, edema volume was estimated as change in CSF volume between baseline and spatially coregistered fu5d ADC maps. The median (interquartile range, IQR) estimated edema volume was 13.3 (7.5–37.7) mL. The fu5d lesion volumes correlated well with fu90d infarct volumes with slope: 1.24. With edema correction, fu5d infarct volumes are in close agreement, slope: 0.97 and strongly correlated with actual fu90d volumes. The median (IQR) difference between actual and predicted infarct volumes was 0.1 (−3.0–5.7) mL. In summary, this novel technique for estimation of edema allows final infarct volume to be predicted from subacute MRI.
Keywords: Apparent diffusion coefficient, edema, infarct volume, magnetic resonance imaging, stroke, subacute
Introduction
In acute stroke trials, measurements of final infarct volumes are often performed on magnetic resonance imaging (MRI) or computed tomography scans obtained at 30 or 90 days after stroke onset. These late time points are chosen because they coincide with typical assessment of clinical outcome measures and also edema has resolved at these time points.1,2 A major drawback of these delayed imaging times is that many patients do not return for the late follow-up scans because of early mortality or poor compliance with late imaging. The missing data can bias outcomes because patients with large lesions are less likely to have late follow-up scans.
Previous studies indicate that lesion volumes typically increase during the acute and subacute periods until three to four days after stroke onset.3–5 Thus, infarct volumes can potentially be measured early, i.e., three to four days after stroke onset. However, at this time point, edema develops and results in an overestimation of the true infarct volume, which is defined as the measured infarct volume when edema has subsided.6 The magnitude of this overestimation depends on individual factors and timing of the scan since edema evolution is highly dynamic in the first week after stroke onset.4 If ischemic edema can be quantified, then a reasonably accurate estimate of final infarct volume could theoretically be estimated on the day 3 to 5 scans. However, to the best of our knowledge, there are no existing imaging techniques that can separate edema from infarct, allowing a direct assessment of the true infarct volume. Yoo et al.7 measured edema volumes by segmenting the hemisphere and lateral ventricle ipsilateral to the stroke volume and measuring the differences in the involved hemispheric and ventricular volumes between baseline and subacute scans using diffusion-weighted imaging (DWI). However, the focus of that study was to correlate the edema measures with clinical endpoints and not to estimate and validate the final infarct volumes on subacute scans.
In this study, we present a novel technique to quantify brain edema and estimate final infarct volumes on subacute MRI scans. The accuracy of this technique was validated on a subset of patients from the Echoplanar Imaging Thrombolytic Evaluation Trial (EPITHET).2 We compared the predicted final infarct volume on subacute scans to the actual final infarct volume measured on day 90 scans. Our hypothesis was that the proposed technique can accurately quantify edema volume allowing for estimation of 90 day infarct volumes on day 5 scans. We also evaluated the edema estimation in patients with serial MRI scans and no expected edema.
Theory
Brain tissue is incompressible and contained within the skull cavity, so edema accumulates by displacing cerebrospinal fluid (CSF) from sulci and ventricles. Thus, the amount of edema occupying the subacute lesion volume can be quantified by measuring the change in CSF volume between a baseline scan where typically there is no or very modest edema and a subacute scan where the lesion is penetrated with edema. CSF volume can be estimated by using apparent diffusion coefficient (ADC) maps calculated from a routine DWI acquisition. As the ADC values in the CSF, mean ADCCSF =3400 ± 450 (× 10−6 mm2/s),8 are more than three times that of normal brain parenchyma, mean ADCparenchyma =840 ± 110 (× 10−6 mm2/s);8 ADC images are often used to distinguish CSF voxels from parenchymal tissue using a threshold value. However, within a voxel, there can be a mix of gray matter, white matter, vasculature and CSF, all with differing ADCs.9 As the ADC value of CSF is more than three times that of normal tissue, intravoxel partial volume averaging of CSF with parenchyma will yield ADC values that are intermediate between brain parenchyma and CSF, and introduce significant bias in the CSF volume estimation if done using a single threshold.9 Previous studies have estimated that a voxel containing 20% CSF and 80% brain parenchyma results in an ADC that is 50% higher than normal brain parenchyma.9 Taking the mean ADC values of CSF (ADCCSF) and parenchyma (ADCparenchyma) stated above, the total ADC (ADCvoxel) of a brain voxel is
| (1) |
where C and P are the respective volume fractions of CSF and parenchyma in a voxel (P = 1 − C). So,
| (2) |
Based on the above equations, the baseline and subacute ADC maps can be remapped into fractional CSF maps, and the CSF volumes can be calculated by multiplying the summation of the fractional CSF values with the voxel volume (i.e., product of the voxel sizes in x, y and z directions)
| (3) |
Methods
Subjects
We analyzed data from patients with acute ischemic stroke enrolled in the EPITHET clinical trial. The methodology and main results of EPITHET have been published.2 In EPITHET, patients had an acute MRI performed immediately before treatment with intravenous alteplase or placebo (baseline; performed 3–6 h after symptoms onset), a subacute MRI performed between days 2 and 5 (fu5d), and a final MRI for determination of infarct volume on day 90 (fu90d). We selected only cases from John Hunter Hospital in Newcastle, Australia, for this study, as it was the primary enrolling site for EPITHET and had the best and most homogeneous data available. The cases from other sites suffered from low signal-to-noise ratio and distortion issues and hence, were not suitable for this study which relies on quantitative ADC measurements.
The Hunter New England Human Research Ethics Committee approved all study procedures, and informed consent was obtained from each patient before participation. All research was conducted under the Australian National Health and Medical Research Council guidelines, consistent with the Declaration of Helsinki. There were 39 cases in total from John Hunter Hospital, and 28 of them had all three MRI time points (i.e., baseline, fu5d and fu90d scans). Of the 28 cases, four cases were excluded because of poor image quality due to motion and four cases due to the use of inconsistent diffusion protocols between baseline and fu5d scans. Therefore, the final cohort consisted of 20 EPITHET patients, and the following DWI protocol was used (TE: 100 ms, TR: 3000 ms, matrix: 256 × 256, voxel size: 0.9375 × 0.9375 × 7.00 mm3, 20 slices with two b-values: 0 and 1000 mm2/s).The median (IQR) time between baseline and subacute scans was 3 (2–3) days and between baseline and fu90d scans was 91 (90–94) days.
Acute ischemic lesion volumes at baseline and on fu5d were measured using the DWI images by two EPITHET investigators, and the means of the two investigators’ measurements were used in this study.10 For one case, the fu5d lesion mask was redrawn because, after review by the authors, the fu5d DWI was found to have large regions of hyper-intensity that were not captured by the initial mask. Therefore, a new outline was drawn by an experienced reviewer, blinded to the edema measurement, and the fu5d lesion volume for this case was re-calculated. Final infarct volumes on fu90d were measured by segmenting T2-weighted images, and the analysis method for determination of fu90d infarct volumes has been published previously.10
In addition to the 20 EPITHET patients, we analyzed DWI data from 10 control patients with transient ischemic attacks, scanned between July 2014 and June 2015. Ethical approval for this study was obtained from the local institutional review board of Showa University Fujigaoka Hospital, and all patients signed informed consent. The patients were imaged twice, five to eight days apart as part of a research protocol. All patients had no or very small lesions (<5 mL) on their scans.
Data analysis
The ADC maps were created using a standard procedure, by applying the equation below where S is the signal intensity from the isotropically weighted b = 1000 image and S0 is the signal intensity from the b = 0 image
| (4) |
The processing steps to calculate CSF volumes can be broadly divided into three steps. First, the fu5d b0 image was spatially coregistered to the baseline b0 image using statistical parametric mapping (SPM8, http://www.fil.ion.ucl.ac.uk/spm) software. The co-registration was done in order to constrain the CSF analysis to the same spatial region for the baseline and fu5d ADC images. We estimated a rigid body transformation using mutual information as cost function. The transformation matrix generated for coregistering b0 images was applied to resample the fu5d ADC map as the baseline ADC map using sinc interpolation.
Second, a brain mask covering the cerebrum was extracted from the b0 image using Medical Imaging Processing, Analysis and Visualization (NIH, Bethesda, MD) software, and the ADC maps were masked using this brain mask. Third, using equation (2), spatially coregistered baseline and fu5d ADC maps were remapped into fractional CSF maps, and CSF volumes were calculated in MATLAB (MathWorks, Natick, MA). The difference in the CSF volumes between baseline and fu5d scans reflects the amount of edema (predicted edema) developed on fu5d scan. Predicted fu90d infarct volume was then determined by subtracting the predicted edema volume from the fu5d lesion volume. Actual edema volume was defined as the difference between the fu90d final infarct volume and the fu5d lesion volume. In order to test for coregistration or interpolation errors, edema volumes were calculated in both baseline space (fu5d images coregistered to baseline images) and fu5d space (baseline images coregistered to fu5d images). Similar data analysis was performed in control cohort to estimate predicted edema volumes; i.e., the difference in CSF volumes between baseline and fu5d scans. In these control cases, it is expected that there should be no or very minimal edema.
Statistical analysis
The median (IQR) of the lesion volumes at different time points, and of the predicted edema and fu90d infarct volumes were reported for the study cohort. The fu5d lesion volumes with and without edema correction were compared to the fu90d final infarct volume based on the Wilcoxon signed rank test. Linear regression analysis was performed comparing the predicted edema with the actual edema volumes, and the fu5d lesion volumes with and without edema correction with the fu90d final infarct volumes to test for the agreement and correlation. Regression analysis was also performed between the predicted edema and fu90d infarct volumes calculated in baseline space and fu5d space. In the control cohort, the median (IQR) of predicted edema volumes was reported. For all statistical tests, a significance level of P = 0.05 was employed.
Results
Table 1 summarizes the patient demographics, lesion volumes at different time points, and also predicted edema and fu90d infarct volumes. The median (IQR) difference between the actual fu90d infarct volumes and the predicted final infarct volumes was 0.1 (−3.0–5.7) mL. The fu5d lesion volumes without edema correction were significantly different (P < 0.001) from fu90d infarct volumes, whereas with edema correction (i.e., predicted fu90d infarct volumes) were not significantly different (P = 0.81) from actual fu90d infarct volumes.
Table 1.
Patient demographics, lesion volumes at different time points, actual and predicted edema volumes and predicted fu90d infarct volume.
| Characteristic | Result |
|---|---|
| Age (years) | 75, 63–83 |
| Female | 10 (50%) |
| TOAST | Large artery atherosclerosis, 11 (55%) Cardioembolism, 5 (25%) Stroke of undetermined etiology, 4 (20%) |
| Baseline NIHSS score | 15, 10–18 |
| 90 day mRS | 3, 2–4 |
| Baseline lesion volume (mL) | 37.6, 9.5–55.6 |
| fu5d lesion volume (mL) | 62.5a, 30.7–184.9 |
| fu90d infarct volume (mL) | 50.7, 19.7–147.8 |
| Actual edema volume (mL) | 16.4, 7.5–36.2 |
| Predicted edema volume (mL) | 13.3, 7.5–37.7 |
| Predicted fu90d infarct volume (mL) | 51.6, 24.8–142.8 |
TOAST: Trial of ORG 10172 in Acute Stroke Treatment; NIHSS: National Institutes of Health Stroke Scale; mRS: modified Rankin Scale. Values are reported as median, interquartile range or number (%). Based on Wilcoxon signed rank test, fu5d lesion volumes were significantly different
(P < 0.001) from fu90d infarct volume, whereas fu5d lesion volumes with edema correction (i.e., predicted fu90d infarct volumes) were not significantly different (P = 0.81) from actual fu90d infarct volumes.
Figure 1(a) to (d) illustrates edema accumulation and CSF displacement from sulci and ventricles on a subacute scan in a representative stroke patient. Figure 1(e) shows the CSF displacement map calculated by taking the difference between fractional CSF maps of spatially coregistered baseline and fu5d scans. For this patient, the estimated edema volume was 44.1 mL, and the predicted final infarct volume (fu5d volume—edema volume) was 157.7 mL which is close to the actual fu90d infarct volume (157 mL).
Figure 1.

CSF displacement in a patient with acute ischemic stroke (baseline volume: 62.9 mL, fu5d volume: 201.8 mL and fu90d volume: 157.0 mL). Baseline and spatially coregistered fu5d ADC maps (a, b) and corresponding fractional CSF maps (c, d). The white arrows on fu5d maps show the displacement of CSF from the ventricles and sulci around the ischemic lesion. (e) CSF displacement map, i.e., the difference between the fractional CSF maps between baseline and fu5d. Yellow shows voxels containing fractional CSF (ADCvoxel > 1096 × 10−6 mm2/s) on baseline and parenchymal tissue (ADCvoxel < 1096 × 10−6 mm2/s) on fu5d, red shows voxels containing parenchymal tissue on baseline and fractional CSF on fu5d map and black shows no change in fractional CSF maps between baseline and fu5d scans. The edema volume, calculated as the difference in CSF volumes between baseline and fu5d scans is 44.1 mL and the predicted final infarct volume (fu5d volume—edema volume) is 157.7 mL.
ADC: apparent diffusion coefficient; CSF: cerebrospinal fluid.
Figure 2(a) to (d) shows linear regression plots between fu5d lesion volume and actual fu90d infarct volume, actual edema volume and fu5d lesion volume, and between predicted and actual edema and fu90d infarct volumes, respectively. The fu5d lesion volumes correlated well with the fu90d infarct volumes with a slope of 1.24 (95% confidence interval (CI): 1.19–1.29). By regression analysis, the actual edema volume was 20% (95% CI: 17%–23%) of the subacute lesion volume. The predicted edema volumes produced a slope of 1.03 and correlated well with the actual edema volumes. With edema correction, the fu5d infarct volumes were in close agreement with slope = 0.97 (95% CI: 0.93–1.01) and strongly correlated (R2 = 0.99) with the actual fu90d infarct volumes.
Figure 2.

Linear regression analysis. The solid lines depict the regression lines between (a) fu5d lesion volume and the actual fu90d infarct volume, (b) actual edema volume and fu5d lesion volume, (c) predicted edema volume and actual edema volume and (d) predicted fu90d infarct volume (i.e., fu5d lesion volume with edema correction) and actual fu90d infarct volume. The dashed lines depict line of unity. Regression equations and correlation coefficients (R2) are also included in the plots.
Figure 3(a) and (b) shows an excellent agreement (slope ∼ 1) and correlation (R2 > 0.99) between the predicted edema and fu90d infarct volumes calculated in baseline space and fu5d space. Figure 4 shows a box plot for the predicted edema volumes, i.e., the difference in CSF volumes between baseline and fu5d scans in 10 control patients. The median (IQR) predicted edema volume for the control group was 0.2 (−4.0–7.6) mL.
Figure 3.

Linear regression analysis between predicted edema (a) and fu90d infarct volumes (b) calculated in baseline space and fu5d space, respectively. Regression equations and correlation coefficients (R2) are included in the plots.
Figure 4.
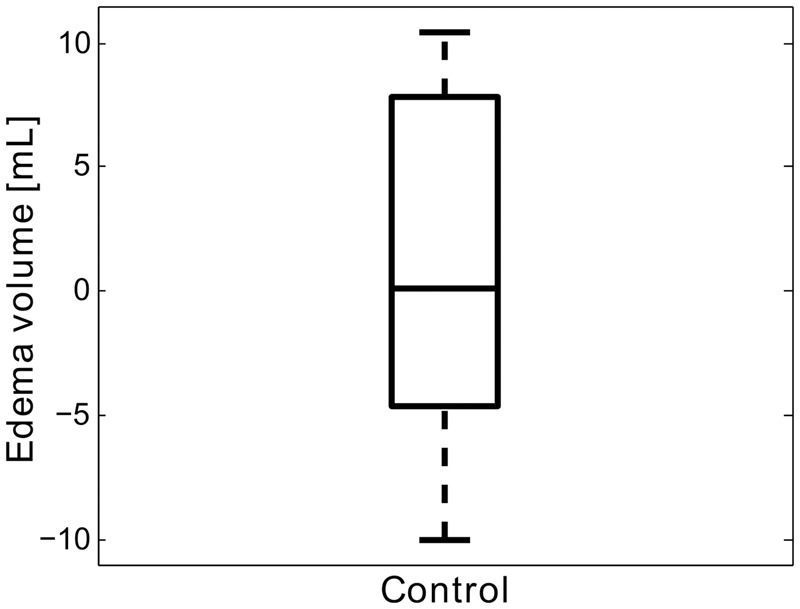
Box plot showing the predicted edema volumes, i.e., the difference in CSF volumes between baseline and fu5d scans in 10 control patients. The median (IQR) predicted edema volume for the control group is 0.2 (−4.0–7.6) mL.
Discussion
This study describes a novel technique for quantification of brain edema in subacute stroke patients and provides strong evidence that final infarct volumes can be approximated with good accuracy prior to hospital discharge. The median (IQR) difference between the actual fu90d infarct volumes and the predicted final infarct volumes was 0.1 (−3.0–5.7) mL. Regression analysis of the predicted final infarct volume with the actual fu90d infarct volume demonstrates a strong agreement with a slope of 0.97 that did not differ significantly from 1.0 (P = 0.13).
Previous studies showed that the lesion volumes measured on subacute scans correlated strongly with lesion volumes measured on 30 or 90 day scans.11,12 However, final infarct volumes were overestimated on subacute scans due to edema.4,11 In the current study, we observed that using a regression model the fu5d lesion volume overestimated the fu90d final infarct volume by 24%. Although, the actual edema volume, on average, was 20% of the fu5d lesion volume, it ranged from almost no edema to as high as 88.8%; showing a substantial variation among patients. Therefore, a technique that can quantify the volume of edema in individual patients is likely to be more accurate for predicting final infarct volume than simply reducing the subacute lesion volume by a fixed percentage.
A recent focus of stroke trials has been to develop novel therapies for reducing cerebral edema formation as it has devastating effects such as herniation, neurologic deterioration and also death. However, there are no existing imaging techniques to accurately quantify the amount of edema in order to evaluate these novel treatments. In a recent study, Yoo et al.7 evaluated hemisphere growth as a biomarker for edema formation. However, the method only excluded sulci at least 2 mm wide for hemisphere volume estimation and also did not account for partial volume effects as the boundaries contain voxels that have a mix of brain parenchyma and CSF. Furthermore, the method only measured ipsilateral hemispheric and ventricular volumes but edema accumulation can cause midline shift for malignant or large lesions where the contralateral hemisphere and ventricle will also be affected. Hence, the analysis of hemisphere growth might be a suitable biomarker for edema formation as described by Yoo et al.,7 but the technique cannot quantify absolute edema volumes. Our study describes a novel technique to calculate edema volumes that will be beneficial not only for predicting final infarct volumes early on subacute scans but also can be used for evaluating the efficacy of current therapies in resolving edema.
Our edema quantification method performed similarly well in the control group with no lesions where the CSF volume estimated on the second serial scan was in good agreement with the initial scan, with a median difference of 0.2 (−4.0–7.6) mL, range −10 to 10 mL. The observed spread around zero likely reflects the inherent measurement error in our method as well as small fluctuations in CSF volume over time due to hydration status.13
The accuracy of the proposed technique in estimating edema volumes is highly dependent on the quantitative ADC maps. There might be interpolation errors affecting the ADC maps when spatially coregistering from fu5d to baseline space and vice-versa. However, our results show that the predicted edema and fu90d infarct volumes calculated in both baseline space and fu5d space were in excellent agreement demonstrating no major errors from coregistration and resampling.
Our study estimated final infarct volumes on subacute scans by quantifying edema and made comparisons with the actual fu90d infarct volumes. But apart from edema quantification on subacute scans, there are other potential contributing factors affecting the estimation and comparison of final infarct volumes on fu5d and fu90d scans. These include pre-existing edema on baseline scans, lesion atrophy on fu90d scans and measurement bias in determining fu5d and fu90d lesion volumes.14 Pre-existing edema on baseline scan causes loss of CSF volume already at baseline and would lead to an underestimation of estimated edema volume and hence an overestimation of predicted final infarct volume on fu5d. One method to estimate loss of CSF on baseline scans is by calculating the difference in the CSF volume between the two hemispheres, under the assumption that in a normal brain the amount of CSF is similar in both hemispheres. In order for this technique to work, the amount of CSF should be similar in both hemispheres, i.e., there should no old infarcts occupied with CSF as is sometimes the case in patients with recurrent stroke.
Lesion atrophy occurs in some patients at late time points (day 30 or 90 scans) and manifests as sulcal widening and ventricular enlargement which is apparent on T2-weighted or FLAIR images.14 This causes underestimation of the actual fu90d infarct volumes and would tend to overcall the predicted final infarct volumes on the fu5d scans relative to the fu90d time point. However, in this study, we did not observe any consistent overestimation of the predicted final infarct volumes and hence did not attempt to investigate lesion atrophy. Nevertheless, this is an important factor and needs to be further investigated in future validation studies.
The validation of the predicted final infarct volumes on subacute scans highly depends on the accuracy of the lesion volume measurements on fu5d and fu90d scans. The fu5d lesion volumes were measured by two investigators and were in close agreement with a mean bias of 3.6 ± 9.8 mL. However, there were few cases where the difference between investigators was larger than 15 mL, and some of these cases also showed larger differences between predicted and actual final infarct volumes. As all these lesion volume measurements were documented and published, we did not attempt to re-estimate the lesion volumes except for one case as mentioned in the methods section.
The technique and the data set used in this study have some limitations. First, the technique used to estimate the edema volume from the ADC maps is sensitive to voxel ADC thresholds. Second, the usable sample size for this study is small due to unavailability of three time points, poor image quality and inconsistency in protocol acquisitions between baseline and fu5d scans. Third, the estimated final infarct volume will underestimate the actual final infarct volume if the patient is scanned in the period where tissue is still being recruited into the infarct or if there is a secondary event after the early follow-up imaging that causes additional infarction. Finally, all the above mentioned potential contributing factors should also be considered in future validation studies when assessing the final infarct volumes on the subacute scans and making comparisons to the fu90d infarct volumes. Nonetheless, our study made the first attempt to the best of our knowledge in quantifying cerebral edema using ADC maps and hence predicting final infarct volumes on subacute scans, in patients with acute ischemic stroke.
Summary
We report a novel technique for edema estimation that can be used in stroke patients who have an early baseline and a subacute MRI scan. After edema correction, subacute lesion volumes can be potentially translated into accurate estimates of the 90-day infarct volumes and hence can either replace 90-day infarct volumes, or substitute for them if a late follow-up scan is unavailable. This technique should be prospectively validated in larger patient population.
Funding
The author(s) disclosed receipt of the following financial support for the research, authorship, and/or publication of this article: The study was funded by grants from the National Institute for Neurological Disorders and Stroke (NINDS). R01 NS03932505 (G Albers) and K23 NS051372 (M Lansberg).
Declaration of conflicting interests
The author(s) declared the following potential conflicts of interest with respect to the research, authorship, and/or publication of this article: G Albers has received consulting fees and expenses from Lundbeck for Steering Committee work and consulting fees from Concentric for serving on a Data Safely and Monitory Board. G Albers and R Bammer are equity shareholders in iSchemaView. Soren Christensen is a consultant for iSchemaview. G Donnan has received honoraria from Boehringer Ingelheim. S Davis has received honoraria from Boehringer Ingelheim.
Authors’ contributions
ATS: Conception and design, drafting the manuscript, analysis and interpretation of data. SC: Conception and design, data collection, interpretation of data and revising the manuscript for intellectual content. MS: Conception and design, data collection, revising the manuscript for intellectual content. MI: Acquisition of data and revising the manuscript. MGL, RB and GWA: Conception and design and revising the manuscript for intellectual content. MM: Data collection and revising the manuscript. MWP, GAD and SMD: Revising manuscript for intellectual content.
References
- 1.Albers GW, Thijs VN, Wechsler L, et al. Magnetic resonance imaging profiles predict clinical response to early reperfusion: the diffusion and perfusion imaging evaluation for understanding stroke evolution (DEFUSE) study. Ann Neurol 2006; 60: 508–517. [DOI] [PubMed] [Google Scholar]
- 2.Davis SM, Donnan GA, Parsons MW, et al. Effects of alteplase beyond 3 h after stroke in the Echoplanar Imaging Thrombolytic Evaluation Trial (EPITHET): a placebo-controlled randomised trial. Lancet Neurol 2008; 7: 299–309. [DOI] [PubMed] [Google Scholar]
- 3.Beaulieu C, de Crespigny A, Tong DC, et al. Longitudinal magnetic resonance imaging study of perfusion and diffusion in stroke: evolution of lesion volume and correlation with clinical outcome. Ann Neurol 1999; 46: 568–578. [DOI] [PubMed] [Google Scholar]
- 4.Lansberg MG, O’Brien MW, Tong DC, et al. Evolution of cerebral infarct volume assessed by diffusion-weighted magnetic resonance imaging. Arch Neurol 2001; 58: 613–617. [DOI] [PubMed] [Google Scholar]
- 5.Schwamm LH, Koroshetz WJ, Sorensen AG, et al. Time course of lesion development in patients with acute stroke: serial diffusion- and hemodynamic-weighted magnetic resonance imaging. Stroke 1998; 29: 2268–2276. [DOI] [PubMed] [Google Scholar]
- 6.Lansberg MG, Thijs VN, O’Brien MW, et al. Evolution of apparent diffusion coefficient, diffusion-weighted, and T2-weighted signal intensity of acute stroke. AJNR Am J Neuroradiol 2001; 22: 637–644. [PMC free article] [PubMed] [Google Scholar]
- 7.Yoo AJ, Sheth KN, Kimberly WT, et al. Validating imaging biomarkers of cerebral edema in patients with severe ischemic stroke. J Stroke Cerebrovasc Dis 2013; 22: 742–749. [DOI] [PMC free article] [PubMed] [Google Scholar]
- 8.Sener RN. Diffusion MRI: apparent diffusion coefficient (ADC) values in the normal brain and a classification of brain disorders based on ADC values. Comput Med Imaging Graph 2001; 25: 299–326. [DOI] [PubMed] [Google Scholar]
- 9.Latour LL, Warach S. Cerebral spinal fluid contamination of the measurement of the apparent diffusion coefficient of water in acute stroke. Magn Reson Med 2002; 48: 478–486. [DOI] [PubMed] [Google Scholar]
- 10.Lansberg MG, Lee J, Christensen S, et al. RAPID automated patient selection for reperfusion therapy: a pooled analysis of the Echoplanar Imaging Thrombolytic Evaluation Trial (EPITHET) and the Diffusion and Perfusion Imaging Evaluation for Understanding Stroke Evolution (DEFUSE) Study. Stroke 2011; 42: 1608–1614. [DOI] [PMC free article] [PubMed] [Google Scholar]
- 11.Ebinger M, Christensen S, De Silva DA, et al. Expediting MRI-based proof-of-concept stroke trials using an earlier imaging end point. Stroke 2009; 40: 1353–1358. [DOI] [PubMed] [Google Scholar]
- 12.Gaudinski MR, Henning EC, Miracle A, et al. Establishing final infarct volume: stroke lesion evolution past 30 days is insignificant. Stroke 2008; 39: 2765–2768. [DOI] [PMC free article] [PubMed] [Google Scholar]
- 13.Maclaren J, Han Z, Vos SB, et al. Test-retest reliability of brain volume measurements. In: Proceedings 21st scientific meeting, International Society for Magnetic Resonance in Medicine, Salt Lake City, Utah, 2013.
- 14.Ritzl A, Meisel S, Wittsack HJ, et al. Development of brain infarct volume as assessed by magnetic resonance imaging (MRI): follow-up of diffusion-weighted MRI lesions. J Magn Reson Imaging 2004; 20: 201–207. [DOI] [PubMed] [Google Scholar]