Abstract
Soluble amyloid-beta (Aβ) oligomers are the prime causitive agents of cognitive deficits during early stages of Alzheimer’s disease (AD). The transient nature of the oligomers makes them difficult to characterize by traditional techniques, suggesting that advanced approaches are necessary. Previously developed fluorescence-based tethered approach for probing intermolecular interactions (TAPIN) and AFM-based single-molecule force spectroscopy are capable of probing dimers of Aβ peptides. In this paper, a novel polymer nanoarray approach to probe trimers and tetramers formed by the Aβ(14–23) segment of Aβ protein at the single-molecule level is applied. By using this approach combined with TAPIN and AFM force spectroscopy, the impact of pH on the assembly of these oligomers was characterized. Experimental results reveal that pH affects the oligomer assembly process. At neutral pH, trimers and tetramers assemble into structures with a similar stability, while at acidic conditions (pH 3.7), the oligomers adopt a set of structures with different lifetimes and strengths. Models for the assembly of Aβ(14–23) trimers and tetramers based on the results obtained is proposed.
Graphical Abstract
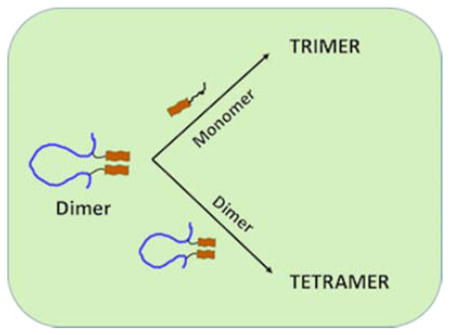
A polymeric nanoarray strategy was used for the first time to probe amyloid nano-assemblies from Aβ(14–23) peptides. This strategy combined with single-molecule studies enables different types of nano-assemblies of amyloid oligomers to be characterized. Single-molecule studies suggest that changes in pH alter the assembly process. Models for Aβ(14–23) trimers and tetramers are proposed.
1. Introduction
Protein folding aberrations are important pathogenic causes of numerous neurodegenerative diseases, including Alzheimer’s disease (AD).1, 2 Aggregation of amyloid-beta (Aβ) peptides into fibrils and accumulation of fibrils into senile plagues in the extracellular space in the brain is a hallmark of Alzheimer’s disease (AD).3–5 Although plagues are found in the extracellular space of brain cells, there is increasing evidence that Aβprocessing, accumulation, and assembly into soluble oligomers occurs inside cells.6, 7 Importantly, accumulated evidence suggests that oligomers in the form of dimers and trimers are the most neurotoxic species, rather than fibrillar assembles.8, 9 The majority of studies of amyloid oligomers were performed with the fibrillar type of assemblies because their stable nature allows the use of traditional structural analytical methods.10–12 These techniques are not amenable for the characterization of oligomers because they are transient species. Single-molecule biophysics techniques are capable of analyzing transient species, and a number of these approaches have been used to probe amyloid oligomers.13–15 We developed the AFM force spectroscopy approach to characterize the transiently assembled dimers of monomeric forms of amyloid peptides including Aβ40 and 42 variants and the full-size α-synuclein protein.16–18 These studies revealed that dimers are stabilized by strong interactions between monomers with lifetimes in the second timescale.19, 20 This finding was supported by direct measurements of lifetimes with the use of the single-molecule fluorescence tethered approach for probing of intermolecular interactions (TAPIN) method developed in our lab.21, 22 Aβ(14–23) segments of both Aβ40 and Aβ 42 proteins play a key role in the fibril assembly process by stabilizing the fibrils through the formation of an extended β-sheet structure.23 Because of their importance to fibril formation, isolated Aβ(14–23) and their assemblies are widely studied by various techniques.24–26 AFM force spectroscopy was used to probe interactions of Aβ(14–23) with its hairpin design.27 These studies revealed that the interaction between the Aβ(14–23) monomer with the hairpin is stronger than the interaction between two monomers. These findings suggest that the hairpin structure contributes to oligomer stability.
Although these studies provide strong support for the use of single-molecule biophysics methods, including AFM force spectroscopy, to characterize amyloid oligomers, additional approaches are needed to probe the higher order structures formed by the same monomeric units. One of these approaches is termed flexible nano array (FNA), in which the same two peptides are end-tethered inside of a flexible polymer to allow them to interact and form a dimer.28 This idea has been implemented in this paper for probing the trimer and tetramer. The advantages of AFM force spectroscopy and TAPIN approaches are that they can be employed in a broad range of environmental conditions, such as ionic strength and pH.22 The latter parameter is of particular interest for amyloid proteins because their assembly is dramatically facilitated at acidic pH.29, 30 The biological significance of such studies is supported by the fact that amyloid monomers and assemblies in vivo are encapsulated in endosomes and lysosomes that typically have an acidic pH.31, 32 AFM force spectroscopy and TAPIN were applied to probe interactions between dimers and monomers. Our results revealed that Aβ(14–23) trimers and tetramers at pH 7 assemble into complexes with a similar stability, but acidic condition (pH 3.7) result in the formation of several types of structures with different lifetimes and strengths. We present models explaining these results.
2. Materials and Methods
Materials
The FNA- Aβ(14–23) dimer was synthesized as described in our previous paper (Figure S1).28 HPLC purified cysteine-labeled HQKLVFFAED Aβ(14–23) was obtained from Peptide 2.0 (VA, USA). Cyanine 3-Maleimide (Cy3-MAL) was purchased from Lumiprobe Corporation (Florida, USA). MAL-PEG-SVA (M.wt 3400 g/mol) and mPEG-SVA (M.wt 2000 g/mol) were from Laysan Bio (Arab, AL), Tris-(2-Carboxyethyl) phosphine, Hydrochloride (TCEP) was from Hampton Research Inc. (CA, USA), β-mercaptoethanol and 1,1,1,3,3,3 Hexafluoroisopropanol (HFIP) were purchased from Sigma-Aldrich, USA. Maleimide-polyethylene glycol-silatrane (MAS) and 1-(3-aminopropyl) silatrane (APS) were synthesized as described in ref 33. All other commercial solvents were purchased from Sigma-Aldrich.
TAPIN measurements
(i) Surface functionalization
FNA- Aβ(14–23) dimers and the monomers were covalently attached to glass coverslips for the trimer and tetramer probing experiments. Glass coverslips were cleaned with chromic acid for 30 min, followed by multiple rinses with water. The coverslips were placed on a sample holder (PicoQuant, Berlin, Germany), and covered by a 0.1-mm-thick teflon spacer and a 25-mm-diameter quartz disk. The sample chambers were then treated with 167 μM MAS for 30 minutes and rinsed with water. Either the monomer or dimer solution (50 pM, pretreated with TCEP) was added to the chamber and incubated for 1 h, followed by multiple rinses with water. The surfaces were then treated with 10 mM 2-mercaptoethanol for 1 h to quench all MAL groups on the surface, followed by multiple rinses with water.
(ii) Data acquision and analysis
TAPIN experiments were performed with an objective-type TIRF microscope built around an Olympus IX71 microscope (Hitschfel Instruments, St. Louis, MO). An oil-immersion UPlanSApo 100× objective with 1.40 NA (Olympus, Tokyo, Japan) was used for all measurements. A laser line at 532 nm (ThorLabs Inc., New Jersey, USA) was used to excite the Cy3 labeled FNA-Aβ(14–23) dimer in total internal reflection fluorescence (TIRF) mode. The laser intensity was set to 250 mA for all experiments. Fluorescence emission was detected with an electron-multiplying charge-coupled-device camera (ImagEM Enhanced C9100-13, Hamamatsu, Bridgewater, NJ). TIRF videos of 2–3 minute durations were recorded at a temporal resolution of 100 ms.
TIRF images were processed and analyzed with Slidebook 5.0 software (Intelligent Imaging Innovations (3i), Denver, CO). Whenever a complex was detected, a confined area was circled out for further analysis. A typical trimer or tetramer showed a sudden increase in fluorescence intensity with an abrupt drop to background after a short time period. The bleached events, which did not show a sudden drop in intensity, were discarded from analysis. Hundreds of events were analyzed for each of the experiments and data were assembled into histograms. The average lifetime was then estimated by fitting the histograms with the Gaussian function. To achieve more accurate results, all fluorescence experiments were performed in triplicate. The following control experiments were performed prior to probing: photobleaching and blinking of Cy3 dye (Supporting Information, Figure S2), and nonspecific adsorption of Cy3 labeled dimer onto the working surface (Supporting Information, Figure S3).
AFM-force spectroscopy
(i) AFM tip functionalization
AFM tips (MSNL, Bruker, CA) were cleaned with ethanol, water, and UV (λ366 nm) light for 45 minutes. The amine functionalities on the tips were achieved by treating the tips with 100 μM APS for 30 minutes, followed by rinsing with water. To achieve fewer maleimide functionalities, the tips were dipped into a 100 μM solution of mPEG2000-SVA: MAL-PEG3400-SVA (molar ratio 50:1) in 10 mM sodium phosphate buffer (pH 7.0) for 1 h and rinsed with water. The thiol group of the FNA-Aβ(14–23) dimer was activated by treating with freshly prepared TCEP solution in sodium phosphate buffer (molar ratio 1:100). Finally, the tips were treated with 20 nM FNA-Aβ(14–23) dimer solution overnight at 4°C, and then rinsed with water. The unreacted maleimide groups on the tips were quenched with 10 mM β-mercaptoethanol, rinsed, and stored in water at 4°C until needed.
(ii) Surface functionalization
The freshly cleaved mica surfaces were modified with amino groups by treating the surfaces with 167 μM APS in water for 30 min. The surfaces were then treated with 167 μM SVA-PEG3400-MAL in DMSO for 1 h, followed by rinses with DMSO and water. The surfaces were covered with 40 nM of either Aβ(14–23) monomer or FNA Aβ(14–23) dimer (pretreated with TCEP) overnight at 4°C. The surfaces were washed and unreacted maleimide groups were quenched with β-mercaptoethanol, rinsed, and stored at 4°C until needed. Typically, the storage time was less than 24 h.
(iii) Force measurements and data analysis
AFM force experiments were done on MFP3D (Oxford Instruments, Santa Barbara, CA) using silicon nitride cantilevers (MSNL, Bruker, CA). Spring constants were determined by the thermal method specified by Igor Pro software, and measured spring constants were within the range of 20–30 pN/nm. All measurements were performed at room temperature, either in 10 mM sodium phosphate buffer (pH 7) or in 10 mM sodium acetate buffer (pH 3.7), with a retraction speed of 500 nm/s. For each pulling experiment, thousands of force curves were collected from different locations on the functionalized surface. The force curves corresponding to the characteristic rupture events were selected (typical yield 4–10%). The selected force curves were approximated with the WLC model to estimate rupture force (Fr) and contour length (Lc).18 The data were assembled into histograms for Fr and Lc and fitted with the Gaussian function.
3. Results and Discussions
Experimental system used
Figure 1 shows a schematic representation of how Aβ(14–23) peptide was probed in this paper. Figure 1A illustrates the FNA assembly of Aβ(14–23) monomers within the polymer, in which both monomers (shown as brown bars) are covalently attached at selected sites within the FNA polymer (shown in blue) using click chemistry (Figure S1).28 The distance between the monomers in extended form is ~12 nm. Due to high FNA flexibility, the monomers are assembled into dimers as shown schematically on the right of Figure 1A. Figure 1B illustrates the assembly of the trimer between the FNA-Aβ(14–23) dimer and a monomer, and the tetramer’s assembly is shown in Figure 1C. During AFM force spectroscopy probing, the FNA-Aβ(14–23) dimer construct was immobilized by its end-terminated thiol group onto the PEG-functionalized AFM tip, and the Aβ(14–23) monomer terminated with cysteine was tethered to the PEG-functionalized mica surface. For fluorescence probing experiments, the fluorescently-labeled FNA-Aβ(14–23) dimer was used to interact with the surface immobilized unlabeled Aβ(14–23) monomer or the FNA-Aβ(14–23) dimer.
Figure 1. Illustrations of the FNA approach to probe Aβ(14–23) trimers and tetramers.
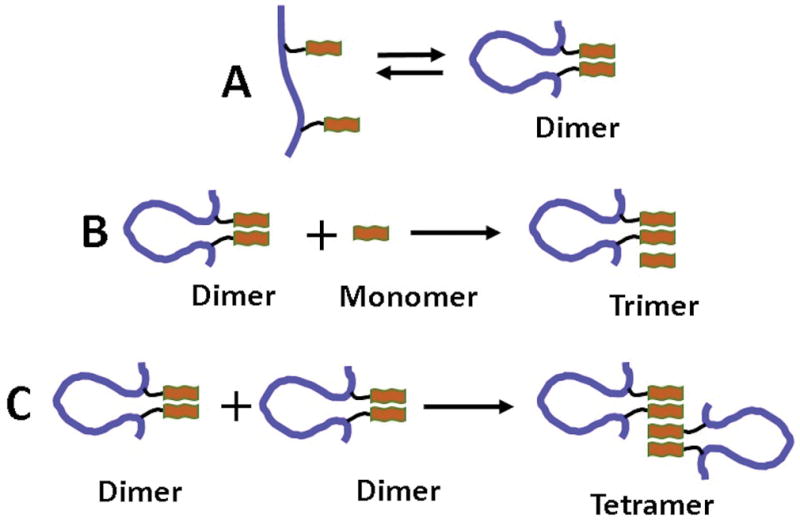
(A) Schematic presentation of the Aβ(14–23) dimer in the FNA tether; the flexibility of the PEG loop facilitates the ability of the two monomers to form a Aβ(14–23) dimer. (B), (C) Schematic presentation of probing strategies: the Aβ(14–23) dimer was assembled with a monomer to form a trimer, and two Aβ(14–23) dimers were assembled to construct a tetramer. The blue line and orange bar indicate the FNA tether and the Aβ(14–23) monomer, respectively.
Stability and strength of Aβ(14–23) trimers
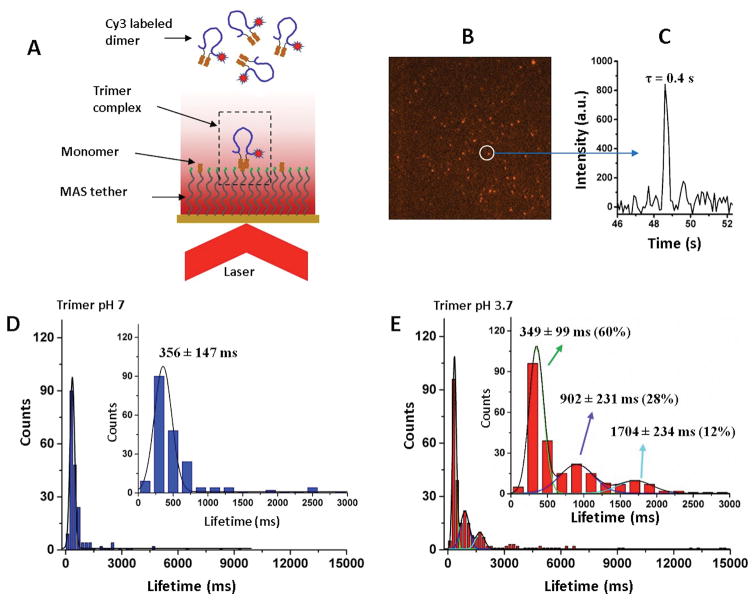
Figure 2A explains the TAPIN experiments during which trimer stability was probed with a fluorescently (Cy3) labeled FNA-Aβ(14–23) dimer. Unlabeled Aβ(14–23) was immobilized onto the PEG-functionalized cover slip and mounted on the top of the single-molecule fluorescence microscope operated in the total internal reflection mode (TIRF). A fluorescence burst occurs as the trimer assembles, and the fluorescence duration represents trimer stability. Figure 2B shows one of the typical TIRF images and Figure 2C shows the time trajectory from the spot circled in (B). The lifetimes were collected from several hundreds of such events and the data were plotted as histograms, as shown in Figure 2D. The histogram is symmetric at pH 7 and was fitted with a Gaussian. The calculated average lifetime for the oligomers is 356 ± 147 ms (mean ± S.D.) (Table 1).
Figure 2. Lifetime measurements for Aβ(14–23) trimers.
(A) The schematic of the TAPIN experimental setup. (B) A typical fluorescence image, showing several bright spots indicating the formation of trimer complexes. (C) A typical fluorescence time trajectory for the complex indicated by the arrow in (B) reveals that the lifetime of the complex is 0.4 second. (D) Lifetime histogram at pH 7 showing a narrow distribution and fitted with a single Gaussian (n=200). (E) Lifetime histogram at pH 3.7 showing a broad distribution and fitted with three Gaussians (n=263). The insets in (D) and (E) show zoomed histograms in the range of 0–3000 ms. N is the number of data points. The numbers after the lifetime values indicate the percentage yield of each type of complex, derived from the area of fitting. The lifetime values are shown as mean ± S.D.
Table 1.
Single-molecule results from AFM force spectroscopy and TAPIN lifetime measurements for trimer and tetramer interactions at pH 7 and 3.7.
| Probing system | Lifetime, τ (ms) | Rupture force, F (pN) |
|---|---|---|
| Trimer at pH 7 | τ = 357 ± 147 (100%) | F = 49 ± 16 (100%) |
| Trimer at pH 3.7 | τ1 = 349 ± 99 (60%) τ2 = 902 ± 231 (28%) τ3 = 1704 ± 234 (12%) |
F1 = 56 ± 13 (45%) F2 = 94 ± 19 (31%) F3 = 151 ± 36 (24%) |
| Tetramer at pH 7 | τ = 353 ± 167 (100%) | F = 45 ± 19 (100%) |
| Tetramer at pH 3.7 | τ1 = 352 ± 135 (63%) τ2 = 946 ± 261 (30%) τ3 =1702 ± 169 (7%) |
F1 = 74 ± 27 (64%), F2 = 169 ± 38 (29%) F3 = 250 ± 19 (7%) |
The numbers in parentheses indicate the percentage of each type of complex within the population.
Similar experiments were performed at pH 3.7 and the histogram for the lifetime distribution is shown in Figure 2E. The distribution is more complex and was approximated with three Gaussians, suggesting that three types of complexes were formed at acidic pH with lifetimes of 349 ± 99 ms, 902 ± 231 ms, and 1704 ± 234 ms. The yields for each type of complex are 60% (type 1), 28% (type 2), and 12% (type 3). An additional two more independent experiments under similar experimental conditions were performed to confirm the reproducibility of the lifetime results (See Figure S4, Table S1).
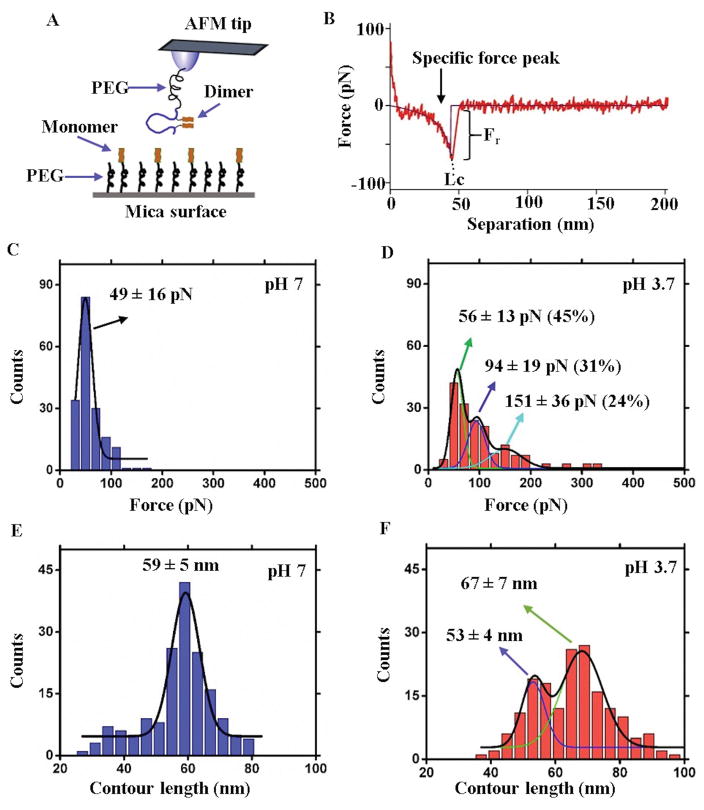
Binding interactions between the FNA-Aβ(14–23) dimer and the monomer were further investigated by AFM single-molecule force spectroscopy. A schematic of the experiments is shown in Figure 3A. The AFM tip was functionalized with the FNA-Aβ(14–23) dimer and the monomer was end-immobilized onto the mica surface that was functionalized with a PEG tether. The interaction between the dimer and monomer was probed by multiple approach-retraction steps, and complex formation was characterized by a specific rupture force event shown in Figure 3B. The position of the rupture peak, defined by stretching the PEG tethers, was a fingerprint for a specific rupture event. The force curve was approximated with the worm like chain (WLC) model,34 and the rupture force value was calculated from this approximation.18, 35 Experiments were performed at pH 7 and pH 3.7, and several hundred force curves were assembled into histograms for each pH value.
Figure 3. AFM single-molecule force spectroscopy study for Aβ(14–23) trimers.
(A) Schematic presentation of the experimental setup. (B) A representative force-distance (F–D) curve showing specific force peak values for the disociation of the trimer (shown by arrow). The purple line indicates the WLC fitting that estimates Fr and Lc. (C) Force histogram at pH 7 showing a narrow distribution and fitted with a single Gaussian (n=178). (D) Force histogram at pH 3.7 showing a broad distribution and fitted with three Gaussians (n=174). The numbers in parentheses indicate the percent of each type of complex within the population as calculated from the area under each fitting. (E) and (F) show the contour length distributions at pH 7 and 3.7, respectively, and n is the number of data points. The values are shown as mean ± S.D.
The force values distribution for pH 7 is shown in Figure 3C. The force values were grouped and approximated with a Gaussian with a maximum at 49 ± 16 pN. Similar experiments were performed at pH 3.7 and the force distribution data are shown in Figure 3D. The histogram for the force values is broad and was approximated with three distinct Gaussians. The force values corresponding to each peak are: 56 ± 13 pN (45%), 94 ± 19 pN (31%), and 151 ± 36 pN (24%) (see also Table 1). The numbers in parentheses indicate the percent of each type of complex within the population.
The AFM force spectroscopy approach also provides additional characteristics of interacting partners, including the location where protein segments interact. This value can be obtained from the contour length (Lc) values, as shown in Figure 3B. This contour length analysis was utilized previously for elucidating the interaction patterns for full-size Aβ and α-synuclein proteins.16–18 Here, we applied the same approach to characterize the assembly of trimers at different pH values. The Lc values were calculated from the force-distance curves using WLC estimation and the histograms corresponding to the results obtained for pH 7 and pH 3.7 are shown in Figures 3E and F, respectively. According to Figure 3E, the contour lengths at pH 7 produce a narrow distribution. The data were approximated with a single Gaussian, resulting in a peak at 59 ± 5 nm. This value corresponds to the combined length of two extended PEG tethers used for immobilization (50 ± 5 nm) and the position of the dimer from the FNA end (8 nm). The contour length distribution obtained at pH 3.7 is entirely different. It is broad and can be approximated with two Gaussians. The peaks values are 53 ± 4 nm and 67 ± 7 nm, suggesting that interactions between the monomer and dimer at acidic pH results in the assembly of different complex types (Figure 3F). Of particular note, there is a difference in the yields of trimers at different pH values, 4.5% at pH 7 and 8.7% at pH 3.7. This suggests that trimer assembly at acidic pH is almost two times more efficient than at pH 7 (Figure S6). Note that the experiments at both pH values were performed with the same AFM tip and mica surface.
Stability and strength of Aβ(14–23) tetramers
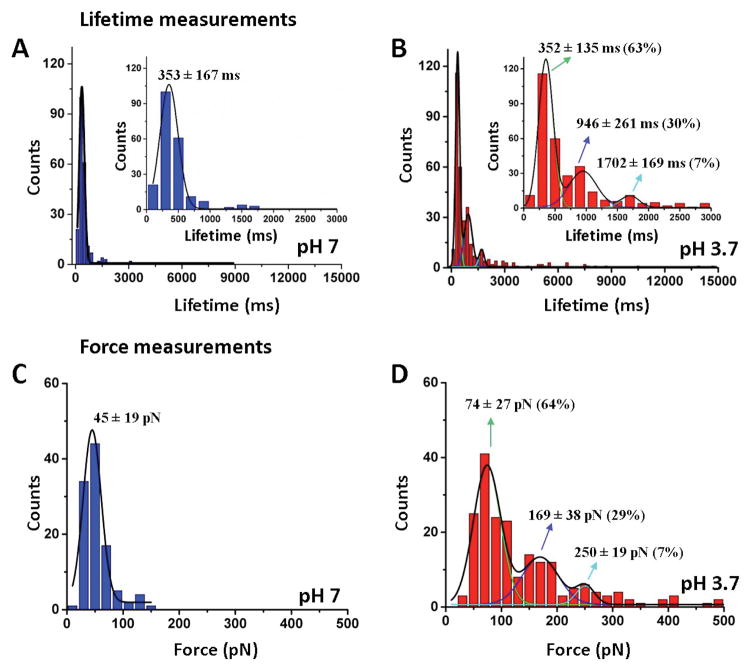
Next, we applied the same approach to characterize the tetramer assembly process with two FNA-Aβ(14–23) dimers. First, lifetime measurements were conducted with the TAPIN method. The schematic for the experiments was similar to the one shown in Figure 1A, except that unlabeled FNA-Aβ(14–23) dimers rather than monomers were immobilized onto the PEG-functionalized glass surface. The lifetime measurements for pH 7 are shown as a histogram in Figure 4A. The lifetime distribution is narrow and was approximated with a Gaussian, yielding a peak value of 353 ± 167 ms (mean ± S.D.). Note that this lifetime value is close to that obtained for trimers (356 ± 147 ms).
Figure 4. Characterization of Aβ(14–23) tetramers;
(A) and (B) Lifetime histograms at pH 7 (n=219) and 3.7 (n=360), respectively. (C) and (D) show force distributions at pH 7 (n=108) and 3.7 (n=202), respectively. The histograms are fitted with a single or multiple Gaussians. The lifetime and force values are represented as mean ± S.D. The numbers in parentheses indicate the percent of each type of complex within the population, and n is the number of data used.
Similar experiments were performed at pH 3.7. Unlike the data at pH 7, the acidic pH distribution is broad and was approximated with three Gaussians, resulting in parameters of 352 ± 135 ms (type 1), 946 ± 261 ms (type 2), and 1702 ± 169 ms (type 3) (Figure 4B, Table 1). The population yields for different types of oligomers vary with the most predominate species being type 1 (63%). Types 2 and 3 have relative populations of 30% and 7%, respectively. Similar to trimers, the reproducibility of tetramer lifetimes was checked by performing two additional independent experiments in similar conditions (see also Figure S5, Table S1).
The interaction between the FNA-Aβ(14–23) dimers was also probed with AFM force spectroscopy. The experimental setup was very similar to that in Figure 3A, except that dimers rather monomers were immobilized onto the surface. The rupture force histogram for pH 7 is shown in Figure 4C. The distribution is narrow with the peak maximum corresponding to 45 ± 19 pN, which is very close to the value obtained for trimers (49 ± 16 pN). Results for AFM probing experiments at pH 3.7 are shown in Figure 4D. The force distribution is broad with acidic conditions, and was approximated with three peaks at 74 ± 27 pN (64%), 169 ± 38 pN (29%), and 250 ± 19 pN (7%). The yields for each species are indicted in parentheses. Similar to trimer probing, the yield of rupture events at acidic pH is higher (10%) than at pH 7 (5.4%) (Figure S6). The contour lengths were also measured and the data for pH 7 and pH 3.7 are shown in Fig. S7A and B, respectively. The tetramer Lc distribution at neutral pH is narrow with a peak of 58 ± 7 nm. However, at pH 3.7 the data are scattered and can be approximated with two Gaussians (LC1 = 53 ± 3 nm, LC2 = 66 ± 5 nm).
Interaction pattern within the oligomers and proposed models
The results described above demonstrate that the FNA approach allowed us to probe interactions within Aβ(14–23) trimers and tetramers, leading to the identification of a number of novel properties of these nano-assemblies.
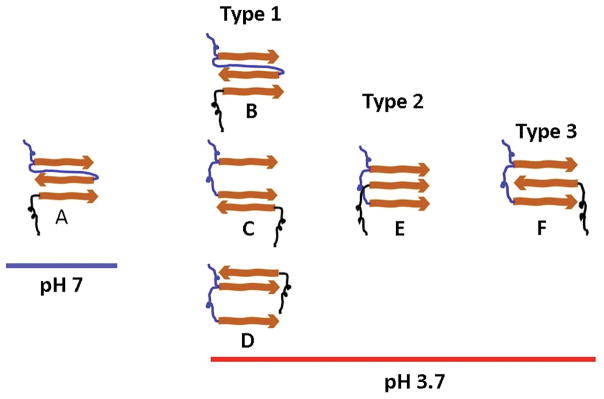
At neutral pH both trimers and tetramers have essentially the same lifetimes and very close rupture forces that are required for their dissociation. Information regarding the arrangement of the interacting partners can be obtained from the contour length measurements. According to Figure 3E and S7A, the contour length distributions at pH 7 are approximated by a single Gaussian that corresponds to the length of the extended PEG tethers combined with the flexible FNA segment (Figure 3A). On the basis of this finding, we developed models for the assembly of trimers and tetramers formed by FNA-Aβ(14–23) constructs, as shown in Figures 5A and S9A, respectively. In these models, dimers assembled within FNA do not dissociate during disassembly under the applied force. However, the pattern changes at pH 3.7.
Figure 5.
Schematic presentation of the hypothetical molecular arrangements for the oligomers during dimer-monomer interactions at pH 7 and 3.7. The blue and black linkers indicate FNA and PEG, respectively. The orange arrows indicate Aβ(14–23) monomers.
According to the contour length measurements (Figures 3F and S7B), two types of rupture events are observed. For trimer interactions, the position of the first peak (53 ± 3 nm) is very close to the position obtained at neutral pH (59 ± 5 nm), suggesting that dissociation occurs according to the same pattern without the rupture of the FNA dimers. We showed this pathway schematically in Figure 5B. The second peak in Figure 3F corresponds to the contour length 67 ± 7 nm. The difference between the two peaks, ~14 nm, is similar to the distance between the Aβ(14–23) monomers within the FNA tether, 12 nm, suggesting that the dimer within the trimer dissociates prior to the rupture of the trimer assembly. According to the dissociation pathway models for trimers (Figures 5C and D), the interaction between the monomers within the dimer is stronger than the interaction between the two Aβ(14–23) within the FNA assembly.
AFM force spectroscopy experiments also allow rupture forces to be determined. At neutral pH, the force distribution for trimer dissociation (Figure 3C) is narrow with a force of 49 ± 16 pN. This value is similar to the force of monomer-monomer interactions,25 suggesting that the interaction pattern of the Aβ(14–23) monomer with its dimer is similar to that for interactions between monomers. The results for acidic pH are entirely different. The force distribution is broad and was approximated by three peaks, 56 ± 13 pN, 94 ± 19 pN, and 151 ± 36 pN (Figure 3D and Table 1). Note that the measurements at both pH values were performed in parallel with the same tip-substrate pairs, thereby excluding potential concerns about sample variability. The value 56 ± 13 pN is quite close to the value 49 ± 16 pN obtained at neutral pH, while the two other peaks are quite different. These findings suggest that at acidic conditions, Aβ(14–23) trimers can adopt conformations different from those at pH 7. The events corresponding to the first peak comprise approximately half of all rupture events. The remaing half of the rupture events correspond to conformations different from those adopted by the trimer at pH 7. Our computational modeling in 36 showed that at neutral pH dimers adopt primarily out-of-register conformations that produce rupture forces of ~ 50 pN. This suggest that the monomers are assembled in out-of-register fashion in the trimers in Figure 5A–D. The second and third force peaks can be explained by the fact that the external monomer can make a sandwich-type structure in a parallel (Figure 5E) and an anti-parallel manner (Figure 5F), which needs a larger force to dissociate. The sandwich-type structure was identified in our recent studies of interactions between Aβ(14–23) hairpin and Aβ(14–23) monomer that produced complexes that ruptured at forces as large as ~180 pN.37
The lifetimes measured from the TAPIN experiments were qualitatively similar to those from AFM force probing experiments. At neutral pH, only one lifetime was observed, but three different lifetimes were found for trimers formed at acidic conditions. Lifetimes are directly proportional to rupture forces (i.e. longer lifetimes are associated with larger rupture forces); therefore, the most stable trimer has a lifetime of 1704 ± 234 ms and ruptures at an external force of 151 pN.
A scatter plot of the rupture force distributions and contour length measurements is shown in Figure S8, which correlates the force value with the type of trimer dissociation pathway. The graph demonstrates that strong rupture forces can be obtained at any contour length, suggesting that trimer dissociation occurs with or without opening of the dimer within FNA-Aβ(14–23).
We similarly analyzed the rupture process of the tetramer. Both probing approaches produced one peak (rupture force, contour length, and lifetime) at pH 7; therefore, one tetramer structure is formed under these conditions. These results demonstrate that this dissociation pathway does not involve dissociation of the dimers within the FNA template, as shown in Figure S9A. At acidic conditions, the dissociation pathways are complex, with three peaks each for rupture forces and lifetimes. Therefore, we can qualitatively assume that tetramers form with different conformations, and they can dissociate with and without dissociation of the dimers within the FNA template (Figure S9B–I). Note that rupture forces for each type of rupture event are larger than the forces for trimers (74 ± 27 pN, 169 ± 38 pN, and 250 ± 19 pN), suggesting that tetramers adopt stronger assemblies than trimers, which could contribute to the growth of Aβ(14–23) peptide aggregates.
It is a well-established fact that acidic conditions facilitate the aggregation process.38–40 The results presented here provide an explanation for this phenomenon – acidic pH increases the stability of trimers and tetramers. Importantly, the higher stability of tetramers over trimers is the driving force for aggregate growth. The detailed characterization of trimers and tetramers was possible due to the use of our FNA approach to assemble dimers.28, 41 This approach can be extended to oligomers longer than dimers and opens prospects for the characterization of larger order oligomers, which is our future goal.
4. Conclusions
The major finding of this paper is that oligomeric species of the same size can adopt a set of structures that differ in stability. Such a structural heterogeneity suggests that the amyloid self-assembly process is complex and can follow different pathways. Therefore, a traditional polymerization-type model for amyloid protein assembly should be revised by taking into account the structural heterogeneity of oligomers. However, traditional experimental approaches do not permit this type of characterization. The nanoarray-based approach developed in this paper is one method to overcome these hurdles. We also demonstrated that the structural heterogeneity of the oligomers depends on environmental conditions, such as pH, suggesting that aggregation pathways can be different depending on pH. This is another important finding because acidic pH is commonly used to accelerate the aggregation process; therefore, it is important to take into consideration the effect different conditions can have on the formation of different oligomeric structures and aggregation products.
Supplementary Material
Acknowledgments
We thank our lab members for their valuable suggestions and comments. The work was supported by grants to Y.L.L. from the National Institutes of Health (NIH: GM096039 and GM118006).
References
- 1.Skovronsky DM, Lee VMY, Trojanowski JQ. Annual Review of Pathology: Mechanisms of Disease. 2006;1:151–170. doi: 10.1146/annurev.pathol.1.110304.100113. [DOI] [PubMed] [Google Scholar]
- 2.Chiti F, Dobson CM. Annual review of biochemistry. 2006;75:333–366. doi: 10.1146/annurev.biochem.75.101304.123901. [DOI] [PubMed] [Google Scholar]
- 3.Querfurth HW, LaFerla FM. New England Journal of Medicine. 2010;362:329–344. doi: 10.1056/NEJMra0909142. [DOI] [PubMed] [Google Scholar]
- 4.Surguchev A, Surguchov A. Brain research bulletin. 2010;81:12–24. doi: 10.1016/j.brainresbull.2009.09.015. [DOI] [PubMed] [Google Scholar]
- 5.Annamalai K, Gührs KH, Koehler R, Schmidt M, Michel H, Loos C, Gaffney PM, Sigurdson CJ, Hegenbart U, Schönland S, Fändrich M. Angewandte Chemie International Edition. 2016;55:4822–4825. doi: 10.1002/anie.201511524. [DOI] [PMC free article] [PubMed] [Google Scholar]
- 6.Billings LM, Oddo S, Green KN, McGaugh JL, LaFerla FM. Neuron. 2005;45:675–688. doi: 10.1016/j.neuron.2005.01.040. [DOI] [PubMed] [Google Scholar]
- 7.Gouras GK, Tampellini D, Takahashi RH, Capetillo-Zarate E. Acta Neuropathologica. 2010;119:523–541. doi: 10.1007/s00401-010-0679-9. [DOI] [PMC free article] [PubMed] [Google Scholar]
- 8.Walsh DM, Selkoe DJ. Journal of neurochemistry. 2007;101:1172–1184. doi: 10.1111/j.1471-4159.2006.04426.x. [DOI] [PubMed] [Google Scholar]
- 9.Jana MK, Cappai R, Pham CL, Ciccotosto GD. Journal of neurochemistry. 2016;136:594–608. doi: 10.1111/jnc.13443. [DOI] [PubMed] [Google Scholar]
- 10.Colvin MT, Silvers R, Ni QZ, Can TV, Sergeyev I, Rosay M, Donovan KJ, Michael B, Wall J, Linse S, Griffin RG. Journal of the American Chemical Society. 2016;138:9663–9674. doi: 10.1021/jacs.6b05129. [DOI] [PMC free article] [PubMed] [Google Scholar]
- 11.Sachse C, Grigorieff N, Fandrich M. Angewandte Chemie (International ed in English) 2010;49:1321–1323. doi: 10.1002/anie.200904781. [DOI] [PMC free article] [PubMed] [Google Scholar]
- 12.Serpell LC. Biochimica et Biophysica Acta (BBA) - Molecular Basis of Disease. 2000;1502:16–30. doi: 10.1016/s0925-4439(00)00029-6. [DOI] [PubMed] [Google Scholar]
- 13.Orte A, Birkett NR, Clarke RW, Devlin GL, Dobson CM, Klenerman D. Proceedings of the National Academy of Sciences of the United States of America. 2008;105:14424–14429. doi: 10.1073/pnas.0803086105. [DOI] [PMC free article] [PubMed] [Google Scholar]
- 14.Yu H, Dee DR, Liu X, Brigley AM, Sosova I, Woodside MT. Proceedings of the National Academy of Sciences. 2015;112:8308–8313. doi: 10.1073/pnas.1419197112. [DOI] [PMC free article] [PubMed] [Google Scholar]
- 15.Brucale M, Schuler B, Samorì B. Chemical Reviews. 2014;114:3281–3317. doi: 10.1021/cr400297g. [DOI] [PubMed] [Google Scholar]
- 16.Kim BH, Palermo NY, Lovas S, Zaikova T, Keana JFW, Lyubchenko YL. Biochemistry. 2011;50:5154–5162. doi: 10.1021/bi200147a. [DOI] [PMC free article] [PubMed] [Google Scholar]
- 17.Krasnoslobodtsev AV, Volkov IL, Asiago JM, Hindupur J, Rochet JC, Lyubchenko YL. Biochemistry. 2013;52:7377–7386. doi: 10.1021/bi401037z. [DOI] [PMC free article] [PubMed] [Google Scholar]
- 18.Lv Z, Roychaudhuri R, Condron MM, Teplow DB, Lyubchenko YL. Scientific reports. 2013;3:2880. doi: 10.1038/srep02880. [DOI] [PMC free article] [PubMed] [Google Scholar]
- 19.Lyubchenko YL. AIMS Molecular Science. 2015;2:190–210. doi: 10.3934/molsci.2015.3.190. [DOI] [PMC free article] [PubMed] [Google Scholar]
- 20.Lyubchenko YL, Kim BH, Krasnoslobodtsev AV, Yu J. Wiley interdisciplinary reviews Nanomedicine and nanobiotechnology. 2010;2:526–543. doi: 10.1002/wnan.102. [DOI] [PubMed] [Google Scholar]
- 21.Lv Z, Krasnoslobodtsev AV, Zhang Y, Ysselstein D, Rochet JC, Blanchard SC, Lyubchenko YL. Biophysical journal. 2015;108:2038–2047. doi: 10.1016/j.bpj.2015.03.010. [DOI] [PMC free article] [PubMed] [Google Scholar]
- 22.Lv Z, Krasnoslobodtsev AV, Zhang Y, Ysselstein D, Rochet JC, Blanchard SC, Lyubchenko YL. Biopolymers. 2016;105:715–724. doi: 10.1002/bip.22874. [DOI] [PMC free article] [PubMed] [Google Scholar]
- 23.Zhang Y, Lyubchenko Yuri L. Biophysical journal. 107:2903–2910. doi: 10.1016/j.bpj.2014.10.053. [DOI] [PMC free article] [PubMed] [Google Scholar]
- 24.Tjernberg LO, Callaway DJ, Tjernberg A, Hahne S, Lilliehook C, Terenius L, Thyberg J, Nordstedt C. The Journal of biological chemistry. 1999;274:12619–12625. doi: 10.1074/jbc.274.18.12619. [DOI] [PubMed] [Google Scholar]
- 25.Lovas S, Zhang Y, Yu J, Lyubchenko YL. The Journal of Physical Chemistry B. 2013;117:6175–6186. doi: 10.1021/jp402938p. [DOI] [PMC free article] [PubMed] [Google Scholar]
- 26.Bu Z, Shi Y, Callaway DJ, Tycko R. Biophysical journal. 2007;92:594–602. doi: 10.1529/biophysj.106.091017. [DOI] [PMC free article] [PubMed] [Google Scholar]
- 27.Maity S, Lyubchenko YL. Jacobs journal of molecular and translational medicine. 2015;1:004. [PMC free article] [PubMed] [Google Scholar]
- 28.Maity S, Viazovkina E, Gall A, Lyubchenko Y. Journal of nature and science. 2016;2:e187. [PMC free article] [PubMed] [Google Scholar]
- 29.Su Y, Chang PT. Brain research. 2001;893:287–291. doi: 10.1016/s0006-8993(00)03322-9. [DOI] [PubMed] [Google Scholar]
- 30.Tipping KW, Karamanos TK, Jakhria T, Iadanza MG, Goodchild SC, Tuma R, Ranson NA, Hewitt EW, Radford SE. Proceedings of the National Academy of Sciences of the United States of America. 2015;112:5691–5696. doi: 10.1073/pnas.1423174112. [DOI] [PMC free article] [PubMed] [Google Scholar]
- 31.Pasternak SH, Callahan JW, Mahuran DJ. Journal of Alzheimer’s disease : JAD. 2004;6:53–65. doi: 10.3233/jad-2004-6107. [DOI] [PubMed] [Google Scholar]
- 32.Yang AJ, Chandswangbhuvana D, Margol L, Glabe CG. Journal of neuroscience research. 1998;52:691–698. doi: 10.1002/(SICI)1097-4547(19980615)52:6<691::AID-JNR8>3.0.CO;2-3. [DOI] [PubMed] [Google Scholar]
- 33.Shlyakhtenko LS, Gall AA, Lyubchenko YL. Methods in molecular biology (Clifton, NJ) 2013;931:295–312. doi: 10.1007/978-1-62703-056-4_14. [DOI] [PMC free article] [PubMed] [Google Scholar]
- 34.Bouchiat C, Wang MD, Allemand J, Strick T, Block SM, Croquette V. Biophysical journal. 1999;76:409–413. doi: 10.1016/s0006-3495(99)77207-3. [DOI] [PMC free article] [PubMed] [Google Scholar]
- 35.Portillo A, Hashemi M, Zhang Y, Breydo L, Uversky VN, Lyubchenko YL. Biochimica et biophysica acta. 2015;1854:218–228. doi: 10.1016/j.bbapap.2014.12.009. [DOI] [PMC free article] [PubMed] [Google Scholar]
- 36.Zhang Y, Lyubchenko Yuri L. Biophysical journal. 2014;107:2903–2910. doi: 10.1016/j.bpj.2014.10.053. [DOI] [PMC free article] [PubMed] [Google Scholar]
- 37.Maity S, Hashemi M, Lyubchenko Y. Scientific reports. 2017 doi: 10.1038/s41598-017-02454-0. Accepted. [DOI] [PMC free article] [PubMed] [Google Scholar]
- 38.McAllister C, Karymov MA, Kawano Y, Lushnikov AY, Mikheikin A, Uversky VN, Lyubchenko YL. J Mol Biol. 2005;354:1028–1042. doi: 10.1016/j.jmb.2005.10.012. [DOI] [PubMed] [Google Scholar]
- 39.Xu W, Zhang C, Derreumaux P, Gräslund A, Morozova-Roche L, Mu Y. PLOS ONE. 2011;6:e24329. doi: 10.1371/journal.pone.0024329. [DOI] [PMC free article] [PubMed] [Google Scholar]
- 40.Brännström K, Öhman A, Nilsson L, Pihl M, Sandblad L, Olofsson A. Journal of the American Chemical Society. 2014;136:10956–10964. doi: 10.1021/ja503535m. [DOI] [PubMed] [Google Scholar]
- 41.Krasnoslobodtsev AV, Zhang Y, Viazovkina E, Gall A, Bertagni C, Lyubchenko YL. Biophysical journal. 2015;108:2333–2339. doi: 10.1016/j.bpj.2015.03.040. [DOI] [PMC free article] [PubMed] [Google Scholar]
Associated Data
This section collects any data citations, data availability statements, or supplementary materials included in this article.


