Fig. 3.
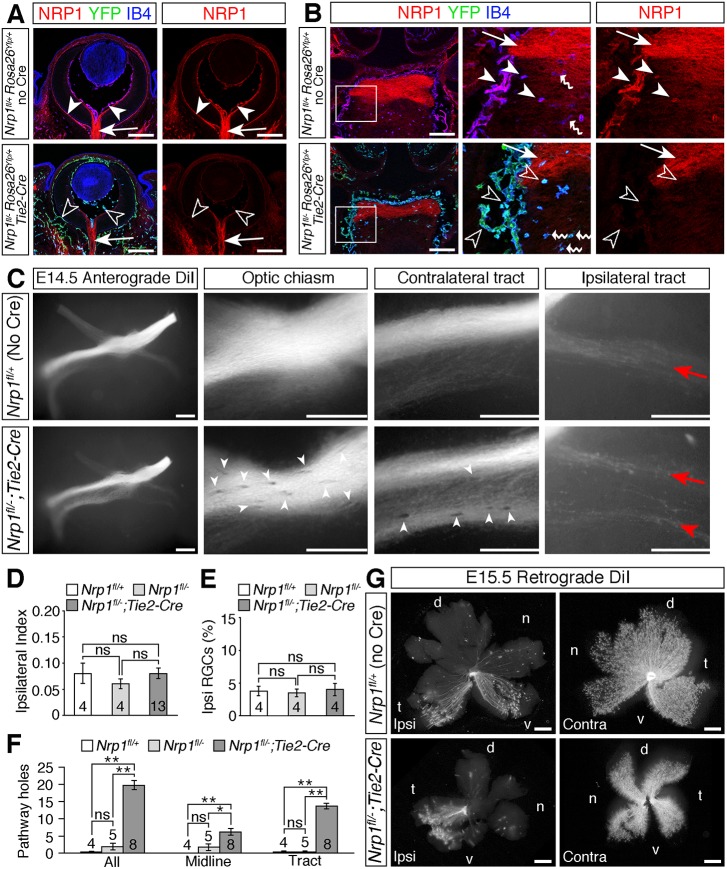
Loss of NRP1 from endothelial cells impairs RGC axon organisation. (A,B) Immunolabelling of E14.5 horizontal sections through the retina (A) and optic chiasm (B; anterior up) for NRP1 (red), IB4 (blue) and YFP (green) in control embryos (Nrp1fl/+;Rosa26Yfp/+; no Cre) and endothelial Nrp1 mutant embryos (Nrp1fl/−;Rosa26Yfp/+;Tie2-Cre). All three channels together or the single red (NRP1) channel are shown, as indicated. Purple indicates colocalisation of NRP1 and IB4 in endothelial cells and microglia. Boxed regions in B are shown at higher magnification in the adjacent panels. White arrowheads indicate NRP1-positive endothelial cells, unfilled arrowheads loss of NRP1 from endothelial cells in mutants, white arrows NRP1-positive RGC axons, wavy arrows IB4-positive microglia. (C) Whole-mount views of RGC axon bundles, labelled anterogradely with DiI in E14.5 control embryos (Nrp1fl/+, but no Cre) or littermates lacking NRP1 in endothelial cells (Nrp1fl/−;Tie2-Cre). Higher magnification views of the optic chiasm, contralateral optic tract and ipsilateral optic tract are shown to the right. Red arrows indicate the normal position and organisation of the ipsilateral projection, red arrowhead the splitting of the ipsilateral projection in the mutant, white arrowheads exclusion zones in the RGC axon bundles. (D-F) Ipsilateral index at E14.5 (D), proportion of ipsilateral RGCs relative to total number of RGCs in both eyes at E15.5 (E) and total number of exclusion zones (holes) in the optic pathway, at the optic chiasm (midline) or in the contralateral optic tract at E14.5 (F). Data are shown as mean±s.e.m.*P<0.05, **P<0.01; ns, not significant (D,E: one-way ANOVA; F: Kruskal–Wallis rank sum test with post-hoc Tukey). Numbers on bars indicate number of embryos analysed for each genotype. (G) Flat-mounted ipsilateral (ipsi) and contralateral (contra) retinas after retrograde labelling of RGC axons from one optic tract in E15.5 control embryos or mutant littermates lacking Nrp1 in endothelial cells. Although the retinal area is smaller in Nrp1fl/−;Tie2-Cre mutants, the ipsilaterally projecting RGCs are restricted to the ventrotemporal crescent, similar to the control retina. d, dorsal, n, nasal, t, temporal, v, ventral. Scale bars: 200 µm (A,B); 250 µm (C,G).

