

Summary
Besides the involvement of superior temporal regions in processing complex speech sounds, evidence suggests that the motor system may also play a role [1–4]. This suggests that the hearer may perceive speech by simulating the articulatory gestures of the speaker [5,6]. It is still an open question whether this simulation process is necessary to speech perception. Repetitive Transcranial Magnetic Stimulation was applied to premotor cortex to disrupt the ability to perform a phonetic discrimination task. Subjects were impaired in discriminating stop consonants in noise, but were unaffected in a control task which was matched in difficulty, task structure, and response characteristics. These results show that the disruption of human premotor cortex impairs speech perception, thus demonstrating an essential role of premotor cortices in perceptual processes.
Keywords: Transcranial Magnetic Stimulation, language, rTMS, superior temporal cortex
Results
When we say that we speak a language, we imply that we also understand it. This obvious fact reveals an important constraint on linguistic representations: language requires the maintenance of ‘parity’ between acoustic and articulatory representations for input and output respectively [5,6]. While each of these peripheral representations interfaces with a common conceptual core, their structural properties are very different: on one hand an acoustic signal with rich temporal and spectral structure, and on the other, intricate motor programs coordinating over one hundred muscles. The necessary close relationship between acoustic and articulatory forms raises the possibility that the motor system might play a role not only in producing speech but also in perceiving it. This idea is controversial [7] but theoretically important in that it assumes a role for motor mechanisms in perception. Recent neuroimaging [1,2] and single-pulse Transcranial Magnetic Stimulation [TMS] studies [3,4] have demonstrated neural activity in speech motor regions during passive speech perception. However, it is not known whether activity in motor areas is causally linked to the perception of speech.
To directly test the hypothesis that premotor regions are crucial for phonetic perception, we used functional magnetic resonance imaging (fMRI) to localize a left premotor cortical region (PMC) which is activated both during speech production and speech perception [1]. We then temporarily disrupted the activity of this region and of the left superior temporal gyrus (STG) with repetitive TMS (rTMS). This safe and painless method provides direct insight into the causal role of a given brain area in human behavior [8,9]. Subjects were tested on a speech perception task and two control tasks. The speech perception task involved discrimination of voiceless stop consonants in single syllables which were masked by white noise. All subjects also were tested in a color discrimination task, whereas a subgroup of subjects, were tested also in a tone discrimination task. Difficulty across tasks was equated, and the tasks had the same structure and required the same response (button press).
The average percentage of correct responses in the baseline condition was 78.9 ± 1.6 % (s.e.m.) for the speech perception task and 76.6 ± 2.6 % for the color perception task; these did not differ if compared using Student’s paired t-tests (p = 0.45).
Repeated measures analysis of variance (ANOVA) with the main factors “task” (speech perception, color discrimination) and “TMS condition” (no TMS (baseline), TMS to PMC, TMS to STG) showed a significant task × TMS condition interaction (p = 0.015).
Pairwise comparisons using Student’s paired t-test showed a highly significant decrease of the percentage of correct responses for the speech task after TMS stimulation of the PMC site compared to baseline (correct response rate after TMS to PMC 70.6 ± 2.0 %, p = 0.00097, all t-test results are reported two-tailed; effect size: Cohen’s d: 1.04), whereas the color perception task was unaffected (76.5 ± 2.6 % correct responses, p = 0.97). For the speech task, the rate of correct responses after PMC TMS was also significantly lower than after TMS to STG (p = 0.033; Cohen’s d: 0.45); the same comparison for the color perception task showed no difference (p = 0.59).
There was no effect of TMS to STG on correct response rate both for the speech and the color perception tasks (74.7 ± 2.2 % (speech, p = 0.12), 75.4 ± 2.4 % (color, p = 0.52) correct responses). Taken together, the results of this experiment show that TMS over the left premotor cortex affected speech perception but not color perception in a task matched for structure, number of responses and difficulty (Fig. 2).
Figure 2.

Percentage rate of correct answers for each task (phonetic discrimination, color discrimination) and each TMS site (baseline, PMC, STG). Error bars show standard error of the mean. TMS over PMC induced significant decrease of correct responses in the phonetic discrimination task, whereas TMS had no effect on the control task of color discrimination. TMS to STG did not affect performance of either task.
In a subgroup of participants (n=12), the effect of TMS over the left premotor cortex was additionally tested in a tone perception task, requiring recognition of pitch changes. ANOVA of this subgroup of subjects with the main factors “task” (speech, tone discrimination) and “TMS” (baseline, TMS to PMC, TMS to STG) revealed a main effect of TMS (p=0.026) as only significant effect. Therefore, subsequent posthoc t-tests were done combining data from the speech and tone task. These analyses revealed a significant decrease of correct response rate after TMS to PMC compared to baseline (p= 0.002; Cohen’s d: 0.71) and after TMS to STG compared to baseline (p= 0.047; Cohen’s d: 0.47).
Further pairwise t-tests showed a decrease of correct responses for the speech task after TMS to PMC compared to baseline (p= 0.02; Cohen’s d: 0.55), but not after TMS to STG compared to baseline (p=0.45) (baseline 80.6 ± 1.9 %, PMC 72.4 ± 1.8 %, STG 77.6 ± 2.5% correct responses).
For the tone task, a significant decrease of the correct response rate was noted for TMS to STG compared to baseline (p=0.02), but not for TMS to PMC (baseline 85.5 ± 2.5 %, PMC: 80.74 ± 3.33%, STG: 79.07 ± 4.17%) (Fig. 3). Color discrimination in the subgroup of 12 subjects was not affected by TMS applied to PMC and STG (baseline 76.36 ± 3.15%, PMC 76.57 ± 3.33%, STG 74.34 ± 3.21% all ps > 0.48 for Student’s t-tests). The comparisons of correct response rates between the TMS conditions revealed a strong trend towards a decrease of performance after TMS to PMC compared to TMS to STG for the speech condition (p=0.057), in line with the result of the entire group, but no difference for the tone condition (p=0.583). Taken together, these results indicate that TMS to both PMC and STG induce varying degrees of impairment in performance for perception of speech stimuli and nonspeech auditory stimuli. The TMS effect on speech perception was more pronounced after TMS to PMC, whereas the TMS effect on tone perception was more pronounced after TMS to STG.
Figure 3.

Percentage rate of correct answers for each task for the subgroup (n=12) performing an additional tone perception task. The TMS sites were the same like in the main group (baseline, PMC, STG). Error bars show standard error of the mean. Like in the entire group of subjects, TMS over PMC induced significant decrease of correct response rate in the phonetic discrimination task but not in the tone discrimination task. In contrast, TMS over the superior temporal gyrus indiced a decrease of performance in the tone perception task. However, ANOVA analysis of the subgroup data revealed a main effect of TMS condition but no significant task × TMS condition interaction, indicating that both regions play a role in the auditory perception processes tested.
Reaction times for the speech perception task showed a slight, non-significant increase compared to baseline both after TMS over left PMC and left STG, indicating that there was no speed-accuracy trade-off for the speech perception task (average reaction time baseline: 1081.3 ± 39.1 ms (s.e.m.), after PMC TMS: 1125.6 ± 46.5 ms, after STG TMS: 1101.7 ± 41.4 ms). Reaction times for the color discrimination task showed no significant differences across TMS conditions, as well. ANOVA analysis of the reaction time data for the speech task and color task with the main factors “task” and “TMS” (baseline, PMC TMS, STG TMS) showed a significant main effect of task (p<0.001), as reaction times for the color task were faster than for the speech task (average reaction time all speech conditions: 1102.9 ± 30.4ms, all color conditions: 920.6 ± 34.3ms).
Additional analyses were done to rule out possible order effects. One-way ANOVA on the experimental results grouping the error rates and reaction times according to session order and additional pairwise comparisons of these data using paired Student’s t-test showed no effects on accuracy or reaction time. Statistical analyses testing the order of experimental conditions within a given TMS session showed no significant effects.
Discussion
To the best of our knowledge, this is the first evidence showing that rTMS over motor areas affects any kind of perceptual process. We demonstrate that the left premotor cortex is crucially involved in speech perception but not in a color discrimination control task which was matched in difficulty, task structure, and response characteristics. The role of motor areas in speech perception has been previously suggested on the basis of theoretical considerations [5,6]. Recent imaging and TMS data have supported the involvement of motor areas in speech perception [1–4]. However, none of the previous studies tested the causal relationship between activity in motor areas and speech perception. The present results provide evidence that the congruency of sensory and motor activation in this area is not epiphenomenal. Rather, activity in the premotor cortical area stimulated here is essential for speech perception. The TMS-induced decrease in syllable discrimination performance cannot be due to a general effect on response selection, which is a classical function of prefrontal cortex [10], since the color discrimination task, also requiring response selection, was unaffected by TMS. Furthermore, we found not only a decrease of performance in the speech perception task after TMS to PMC compared to baseline but also relative to TMS to STG. Therefore it is highly unlikely that the behavioral effects observed after stimulating the premotor cortex reflect merely an indirect modulation of temporal auditory areas via functional connections between frontal and temporal regions [11].
Instead these data suggest that phonetic discrimination crucially depends not only on auditory processes in posterior perisylvian regions, but also on activity in the motor system. The results presented here are in line with a recent behavioral study which related the degree of phonemic awareness to individual motor skills [12] suggesting a common cortical architecture for development of motor abilities and discrimination of complex articulatory sound patterns. Furthermore, aphasia following lesions in left prefrontal regions can include deficits in phonemic perception, as well [13–16]. Additional support comes from studies using direct electrical stimulation of the cortex [17] which have demonstrated the importance of frontal regions for speech perception as well as speech production.
What is the role of the left premotor cortex within the cortical network mediating speech perception? Due to a recently proposed framework of speech perception, the premotor cortex is the anterior part of the ‘dorsal stream’, which provides auditory-motor mapping [18]. It is anatomically and functionally connected to superior temporal regions [11, 19, 20] and may be involved in phonetic discrimination, facilitating the mapping of perceived speech sounds onto internal motor representations of articulatory gestures [2–6]. Broca’s area, which is located more ventrally, has tight functional connections with premotor cortex and may also be involved in the process [21]. A recent fMRI study found that activation of both superior temporal and PMC areas is higher for perception of foreign language phonemes, which do not have a pre-existing phonetic cortical representation resulting from language acquisition, compared the native language phonemes [11]. The authors proposed that the premotor cortex generates forward models of native phonemes which are compared within the superior temporal cortex with the results from initial acoustic speech analysis. This hypothesis is supported by previous studies suggesting that the premotor cortex provides top-down information which facilitates speech perception in circumstances such as when the acoustic signal is degraded [22] or when explicit conscious access is required to phonetic form [18].
The lack of STG TMS effect on speech perception might be due to a larger auditory network for speech perception than tone perception; functional imaging studies have shown that initial stages of speech processing within the temporal cortex are represented bilaterally in areas specialized for voice processing [23, 24]. Data from split-brain patients and individuals with word deafness support this view [18]. Speech perception is a complex process which requires auditory signal analysis but also phonetic analysis thus involving a wide bilateral network within the superior temporal cortex [24, 25]. As TMS was applied only to the left STG, speech perception probably was preserved due to compensatory processes within the contralateral temporal cortex.
The involvement of premotor cortex in perception more generally has been motivated by a large body of work comprising electrophysiological investigations in monkeys and neuroimaging studies in humans [26]. There is evidence from functional imaging studies that there is a superordinate function of premotor cortex which, exceeding motor planning, also mediates attentional, intentional and perceptual integration of motor acts across modalities [27, 28]. Located between sensory areas providing multimodal representations of surrounding environment in the posterior part of the brain and anterior higher-order areas providing long-term planning and action selection, the premotor cortex is assocated with both motor control and motor awareness [29] and is also involved in attentional processes related to action [27]. “Mirror neurons” have been described in macaque monkeys which respond not only to the production of actions but also to the sight [29] or sound [30] of actions. Such a mirroring mechanism, by coupling action and perception, might hold the key to the maintenance of parity between senders and receivers of all sorts of messages, obviously including the ones more directly relevant to language. The present results demonstrate that the involvement of premotor cortex in perception is not merely epiphenomenal, and suggest that sensory regions are not sufficient alone for human perception. Rather, the perceptual representations of speech sounds, and perhaps sensory stimuli more generally, are fundamentally sensory-motor in nature.
Experimental Procedures
Participants
19 healthy subjects, with an age of 26.9 ± 2.2 (S.E.) years (all right handed; 11 males), and with normal or corrected to normal vision, participated in this experiment and were tested in speech and color perception. A subgroup of 12 subjects (mean age 26.6 ± 3.2 years, 6 males) was also tested on tone perception. All participants gave informed consent and the study was approved by the UCLA Institutional Review Board.
Experimental procedure
The experiment took place in a quiet shaded room. In each subject, the thresholds for phonetic discrimination and color discrimination tasks were determined using two separate adaptive procedures.
In the phonetic task, each trial consisted of presentation of a consonant-vowel syllable in noise, which the subject would identify as pa, ta or ka by pressing one of three keys. Syllables were synthesized using a Klatt synthesizer and standard parameter values for a male speaker [31]. The syllable durations were 170 ms. They were embedded in the center of a 600 ms Gaussian white noise mask. Stimuli were presented with MATLAB (Mathworks, Natick, MA) and the Psychophysics toolbox [32,33]. A 1-up-2-down adaptive staircase procedure was used. Thresholds were determined by taking the average of the last 4 reversals.
In the visual task, a circle of diameter 23 mm subtending 2.2° visual angle was presented for 600 ms against a black background. The circle was gray, but tinged with red, green or blue, and subjects would attempt to identify the color by pressing one of three keys. The brightness of each channel (red, green, blue) was 50%, except for the target channel which was increased by 3.5% initially, with a step size of 1.2% for the first 3 reversals and 0.4% thereafter.
The tone task was performed by a subset of subjects (n=12). It was identical to the speech task except that instead of syllables, tones were presented consisting of sine waves (1000 Hz, 1250 Hz, 1500 Hz; duration 200 ms). In the adaptive procedure, the same inital SNR and step size was used as in the speech task.
Subjects then were tested under the following conditions: baseline and after rTMS to the PMC or STG, as described below. The order of the experimental conditions was counterbalanced across subjects, and the interval between sessions was at least 60 minutes. Experiments with comparable rTMS parameters have shown that effects of magnetic stimulation last up to 20 mins [34,35]; thus, carry-over effects among the different TMS stimulation sessions after the chosen intersession time intervals were highly unlikely. In each condition, there were 60 phonetic discrimination trials and 60 color discrimination trials.
Individual error rates and averaged reaction times were analysed for all experimental conditions. A repeated-measures ANOVA model with the main factors “task” (speech perception, color perception) and “TMS condition” (no TMS, TMS to PMC, TMS to STG) was employed. Post-hoc comparisons were performed with Student’s t-tests.
Transcranial magnetic stimulation
TMS was applied using a Magstim Rapid Stimulator (Magstim, Spring Gardens, UK) with a figure-of eight-coil. Motor threshold was determined in the right first dorsal interosseus muscle and defined as the minimum stimulus intensity required to elicit Motor Evoked Potentials (MEP) in at least 5 of 10 trials. Stimulation intensity was 90% of individual resting motor threshold, with a maximum possible TMS intensity of 60% of maximum stimulator output. Mean stimulation intensity was 57.9 ± 0.7% (s.e.m.) for the main experiment and 56.9 ± 0.9% for the subgroup of the control experiment. For each of the sites stimulated, 900 pulses were applied at a frequency of 1 Hz (train duration 15 min). 1Hz rTMS stimulation has been shown to produce inhibitory modulation of cortical excitability over various cortical areas [i.e. 34,36].
The stimulation sites were located using frameless stereotaxy (BrainSight, Rogue Research, Montreal, Canada) at the beginning of the session. In 15 out of 19 subjects, individual activation peaks for speech perception were obtained using fMRI as described below. In the remaining four subjects, we used the average peak coordinates for left PMC and STG obtained from our previous speech perception study [1]. None of the subjects reported side effects of TMS.
Functional MRI localizer
Prior to the main TMS study, an MPRAGE structural volume MRI was acquired for registration purposes in all subjects (TR = 2300 ms; TE = 2.93 ms; flip angle = 8° 160 sagittal slices; 1.33 × 1.33 × 1.5 mm resolution; field of view = 256 × 256 × 240 mm).
Additionally, 15 of the 19 subjects were scanned with fMRI in order to individually localize frontal and temporal regions involved in speech perception. Functional images were acquired on a 3 T Siemens Allegra scanner. Two different experimental paradigms were used: in 10 subjects, the functional run was 128 s and comprised 5 blocks (16.5 s) of listening to the syllable [pa] at a rate of 1.33 Hz, interleaved with 5 blocks of rest (15.5 s). 64 EPI images were acquired (TR = 2000 ms; TE = 25 ms; flip angle = 90° 36 axial slices with interleaved acquisition; 3 × 3 × 4 mm resolution; field of view = 192 × 192 × 144 mm), plus two initial images which were discarded. In 5 subjects, an experimental design using the same EPI sequence was done with the following experimental conditions: perception or self-paced utterance of meaningless syllables [/pa/, /ta/, /ka/], viewing of a video showing both index fingers of a person tapping two pushbuttons, self-paced fingertapping with both index fingers. The functional run was 830 scans. During assessment of the threshold for Motor Evoked Potentials prior to the main experiment, the PMC site was stimulated in all subjects using an intensity of 120% of motor threshold. No Motor Evoked Potentials could be elicited in the contralateral hand in any of the subjects.
A standard analysis was carried out with SPM2 (http://www.fil.ion.ucl.ac.uk/spm). Superior temporal and premotor regions were activated during speech perception in every subject. The premotor region of interest is located posteriorly in the precentral gyrus and it is activated in every subject listening to speech [1, 11].
Figure 1.
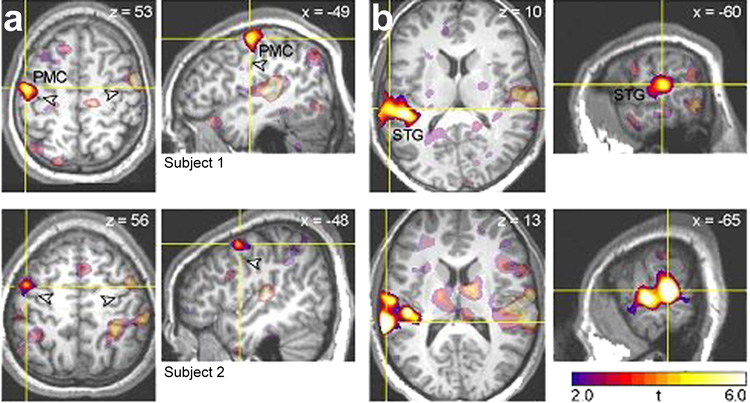
Representative fMRI activation peaks for speech perception for two subjects. Regions selected for stimulation are shown in bright colors; peak coordinates in these regions were used as targets for TMS in the main experiment. Other activated regions are shown in faded colors. (a) Left premotor cortex (PMC). Arrowheads show the location of the central sulcus. (b) Left superior temporal gyrus (STG).
Table 1.
MNI coordinates of voxels which were targeted for application of Transcranial Magnetic Stimulation over the superior temporal gyrus (STG) and the premotor cortex (PMC). These coordinates were voxels showing peak activation in a fMRI experiment on speech perception which was done prior to the TMS experiment (functional MRI localizer).
| STG | PMC | |||||
|---|---|---|---|---|---|---|
| x | y | z | x | y | z | |
| subj1 | −58 | −30 | 12 | −52 | −8 | 48 |
| subj2 | −54 | −28 | 6 | −44 | −4 | 46 |
| subj3 | −68 | −26 | 4 | −52 | 0 | 46 |
| subj4 | −66 | −24 | 4 | −48 | −4 | 50 |
| subj5 | −66 | −24 | 4 | −56 | −6 | 50 |
| subj6 | −62 | −24 | 10 | −58 | 2 | 46 |
| subj7 | −64 | −28 | 12 | −52 | −10 | 50 |
| subj8 | −66 | −24 | 4 | −50 | −4 | 54 |
| subj9 | −66 | −24 | 6 | −54 | −8 | 52 |
| subj10 | −64 | −30 | 10 | −52 | 0 | 48 |
| subj11 | −66 | −22 | 10 | −58 | −6 | 48 |
| subj12 | −66 | −28 | 8 | −58 | 0 | 48 |
| subj13 | −66 | −28 | 10 | −56 | −2 | 48 |
| subj14 | −62 | −30 | 10 | −54 | −10 | 48 |
| subj15 | −52 | −26 | 4 | −54 | −4 | 46 |
Acknowledgements
We thank Jonas Kaplan for help with the fMRI experiments. For generous support the authors wish to thank the Brain Mapping Medical Research Organization, Brain Mapping Support Foundation, Pierson-Lovelace Foundation, The Ahmanson Foundation, William M. and Linda R. Dietel Philanthropic Fund at the Northern Piedmont Community Foundation, Tamkin Foundation, Jennifer Jones-Simon Foundation, Capital Group Companies Charitable Foundation, Robson Family and Northstar Fund. The project described was supported by Grant Numbers MH68630 from the National Institute of Mental Health, and RR12169, RR13642 and RR00865 from the National Center for Research Resources (NCRR), a component of the National Institutes of Health (NIH); its contents are solely the responsibility of the authors and do not necessarily represent the official views of NIMH, NCRR or NIH. A.D.W is supported by NINDS K23-NS045764. I.G.M. is funded by the Deutsche Forschungsgemeinschaft (Grant ME 2104/3-1).
Footnotes
Conflict of interest The authors declare no conflict of interest.
Publisher's Disclaimer: This is a PDF file of an unedited manuscript that has been accepted for publication. As a service to our customers we are providing this early version of the manuscript. The manuscript will undergo copyediting, typesetting, and review of the resulting proof before it is published in its final citable form. Please note that during the production process errors may be discovered which could affect the content, and all legal disclaimers that apply to the journal pertain.
References
- 1.Wilson SM, Saygin AP, Sereno MI, Iacoboni M. Listening to speech activates motor areas involved in speech production. Nat. Neurosci. 2004;7:701–702. doi: 10.1038/nn1263. [DOI] [PubMed] [Google Scholar]
- 2.Pulvermuller F, Huss M, Kherif F, Moscoso del Prado Martin F, Hauk O, Shtyrov Y. Motor cortex maps articulatory features of speech sounds. Proc. Natl. Acad. Sci. U S A. 2006;103:7865–7870. doi: 10.1073/pnas.0509989103. [DOI] [PMC free article] [PubMed] [Google Scholar]
- 3.Fadiga L, Craighero L, Buccino G, Rizzolatti G. Speech listening specifically modulates the excitability of tongue muscles: a TMS study. Eur. J. Neurosci. 2002;15:399–402. doi: 10.1046/j.0953-816x.2001.01874.x. [DOI] [PubMed] [Google Scholar]
- 4.Watkins KE, Strafella AP, Paus T. Seeing and hearing speech excites the motor system involved in speech production. Neuropsychologia. 2003;41:989–994. doi: 10.1016/s0028-3932(02)00316-0. [DOI] [PubMed] [Google Scholar]
- 5.Liberman AM, Cooper FS, Shankweiler DP, Studdert-Kennedy M. Perception of the speech code. Psychol. Rev. 1967;74:431–461. doi: 10.1037/h0020279. [DOI] [PubMed] [Google Scholar]
- 6.Liberman AM, Whalen DH. On the relation of speech to language. Trends Cog. Sci. 2000;4:187–196. doi: 10.1016/s1364-6613(00)01471-6. [DOI] [PubMed] [Google Scholar]
- 7.Kuhl PK, Miller JD. Speech perception by the chinchilla: voiced–voiceless distinction in alveolar plosive consonants. Science. 1975;190:69–72. doi: 10.1126/science.1166301. [DOI] [PubMed] [Google Scholar]
- 8.Pascual-Leone A, Walsh V, Rothwell J. Transcranial magnetic stimulation cognitive neuroscience--virtual lesion, chronometry, and functional connectivity. Curr. Opin. Neurobiol. 2000;10:232–237. doi: 10.1016/s0959-4388(00)00081-7. [DOI] [PubMed] [Google Scholar]
- 9.Devlin JT, Watkins KE. Stimulating language: insights from TMS. Brain. 2007;130:610–622. doi: 10.1093/brain/awl331. [DOI] [PMC free article] [PubMed] [Google Scholar]
- 10.Passingham R. The frontal lobes and voluntary action. Oxford: Oxford University Press; 1993. [Google Scholar]
- 11.Wilson SM, Iacoboni M. Neural responses to non-native phonemes varying in producibility: Evidence for the sensorimotor nature of speech perception. Neuroimage. 2006;33:316–325. doi: 10.1016/j.neuroimage.2006.05.032. [DOI] [PubMed] [Google Scholar]
- 12.Carello C, LeVasseur VM, Schmidt RC. Movement sequencing and phonological fluency in (putatively) nonimpaired readers. Psychol. Sci. 2002;13:375–379. doi: 10.1111/1467-9280.00467. [DOI] [PubMed] [Google Scholar]
- 13.Basso A, Casati G, Vignolo LA. Phonemic identification defects in aphasia. Cortex. 1977;13:84–95. doi: 10.1016/s0010-9452(77)80057-9. [DOI] [PubMed] [Google Scholar]
- 14.Blumstein SE, Cooper WE, Zurif EB, Caramazza A. The perception and production of voice onset time in aphasia. Neuropsychologia. 1977;15:371–383. doi: 10.1016/0028-3932(77)90089-6. [DOI] [PubMed] [Google Scholar]
- 15.Caplan D, Gow D, Makris N. Analysis of lesions by MRI in stroke patients with acoustic-phonetic processing deficits. Neurology. 1995;45:293–298. doi: 10.1212/wnl.45.2.293. [DOI] [PubMed] [Google Scholar]
- 16.Gainotti G, Miceli G, Silveri MC, Villa G. Some anatomo-clinical aspects of phonemic and semantic comprehension disorders in aphasia. Acta Neurol. Scand. 1982;66:652–665. doi: 10.1111/j.1600-0404.1982.tb04530.x. [DOI] [PubMed] [Google Scholar]
- 17.Ojemann GA. Brain organization for language from the perspective of electrical stimulation mapping. Behav. Brain Sci. 1983;2:189–230. [Google Scholar]
- 18.Hickok G, Poeppel D. The cortical organization of speech processing. Nat. Rev. Neurosci. 2007;8:393–402. doi: 10.1038/nrn2113. [DOI] [PubMed] [Google Scholar]
- 19.Scott SK, Wise RJ. The functional neuroanatomy of prelexical processing in speech perception. Cognition. 2004;92:13–45. doi: 10.1016/j.cognition.2002.12.002. [DOI] [PubMed] [Google Scholar]
- 20.Catani M, Jones DK, ffytche DH. Perisylvian language networks of the human brain. Ann. Neurol. 2005;57:8–16. doi: 10.1002/ana.20319. [DOI] [PubMed] [Google Scholar]
- 21.Watkins K, Paus T. Modulation of motor excitability during speech perception: the role of Broca’s area. J. Cogn. Neurosci. 2004;16:978–987. doi: 10.1162/0898929041502616. [DOI] [PubMed] [Google Scholar]
- 22.Callan DE, Jones JA, Callan AM, Akahane-Yamada R. Phonetic perceptual identification by native- and second-language speakers differentially activates brain regions involved with acoustic phonetic processing and those involved with articulatory-auditory/orosensory internal models. NeuroImage. 2004;22:1182–1194. doi: 10.1016/j.neuroimage.2004.03.006. [DOI] [PubMed] [Google Scholar]
- 23.Belin P, Zatorre RJ, Lafaille P, Ahad P, Piken B. Voice-selective areas in human auditory cortex. Nature. 2000;403:309–312. doi: 10.1038/35002078. [DOI] [PubMed] [Google Scholar]
- 24.Uppenkamp S, Johnsrude IS, Norris D, Marslen-Wilson W, Patterson RD. Locating the initial stages of speech-sound processing in human temporal cortex. Neuroimage. 2006;31:1284–1296. doi: 10.1016/j.neuroimage.2006.01.004. [DOI] [PubMed] [Google Scholar]
- 25.Warren JE, Wise RJ, Warren JD. Sounds do-able: auditory-motor transformations and the posterior temporal plane. Trends Neurosci. 2005;28:636–643. doi: 10.1016/j.tins.2005.09.010. [DOI] [PubMed] [Google Scholar]
- 26.Rizzolatti G, Craighero L. The mirror-neuron system. Annu. Rev. Neurosci. 2004;27:169–192. doi: 10.1146/annurev.neuro.27.070203.144230. [DOI] [PubMed] [Google Scholar]
- 27.Schubotz RI, von Cramon DY. Functional-anatomical concepts of human premotor cortex: evidence from fMRI and PET studies. Neuroimage. 2003;20(Suppl 1):S120–S131. doi: 10.1016/j.neuroimage.2003.09.014. [DOI] [PubMed] [Google Scholar]
- 28.Berti A, Bottini G, Gandola M, Pia L, Smania N, Stracciari A, Castiglioni I, Vallar G, Paulesu E. Shared cortical anatomy for motor awareness and motor control. Science. 2005;309:488–491. doi: 10.1126/science.1110625. [DOI] [PubMed] [Google Scholar]
- 29.Gallese V, Fadiga L, Fogassi L, Rizzolatti G. Action recognition in the premotor cortex. Brain. 1996;119:593–609. doi: 10.1093/brain/119.2.593. [DOI] [PubMed] [Google Scholar]
- 30.Kohler E, Keysers C, Umilta MA, Fogassi L, Gallese V, Rizzolatti G. Hearing sounds, understanding actions: action representation in mirror neurons. Science. 2002;297:846–848. doi: 10.1126/science.1070311. [DOI] [PubMed] [Google Scholar]
- 31.Allen J, Hunnicutt MS, Klatt D. From text to speech: The MITalk system. Cambridge: Cambridge University Press; 1987. [Google Scholar]
- 32.Brainard DH. The psychophysics toolbox. Spatial Vision. 1997;10:433–436. [PubMed] [Google Scholar]
- 33.Pelli DG. The VideoToolbox software for visual psychophysics: transforming numbers into movies. Spatial Vision. 1997;10:437–442. [PubMed] [Google Scholar]
- 34.Gerschlager W, Siebner HR, Rothwell JC. Decreased corticospinal excitability after subthreshold 1 Hz rTMS over lateral premotor cortex. Neurology. 2001;57:449–455. doi: 10.1212/wnl.57.3.449. [DOI] [PubMed] [Google Scholar]
- 35.Mottaghy FM, Gangitano M, Horkan C, Chen Y, Pascual-Leone A, Schlaug G. Repetitive TMS temporarily alters brain diffusion. Neurology. 2003;60:1539–1541. doi: 10.1212/01.wnl.0000058903.15205.46. [DOI] [PubMed] [Google Scholar]
- 36.Lewald J, Meister IG, Weidemann J, Topper R. Involvement of the superior temporal cortex and the occipital cortex in spatial hearing: evidence from repetitive transcranial magnetic stimulation. J. Cogn. Neurosci. 2004;16:828–838. doi: 10.1162/089892904970834. [DOI] [PubMed] [Google Scholar]