

Abstract
Reversed-phase HPLC with derivatization using o-phthalaldehyde (OPA) and sulfite allows electrochemical detection of γ-aminobutyric acid (GABA) in microdialysis samples. However, OPA/sulfite derivatives have been reported to produce lower fluorescent yield than OPA derivatives using organic thiols as the nucleophile. To overcome this limitation we examined excitation and emission spectra, reaction time, pH, and concentration of reagents in the derivatization solution. Optimal detection parameters were determined as λex=220 nm and λem=385 nm for maximal fluorescence. The derivatization reaction occurred immediately and the product was stable up to 24 hours. A pH of 10.4 for the borate buffer used in the derivatization solution was significantly better than lower pH. Increasing the amount of sulfite combined with diluting the derivatization solution in borate buffer resulted in complete separation of the GABA peak from contaminants without any loss in signal. Controlling the temperature of the detector at 15°C significantly improved sensitivity with a detection limit of approximately 1 nM. To validate this assay, we performed microdialysis in the dorsal striatum and ventral tegmental area (VTA) of adult Long Evans rats. GABA concentrations in dialysates were determined using external standards and standard additions, in order to further confirm interfering peaks were not present in biological samples. Within the dorsal striatum (n=4), basal GABA concentrations were 12.9±2.2 and 14.5±2.2 nM (external and additions, respectively). Respective basal GABA concentrations in the VTA (n=3) were 4.6±1.1 and 5.1±0.6 nM. Thus, we have developed a novel, sensitive fluorescence method to determine GABA in microdialysates using HPLC of an OPA/sulfite derivative.
Keywords: fluorescence, GABA, HPLC, microdialysis, OPA, sulfite
1. Introduction
γ-aminobutyric acid (GABA) is the primary amino acid neurotransmitter involved in inhibitory synaptic transmission and alterations in GABAergic signaling contribute to many neurological conditions including epilepsy, schizophrenia and anxiety disorders [1]. Microdialysis is a technique commonly used in basic and clinical neuroscience to measure the concentration of GABA in the extracellular space [2,3]. Many separation approaches exist for analysis of amino acid neurotransmitters, although high performance liquid chromatography (HPLC) remains one of the most widely used in neuroscience [3]. However, GABA is neither fluorescent nor electroactive and therefore requires a derivatization procedure for detection by these methods [3,4].
One of the most well characterized derivatization reagents used for analysis of amino acid neurotransmitters is o-phthalaldehyde (OPA), which reacts with amines in the presence of a nucleophile to form electroactive and/or fluorescent isoindole derivatives [4–7]. The use of OPA in conjunction with thiols (e.g. 2-mercaptoethanol (MCE), 3-mercaptopropionic acid (MPA)) has been widely used for both electrochemical (ECD) or fluorescence detection (FLD) of low concentrations of GABA in microdialysis samples [8–14]. However, thiol derivatives can be unstable [6,15]. This can be particularly problematic when quantifying GABA in microdialysis samples due to highly specific chromatographic conditions required for separation [13]. OPA/N-acetyl-L-cysteine (NAC) derivatives are more stable than other thiols and this method can be used for detection of enantiomeric amino acids, however there is a pungent odor associated with using thiol derivatives [16–18].
An alternative to thiols is using OPA in the presence of a sulfite group as the nucleophile to form an N-alkyl-1-isoindole sulfonate derivative that has been reported to be more stable than thiol-formed derivatives [19,20]. OPA/sulfite derivatization has been successfully used in multiple applications to measure GABA in brain microdialysates using ECD [20–23]. These ECD methods require high working potentials (0.7–0.85 V) for GABA detection and can result in more frequent maintenance of the electrochemical cell. In contrast, FLD offers advantages in ease of operation and stability over long periods of time. However, OPA/sulfite derivatives were reported to be significantly less fluorescent than derivatives using OPA/thiol combinations and not useful for high sensitivity analysis of GABA in microdialysis samples [24].
Previous studies using FLD quantified GABA in tissue or brain microdialysates using OPA/thiol derivatives reported ranges of 330–365 nm and 420–530 nm for excitation (λex) and emission (λem) wavelengths, respectively [25–28]. Recently, excitation and emission spectra were thoroughly examined for amino acids derivatized with OPA/MPA, including GABA. These authors observed the maximal signal for the OPA/MPA derivative of GABA occurred at λex=229 nm and λem =450 nm, which resulted in a six-fold greater signal compared to previous wavelengths used [29]. Therefore, we hypothesized the low fluorescence yield previously reported for OPA/sulfite derivatives may have been due to suboptimal detection parameters.
Thus, the aim of the present study was to develop a sensitive method for quantification of GABA in brain microdialysis samples using HPLC-FLD of an OPA/sulfite derivative. We determined optimal detection wavelengths, derivatization components, and reaction procedures for analysis of GABA. Additionally, we used in vivo microdialysis to quantify extracellular GABA in the dorsal striatum or ventral tegmental area (VTA) of Long Evans rats using external standards and standard additions to validate our method.
2. Materials and methods
2.1. Reagents
GABA, GABase from Pseudomonas fluorescens, OPA, sodium dihydrogen phosphate dihydrate, sodium sulfite and sodium tetraborate decahydrate were obtained from Sigma (Sigma-Aldrich, Saint Louis, MO, USA). Methanol was purchased from Fisher Scientific (Fisher Scientific, Fair Lawn, NJ, USA) and absolute ethanol from AAPER (AAPER Alcohol and Chemical Co., Shelbyville, KY, USA). Artificial cerebral spinal fluid (ACSF) for microdialysis experiments consisted of 149 mM NaCl, 2.8 mM KCl, 1.2 mM CaCl2, 1.2 mM MgCl2 5.4 mM D-glucose. All solutions were made with deionized water obtained from a Milli-Q system (Millipore, Billerica, MA, USA) and filtered using 0.2 μm nylon filters (Pall Corp., Ann Arbor, MI, USA).
2.2. Instrumentation
2.2.1. Liquid chromatography
HPLC separation was achieved using a Luna C18(2) column (150 × 1.0 mm, 3 μm; Phenomenex, Torrance, CA, USA), Antec LC110 pump (Antec Leyden, Zoeterwoude, Netherlands), in-line degasser, column compartment (maintained at 40°C) equipped with a manual injector (9725i Rheodyne, Cotati, CA, USA) and polyetheretherketone (PEEK) 20 μl injection sample loop. Mobile phase was pumped at 0.05–0.1 ml/min. Injection volume varied from 5 to 10 μl using Hamilton syringes (Models 1702 or 705, Hamilton Co., Reno, NV, USA).
2.2.2. Mobile phase
The mobile phase consisted of 0.1 M sodium dihydrogen phosphate dihydrate (NaH2PO4 · 2H2O) adjusted to pH 4.5 using 1 M phosphoric acid and 10–18% (v/v) methanol added to optimize chromatography.
2.2.3. Fluorescence detection
Analyte detection was achieved using a Jasco FP-4020 fluorescence detector with a 12.7 μl analytical flow cell (Jasco Corp., Tokyo, Japan). The detector gain was set to 1000, and the response time was 3 seconds. We attached a borosilicate glass coverslip to the flow cell to serve as an emission filter (Fisher Scientific, Fair Lawn, NJ, USA). According to the manufacturer, the glass coverslip achieves maximal transmittance (≥90%) at 360 nm. Slit widths of 20 nm for excitation and 40 nm for emission were used.
Optimal wavelengths were determined by performing excitation and emission scans using the Jasco FP-4020. Differences in signal of the GABA derivatization product (1 μM) and the mobile phase were calculated for corresponding scans. Scans were triggered manually after the peak passed a threshold point of half the total signal of the GABA peak, and were taken at a scan speed of 200 nm/sec. Scans were performed at a gain set at 100 to ensure outputs were on scale.
Chromeleon 6.8 Chromatography Data System software (Thermo Fisher Scientific, Waltham, MA, USA) was used for data acquisition and analysis. All experiments were run at minimum in triplicate across days. Chromatographic peaks were required to have a signal to background noise ratio of at least 3:1 for analysis.
2.3. Derivatization procedure
The derivatization working solution was made by dissolving 11 mg o-phthaldialdehyde (OPA) in 250 μl absolute ethanol, 250 μl 1 M sodium sulfite (sulfite; Na2SO3) and 4.5 ml 0.1 M sodium tetraborate decahydrate (borate; Na2B4O7 · 10H2O; adjusted to pH 10.4 with 5 M NaOH) according to the methods of Smith and Sharp [21]. During the optimization experiments, final volumes of sulfite and borate buffer used in working solution were adjusted to improve chromatography (detailed in Section 3.3). The sulfite solution was made every 2 days and the borate solution made every 7 days. Both solutions were stored in glass at room temperature. The OPA/sulfite working solution was stored in covered plastic vials at 4°C up to 24 hours. Stock GABA standards were prepared by dissolving GABA in deionized water at a concentration of 1 mM and stored at 4°C for up to 1 month. Standard dilutions were made fresh daily in either water or borate buffer based on the experiment. Polypropylene centrifuge tubes were used for standard and sample tubes to reduce loss of GABA by adsorption [20,30].
The derivatization procedure consisted of combining 9 μl of GABA standard or sample with 2 μl borate and then adding 0.5 μl OPA working solution. Experiments for optimization used 500 nM GABA, and any exceptions to this are indicated in the results. The additional borate added to the reaction mixture was used to obtain more reproducible separation. This reaction mixture was manually mixed with a pipette and incubated at room temperature in darkness.
2.4. In vivo microdialysis procedures
Adult, male Long Evans rats (n=7; 290–301 g upon arrival; Charles River Laboratories, Raleigh, NC, USA) were surgically implanted with a 21 gauge guide cannula (Plastics One, Roanoke, VA, USA) above the dorsal striatum (in mm relative to bregma and skull surface: 0.0 antero-posterior, +3.7 lateral, −3.0 ventral) or ventral tegmental area (VTA; −5.8 antero-posterior, +2.1 lateral, −4.6 ventral, angled 10° toward midline) using procedures similar to our previous studies [31]. The dorsoventral coordinate represents the bottom of the guide cannula, and the probes for either brain region extend 4.0 mm below the cannula when seated into the guide. Animals were allowed at least 5 days of recovery prior to microdialysis experiments.
Microdialysis probes (length of probe active area: dorsal striatum 3 mm, VTA 1 mm; 13,000 molecular weight cutoff) were constructed similar to Pettit and Justice [32] and implanted 12–18 hours prior to experiments. Probes were perfused with ACSF at 0.2 μl/min flow rate overnight, and then increased to 1.0 (VTA) or 2.0 μl/min (dorsal striatum) at least two hours prior to dialysis sampling. Microdialysis sampling occurred during 0800–1600, during the light cycle of the animals. Dialysis samples were immediately frozen on dry ice and stored at −80°C until analysis. Microdialysis probe placements were confirmed via histological analysis. All animal procedures complied with the National Institutes of Health Guide for Care and Use of Laboratory Animals (8th Ed., 2011) and were approved by the Institutional Animal Care and Use Committee of the University of Texas at Austin.
2.5. Standard additions
Basal dialysates were pooled for each rat. Each pooled sample was analyzed in triplicate. Pooled dialysates from dorsal striatum were diluted 1:1 in borate prior to derivatization to reduce large peaks of biological origin present in the samples. The first injection used 9 μl of the diluted dialysate sample mixed with 2 μl borate and 0.5 μl of the optimal OPA working solution determined in Section 3.3. The two remaining injections substituted the 2 μl borate in the derivatization with an equal volume of GABA standard made in borate. GABA concentration used in standard additions varied based on brain region (dorsal striatum: 25, 50 nM; VTA: 10, 25 nM). Basal values are not corrected for probe recovery.
2.6. Statistics
GABA signals in optimization experiments were analyzed using analysis of variance (ANOVA) or t-tests. Basal GABA concentrations calculated using external standards and standard additions were compared using paired t-tests. Bonferroni’s post hoc comparisons were used as appropriate, and results with p<0.05 were assigned significance; ns=not significant. Data were analyzed using GraphPad Prism 6.0 software (GraphPad Software, La Jolla, CA, USA).
3. Results and discussion
3.1. Optimization of excitation and emission wavelengths
The fluorescence of thiol-substituted isoindoles has a range of reported excitation and emission wavelengths used for detection of OPA derivatives of GABA [29]. Using a 5-minute precolumn reaction time and the derivatization solution described in Section 2.3, we initially compared excitation and emission conditions similar to previous reports using OPA/MCE or MPA derivatives (λex=330 nm, λem=450 nm) [13,25] with conditions recently described to be more sensitive for OPA/MPA GABA derivatives (λex=240, λem=450 nm) [29]. We observed a significant increase in GABA signal at 240 nm for the excitation wavelength (data not shown). Following a series of manual adjustments, we performed the excitation spectrum scan between 200 and 360 nm with the emission set at 400 nm. The peak of maximal intensity was λex=220 nm, with another significantly smaller peak at 330 nm. Then, we performed the emission spectrum scan between 330 and 600 nm with the excitation set at 220 nm. The peak of maximal intensity was λem=385 nm. Scans were repeated in triplicate using derivatization solution determined in Section 3.3 to confirm results. Optimal wavelengths to achieve the highest signal for an OPA/sulfite GABA derivative were determined to be excitation λmax=220 nm and emission λmax=385 nm (Fig. 1). However, there was a more prominent artifact peak within the blank injection and preceding the GABA peak when using λem=385 nm compared to λem=400. Therefore, even though the apparent maximum signal occurred at λem=385 nm, the potential for interfering peaks limited the ability to gain more sensitivity compared to λem=400. We used λex=220 nm and λem=400 nm in order to optimize chromatography unless otherwise noted, as some initial experiments were conducted prior to optimization of wavelengths.
Fig. 1.

Maximal excitation and emission spectra for OPA/sulfite GABA derivative. The difference in signal of the GABA derivatization product and the mobile phase was calculated for each scan and data are presented as mean of three separate scans. Emission wavelength set to 400 nm for excitation scan. Excitation wavelength set to 220 nm for emission scan. λmax=wavelength at maximal signal, a.u.=arbitrary units.
3.2. Derivative stability
Using λex=220 nm and λem=400 nm for detection, the stability of the OPA/sulfite GABA derivative was tested by comparing the signal after different reaction times for the derivatization procedure up to 24 hours. The zero time point was mixed and immediately manually injected into the system, which took approximately 30 seconds. Our preliminary results found no differences in signal in a time course at points between 0 and 10 minutes (data not shown). Therefore, we compared the stability of the OPA/sulfite GABA derivative both immediately and at 10 minutes with an extended time course up to 24 hours. We found no significant differences in signal achieved between time points up to 24 hours (Fig. 2; F6,14=1.70, ns). Therefore, the GABA OPA/sulfite derivative appears to display maximal fluorescence immediately and shows no significant degradation under our conditions. This is in contrast to Rowley et al. who reported maximal GABA signal at 5 minutes and stability up to 30 minutes of an OPA/sulfite derivative using ECD [20]. The reaction was standardized to 1 minute in darkness prior to manual injection for all following experiments.
Fig. 2.

Stability of the OPA/sulfite GABA derivative up to 24 hours. Maximum fluorescence of the derivative is immediate and stable up to 24 hours. Note that symbols overlap at 0 and 10 minutes. Data are presented as mean, sem are smaller than symbol size at most time points.
3.3. Optimization of derivatization procedure
3.3.1. Effect of pH
Derivatization conditions including reagent composition and ratio of OPA to the nucleophile additive are well documented to significantly influence chromatography for other thiols reviewed in [33]. In order to determine the optimal OPA/sulfite derivatization conditions using fluorescence detection (λex=229 nm and λem=425 nm), we first examined the effect of pH of borate buffer (8.4, 9.4, 10.4) on the GABA derivative signal. For each pH tested, the borate buffer solution used in the OPA derivatization working solution was made in triplicate. There was a significant difference in GABA signal detected between pH of borate buffers tested (F2,6=471.2, p<0.001). Post hoc analyses revealed no significant differences between pH 10.4 and 9.4, however at pH 8.4 the GABA signal was significantly lower (Fig. 3; p<0.001). Therefore, for all additional experiments the pH of the borate buffer used was adjusted to 10.4.
Fig. 3.

Effects of borate buffer pH in derivatization working solution on GABA signal. A pH of 8.4 significantly reduces fluorescence of the OPA/sulfite GABA derivative (*** indicates p<0.001). Data are presented as mean ± sem.
The stock derivatization working solution was made by dissolving 11 mg OPA in 250 μl absolute ethanol, 250 μl 1 M sulfite and 4.5 ml 0.1 M borate based on procedures reported for electrochemical detection of OPA/sulfite derivatives [21]. Using this working solution, another peak following GABA sometimes interfered with quantification of GABA concentration. Adjusting the methanol concentration in the mobile phase improved separation of GABA from this unknown peak (data not shown), however relying on these adjustments alone reduced reproducibility over time due to the extreme sensitivity of GABA elution time to methanol [13]. As a result, we sought to optimize the derivatization working solution to minimize excess OPA and therefore reduce other derivative products leading to an improvement in the separation of the GABA peak.
3.3.2. Effect of OPA:sulfite ratio
We first investigated how the mole ratio of OPA to sulfite in the derivatization solution would influence chromatography. The mole ratio in the stock derivatization solution was 1 OPA to 3 sulfite (1 O: 3 S) as originally reported by Smith and Sharp [21]. We increased the amount of sulfite in the derivatization so the mole ratio was 1 OPA to 10 sulfite (1 O: 10 S; high sulfite) to test whether this modification would reduce the peak following GABA in the chromatogram (λex=229 nm and λem=425 nm). This high sulfite derivatization solution was made by dissolving 11 mg o-phthaldialdehyde (OPA) in 250 μl absolute ethanol, 820 μl 1 M sulfite and 3.93 ml 0.1 M borate. Both OPA solutions were also diluted 1:10 in borate in an effort to reduce additional peaks in the chromatogram. There was no significant difference in GABA signals observed using the various derivatization solutions (Fig. S1 in Supplementary Material; F3,8=0.80, ns) and separation of GABA from the trailing contaminant improved significantly using the high sulfite solution.
3.3.3. Effect of OPA concentration
We next investigated whether diluting the OPA working solution with borate buffer would improve chromatography (λex=229 nm and λem=425 nm). We initially compared the stock derivatization working solution with 1:10, 1:30 and 1:100 dilutions in borate and observed a significant difference in signal (F3,8=24.97, p<0.001). Post hoc comparisons showed only the 1:100 dilution resulted in a significantly lower GABA signal (Fig. 4; p<0.01). The other dilutions in borate (1:10 and 1:30) no had effect on GABA signal but did reduce additional peaks in the chromatogram. Using the high sulfite derivatization working solution shown to optimize separation in Figure S1, we tested whether further borate dilution of this solution would improve chromatography now using λex=220 nm and λem=400 nm as determined using scans. Dilutions of the high sulfite derivatization solution in borate resulted in optimal GABA separation with no reduction in signal (Fig. S2 in Supplementary Material; t(10)=0.45, ns). The improvement in chromatography with the use of the diluted, high sulfite OPA solution is illustrated in Figure 5.
Fig. 4.

Effects of diluting the original derivatization working solution in borate on GABA signal. Maximal GABA signal was maintained at 1:10 or 1:30 dilution in borate while reducing additional peaks compared to stock solution. A 1:100 dilution of the derivatization working solution in borate significantly reduced the GABA signal (** indicates p<0.01). Data are presented as mean ± sem.
Fig. 5.
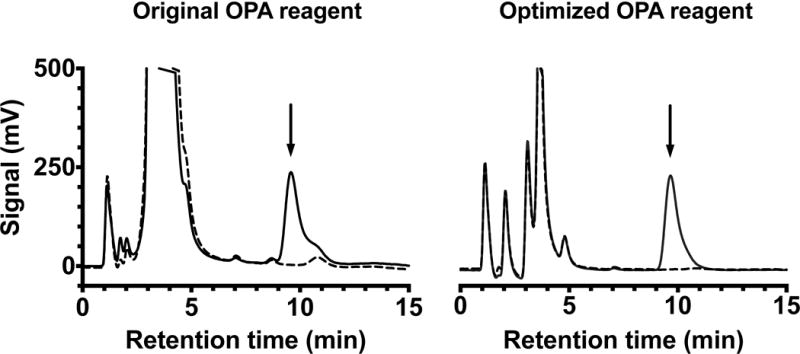
Representative chromatograms showing improved GABA peak separation by optimizing the derivatization working solution. GABA peak was not separated from surrounding peaks using original OPA reagent (left panel). Optimization of OPA reagent eliminated co-eluting peaks without reducing GABA signal (right panel). Dotted lines represent OPA blanks and solid lines represent GABA standard (500 nM) injections, arrow indicates GABA peak. Original OPA derivatization solution [mole ratio 1 OPA: 3 sulfite] (left panel) compared to high sulfite OPA derivatization solution [mole ratio 1 OPA: 10 sulfite] diluted 1:10 in borate (right panel).
Our results show the derivatization protocol determined to optimize GABA sensitivity and resolution was prepared by dissolving 11 mg OPA in 250 μl absolute ethanol, 820 μl 1 M sulfite and 3.93 ml 0.1 M borate, then diluting this OPA working solution 1:20 (v/v) in borate. This derivatization solution was used to further determine method sensitivity and quantify GABA concentration in microdialysis samples using λex=220 nm and λem=400 nm as detection wavelengths.
3.4. Effect of temperature on fluorescence
Increases in temperature can reduce fluorescence intensity [34,35], which can occur by changes in ambient room temperature or directly from equipment. We tested the sensitivity of our method with no temperature control and using the FLD to maintain temperature at 15°C. The temperature of the column compartment was 40°C for both conditions. When FLD temperature was controlled at 15°C, there was a significant increase in slope of the standard calibration curve (6.25–25 nM GABA) reflecting an improvement in the sensitivity of our method (Fig. 6; F1,20=36.26, p<0.001). We further confirmed the increase in sensitivity using standard calibration curves with low concentration GABA standards (1.5–12.5 nM). A detection limit of 1 nM was calculated from the average of triplicate calibration curves as the concentration resulting in a signal 3 times the peak-to-peak noise of the baseline from the average of triplicate OPA derivative blanks.
Fig. 6.

Effect of temperature on fluorescence of OPA/sulfite GABA derivative. Controlling the temperature of the detector at 15°C significantly increased GABA signal (*** indicates p<0.001). Data are presented as mean, sem are smaller than symbol size.
3.5. In vivo validation using standard additions
Reported basal dialysate GABA concentrations vary both between and within different brain regions. Indeed, a recent meta-analysis of rat microdialysis publications described a wide range of GABA concentrations in brain regions including the ventral tegmental area (VTA, 8–43 nM) and dorsal striatum (1–660 nM) [36]. Methodology used in the microdialysis experiments likely contributes to these differences, however chromatographic conditions are also a factor as other peaks of biological origin can interfere with accurate GABA quantification [13]. We applied our method to quantify basal extracellular GABA from microdialysis samples in the dorsal striatum and VTA of Long Evans rats. In order to examine whether other peaks were interfering with the GABA peak in dialysate samples, we used both external standards and standard additions to determine GABA concentrations. Calibration curves from standard additions to pooled dialysate samples displayed good linearity (Fig. 7; dorsal striatum R2=0.97, VTA R2=1.00). The GABA concentration in samples calculated using external standards was compared to concentration determined from standard additions (x-intercept of the regression) for each rat individually. Average GABA concentrations are shown in Table 1. There were no significant differences between basal concentrations calculated using external standards compared to standard additions for either brain region (dorsal striatum: t(3)=2.22, ns; VTA: t(2)=0.91, ns). Our results confirm additional peaks of biological origin are not present underneath the GABA peak. In addition, we further validated the identity of the GABA peak qualitatively using enzyme degradation with GABase from Pseudomonas fluorescens in both standards and dialysate samples (data not shown).
Fig. 7.

Method of standard additions using in vivo microdialysis samples from dorsal striatum (R2=0.97, n=4) and ventral tegmental area (VTA: R2=1.00, n=3) of Long Evans rats. Values not corrected for probe recovery or dilution in borate. Data are presented as mean ± sem.
Table 1.
Basal GABA concentrations in the dorsal striatum (n=4) and ventral tegmental area (VTA; n=3) of Long Evans rats calculated using external GABA standards and standard additions. Values for dorsal striatum corrected for dilution factor in borate. Basal values are not corrected for probe recovery. Data are presented as mean ± sem.
| Brain region | External standards | Standard additions |
|---|---|---|
| Dorsal striatum | 12.9 ± 2.2 nM | 14.5 ± 2.2 nM |
| VTA | 4.6 ± 1.1 nM | 5.1 ± 0.6 nM |
4. Conclusion
We have determined excitation and emission wavelengths that allow for a novel, sensitive fluorescence method to detect GABA using HPLC of an OPA/sulfite derivative. The derivatization solutions and procedure were optimized to achieve reliable GABA peak separation in brain microdialysis samples. We validated our method by quantifying dialysate GABA concentration using external standards and standard additions, further confirming no interfering peaks were present in biological samples. The described method is advantageous for various neuroscience applications that require sensitive, reliable analysis of amino acids using a simplified chromatographic system.
The limit of detection of the current method is 1 nM, which is suitable to detect low basal concentrations of GABA found in microdialysis samples. This sensitivity is within the range reported in other HPLC-FLD methods using alternative OPA derivatives [9,10,25] and slightly improved compared to HPLC-ECD of OPA/sulfite GABA derivatives [20,23]. As a result of the sensitivity reported, a temporal resolution of 5 minutes or less for microdialysis experiments is possible with the current method. In contrast to HPLC, methods using capillary electrophoresis with laser-induced fluorescence detection (CE-LIF) use significantly less sample volume (nanoliters) due to higher sensitivity but also require more specialized equipment to prevent sample loss during handling [3,37].
Previous studies indicate OPA/sulfite derivatives are stable up to 30–60 minutes at room temperature when using HPLC-ECD methods [20,21]. In contrast, the current results indicate the OPA/sulfite GABA derivative formed using an optimized OPA reagent was stable up to 24 hours at room temperature. It has been previously reported that altering the mole ratio of OPA/thiol increased the stability of both OPA/MPA and OPA/NAC GABA derivatives up to 6 hours [18]. Therefore, it is possible the adjustment in the mole ratio and borate dilution of the OPA reagent in the current method resulted in increased stability of the OPA/sulfite GABA derivative compared to published reports.
The current method is optimized for quantification of GABA with an elution time of approximately 10 minutes. The OPA reagent was optimized to improve separation of GABA, however late eluting peaks were also present in the chromatogram limiting the throughput similar to other published methods [8,12,20]. However, the use of an autosampler can significantly increase throughput and is feasible due to the stability of the derivative at room temperature. Additionally, a postanalysis flush can be utilized to wash out late eluting peaks [23].
In summary, we have described a novel isocratic HPLC method for fluorescence detection of an OPA/sulfite GABA derivative. The major advance of this method is the combination of stability and ease of using an OPA/sulfite GABA derivative with the low maintenance of an HPLC-FLD system. The sensitivity and reliable separation achieved with this method can be used to detect GABA in brain microdialysate samples without requiring extensive HPLC experience or custom-built equipment.
Supplementary Material
Highlights.
Wavelengths determined for maximum fluorescence of an OPA/sulfite GABA derivative.
Derivatization procedure optimized to achieve reliable peak resolution.
Validated using in vivo samples with both external standards and standard additions.
Simple, reliable method for high sensitivity analysis of microdialysis samples.
Acknowledgments
This work was supported by a Pre-doctoral Fellowship in Pharmaceutical Sciences from American Foundation for Pharmaceutical Education (SLZ) and by the National Institutes of Health [NIAAA AA 014874] (RAG).
Abbreviations
- ACSF
artificial cerebrospinal fluid
- ANOVA
analysis of variance
- CE-LIF
capillary electrophoresis with laser-induced fluorescence
- FLD
fluorescence detection
- GABA
γ-aminobutyric acid
- HPLC
high performance liquid chromatography
- LOD
limit of detection
- MCE
2-mercaptoethanol
- MPA
3-mercaptopropionic acid
- NAC
N-acetyl-L-cysteine
- OPA
o-phthaldialdehyde
- PEEK
polyetheretherketone
- VTA
ventral tegmental area
- λex
excitation wavelength
- λem
emission wavelength
Footnotes
Publisher's Disclaimer: This is a PDF file of an unedited manuscript that has been accepted for publication. As a service to our customers we are providing this early version of the manuscript. The manuscript will undergo copyediting, typesetting, and review of the resulting proof before it is published in its final citable form. Please note that during the production process errors may be discovered which could affect the content, and all legal disclaimers that apply to the journal pertain.
The authors declare no conflicts of interest.
References
- 1.Wong CGT, Bottiglieri T, Snead OC. GABA, gamma-hydroxybutyric acid, and neurological disease. Ann Neurol. 2003;54(Suppl 6):S3–12. doi: 10.1002/ana.10696. [DOI] [PubMed] [Google Scholar]
- 2.Chefer VI, Thompson AC, Zapata A, Shippenberg TS. Overview of brain microdialysis. Curr Protoc Neurosci. 2009;47:7.1.1–7.1.28. doi: 10.1002/0471142301.ns0701s47. [DOI] [PMC free article] [PubMed] [Google Scholar]
- 3.Shah AJ, Crespi F, Heidbreder C. Amino acid neurotransmitters: separation approaches and diagnostic value. J Chromatogr B. 2002;781:151–163. doi: 10.1016/s1570-0232(02)00621-9. [DOI] [PubMed] [Google Scholar]
- 4.Roth M. Fluorescence reaction for amino acids. Anal Chem. 1971;43:880–882. doi: 10.1021/ac60302a020. [DOI] [PubMed] [Google Scholar]
- 5.Simons SS, Johnson DF. Reaction of o-phthalaldehyde and thiols with primary amines: Fluorescence properties of 1-alkyl(and aryl)thio-2-alkylisoindoles. Anal Biochem. 1978;90:705–725. doi: 10.1016/0003-2697(78)90163-x. [DOI] [PubMed] [Google Scholar]
- 6.Lindroth P, Mopper K. High performance liquid chromatographic determination of subpicomole amounts of amino acids by precolumn fluorescence derivatization with o-phthaldialdehyde. Anal Chem. 1979;51:1667–1674. [Google Scholar]
- 7.Chen RF, Scott C, Trepman E. Fluorescence properties of o-phthaldialdehyde derivatives of amino acids. Biochim Biophys Acta. 1979;576:440–455. doi: 10.1016/0005-2795(79)90419-7. [DOI] [PubMed] [Google Scholar]
- 8.Durkin TA, Anderson GM, Cohen DJ. High-performance liquid chromatographic analysis of neurotransmitter amino acids in brain. J Chromatogr. 1988;428:9–15. doi: 10.1016/s0378-4347(00)83885-2. [DOI] [PubMed] [Google Scholar]
- 9.Piepponen TP, Skujins A. Rapid and sensitive step gradient assays of glutamate, glycine, taurine and γ-aminobutyric acid by high-performance liquid chromatography–fluorescence detection with o-phthalaldehyde–mercaptoethanol derivatization with an emphasis on microdialysis samples. J Chromatogr B Biomed Sci Appl. 2001;757:277–283. doi: 10.1016/s0378-4347(01)00156-6. [DOI] [PubMed] [Google Scholar]
- 10.Zhang S, Takeda Y, Hagioka S, Takata K, Aoe H, Nakatsuka H, Yokoyama M, Morita K. Measurement of GABA and glutamate in vivo levels with high sensitivity and frequency. Brain Res Protoc. 2005;14:61–66. doi: 10.1016/j.brainresprot.2004.03.005. [DOI] [PubMed] [Google Scholar]
- 11.Westerink BHC, de Vries JB. On the origin of extracellular GABA collected by brain microdialysis and assayed by a simplified on-line method, Naunyn. Schmiedebergs Arch Pharmacol. 1989;339:603–607. doi: 10.1007/BF00168650. [DOI] [PubMed] [Google Scholar]
- 12.Bourdelais A, Kalivas PW. High sensitivity HPLC assay for GABA in brain dialysis studies. J Neurosci Methods. 1991;39:115–121. doi: 10.1016/0165-0270(91)90077-d. [DOI] [PubMed] [Google Scholar]
- 13.Rea K, Cremers TIFH, Westerink BHC. HPLC conditions are critical for the detection of GABA by microdialysis. J Neurochem. 2005;94:672–679. doi: 10.1111/j.1471-4159.2005.03218.x. [DOI] [PubMed] [Google Scholar]
- 14.Donzanti BA, Yamamoto BK. An improved and rapid HPLC-EC method for the isocratic separation of amino acid neurotransmitters from brain tissue and microdialysis perfusates. Life Sci. 1988;43:913–922. doi: 10.1016/0024-3205(88)90267-6. [DOI] [PubMed] [Google Scholar]
- 15.Lasley SM, Greenland RD, Michaelson IA. Determination of gamma-aminobutyric and glutamic acids in rat brain by liquid chromatography with electrochemical detection. Life Sci. 1984;35:1921–1930. doi: 10.1016/0024-3205(84)90472-7. [DOI] [PubMed] [Google Scholar]
- 16.García Alvarez-Coque C, Medina Hernández MC, Villanueva Camañas MJ, Mongay Fernández RM. Formation and instability of o-phthalaldehyde derivatives of amino acids. Anal Biochem. 1989;178:1–7. doi: 10.1016/0003-2697(89)90346-1. [DOI] [PubMed] [Google Scholar]
- 17.Soto-Otero R, Méndez-Alvarez E, Galán-Valiente J, Aguilar-Veiga E, Sierra-Marcuño G. Quantitative analysis of neuroactive amino acids in brain tissue by liquid chromatography using fluorescent pre-column labelling with o-phthalaldehyde and N-acetyl-L-cysteine. Biomed Chromatogr. 1994;8:114–118. doi: 10.1002/bmc.1130080304. [DOI] [PubMed] [Google Scholar]
- 18.Mengerink Y, Kutlán D, Tóth F, Csámpai A, Molnár-Perl I. Advances in the evaluation of the stability and characteristics of the amino acid and amine derivatives obtained with the o-phthaldialdehyde/3-mercaptopropionic acid and o-phthaldialdehyde/N-acetyl-l-cysteine reagents: High-performance liquid chromatograp. J Chromatogr A. 2002;949:99–124. doi: 10.1016/s0021-9673(01)01282-1. [DOI] [PubMed] [Google Scholar]
- 19.Jacobs WA. o-Phthalaldehyde—sulfite derivaization of primary amines for liquid chromatography—electrochemistry. J Chromatogr A. 1987;392:435–441. doi: 10.1016/s0021-9673(01)94288-8. [DOI] [PubMed] [Google Scholar]
- 20.Rowley HL, Martin KF, Marsden CA. Determination of in vivo amino acid neurotransmitters by high-performance liquid chromatography with o-phthalaldehyde-sulphite derivatisation. J Neurosci Methods. 1995;57:93–99. doi: 10.1016/0165-0270(94)00132-z. [DOI] [PubMed] [Google Scholar]
- 21.Smith S, Sharp T. Measurement of GABA in rat brain microdialysates using o-phthaldialdehyde—sulphite derivatization and high-performance liquid chromatography with electrochemical detection. J Chromatogr B Biomed Sci Appl. 1994;652:228–233. doi: 10.1016/0378-4347(93)e0391-3. [DOI] [PubMed] [Google Scholar]
- 22.Bongiovanni R, Yamamoto BK, Jaskiw GE. Improved method for the measurement of large neutral amino acids in biological matrices. J Chromatogr B Biomed Sci Appl. 2001;754:369–376. doi: 10.1016/s0378-4347(00)00629-0. [DOI] [PubMed] [Google Scholar]
- 23.Reinhoud NJ, Brouwer HJ, van Heerwaarden LM, Korte-Bouws GAH. Analysis of glutamate, GABA, noradrenaline, dopamine, serotonin, and metabolites using microbore UHPLC with electrochemical detection. ACS Chem Neurosci. 2013;4:888–894. doi: 10.1021/cn400044s. [DOI] [PMC free article] [PubMed] [Google Scholar]
- 24.Kehr J. Fluorescence detection of amino acids derivatized with o-phthalaldehyde (OPA) based reagents. CMA/Microdialysis AB; Stockholm, Sweden: 1993. http://www.microdialysis.se/Fluorescence_detection_of_Amino_385_Acids.pdf?cms_fileid=e71472155b1737f5c964fee675821981. [Google Scholar]
- 25.de Freitas Silva DM, Ferraz VP, Ribeiro AM. Improved high-performance liquid chromatographic method for GABA and glutamate determination in regions of the rodent brain. J Neurosci Methods. 2009;177:289–293. doi: 10.1016/j.jneumeth.2008.10.011. [DOI] [PubMed] [Google Scholar]
- 26.Kehr J. Determination of γ-aminobutyric acid in microdialysis samples by microbore column liquid chromatography and fluorescence detection. J Chromatogr B Biomed Sci Appl. 1998;708:49–54. doi: 10.1016/s0378-4347(97)00657-9. [DOI] [PubMed] [Google Scholar]
- 27.Peng XQ, Li X, Gilbert JG, Pak AC, Ashby CR, Brodie JD, Dewey SL, Gardner EL, Xi ZX. Gamma-vinyl GABA inhibits cocaine-triggered reinstatement of drug-seeking behavior in rats by a non-dopaminergic mechanism. Drug Alcohol Depend. 2008;97:216–225. doi: 10.1016/j.drugalcdep.2007.10.004. [DOI] [PMC free article] [PubMed] [Google Scholar]
- 28.Vihavainen T, Relander TR, Leiviskä R, Airavaara M, Tuominen RK, Ahtee L, Piepponen TP. Chronic nicotine modifies the effects of morphine on extracellular striatal dopamine and ventral tegmental GABA. J Neurochem. 2008;107:844–854. doi: 10.1111/j.1471-4159.2008.05676.x. [DOI] [PubMed] [Google Scholar]
- 29.Perucho J, Gonzalo-Gobernado R, Bazan E, Casarejos MJ, Jiménez-Escrig A, Asensio MJ, Herranz AS. Optimal excitation and emission wavelengths to analyze amino acids and optimize neurotransmitters quantification using precolumn OPA-derivatization by HPLC. Amino Acids. 2015;47:963–973. doi: 10.1007/s00726-015-1925-1. [DOI] [PMC free article] [PubMed] [Google Scholar]
- 30.Boyd BW, Kennedy RT. Determination of trace level gamma-aminobutyric acid using an improved OPA pre-column derivatization and on-column preconcentration capillary liquid chromatography with electrochemical detection. Analyst. 1998;123:2119–2124. doi: 10.1039/a804442b. [DOI] [PubMed] [Google Scholar]
- 31.Doyon WM, Anders SK, Ramachandra VS, Czachowski CL, Gonzales RA. Effect of operant self-administration of 10% ethanol plus 10% sucrose on dopamine and ethanol concentrations in the nucleus accumbens. J Neurochem. 2005;93:1469–1481. doi: 10.1111/j.1471-4159.2005.03137.x. [DOI] [PubMed] [Google Scholar]
- 32.Pettit HO, Justice JB. Effect of dose on cocaine self-administration behavior and dopamine levels in the nucleus accumbens. Brain Res. 1991;539:94–102. doi: 10.1016/0006-8993(91)90690-w. [DOI] [PubMed] [Google Scholar]
- 33.Molnár-Perl I, Bozor I. Comparison of the stability and UV and fluorescence characteristics of the o-phthaldialdehyde/3-mercaptopropionic acid and o-phthaldialdehyde/N-acetyl-l-cysteine reagents and those of their amino acid derivatives. J Chromatogr A. 1998;798:37–46. [Google Scholar]
- 34.Bowen E, West K. Solvent quenching of the fluorescence of anthracene. J Chem Soc. 1955:4394–4395. [Google Scholar]
- 35.Suzuki S, Fujii T, Imai A, Akahori H. The fluorescent level inversion of dual fluorescences and the motional relaxation of excited state molecules in solutions. J Phys Chem. 1977;81:1592–1598. [Google Scholar]
- 36.Fliegel S, Brand I, Spanagel R, Noori HR. Ethanol-induced alterations of amino acids measured by in vivo microdialysis in rats: a meta-analysis. Silico Pharmacol. 2013;1:7. doi: 10.1186/2193-9616-1-7. [DOI] [PMC free article] [PubMed] [Google Scholar]
- 37.Parrot S, Sauvinet V, Riban V, Depaulis A, Renaud B, Denoroy L. High temporal resolution for in vivo monitoring of neurotransmitters in awake epileptic rats using brain microdialysis and capillary electrophoresis with laser-induced fluorescence detection. J Neurosci Methods. 2004;140:29–38. doi: 10.1016/j.jneumeth.2004.03.025. [DOI] [PubMed] [Google Scholar]
Associated Data
This section collects any data citations, data availability statements, or supplementary materials included in this article.