

Abstract
Aim
To estimate transitions between periods in and out of treatment, incarceration, and legal supervision, for prescription opioid (PO) and heroin users.
Methods
We captured all individuals admitted for the first time to publicly-funded treatment for opioid use disorder (OUD) in California (2006–2010) with linked mortality and criminal justice data. We used Cox proportional-hazards and competing risks models to assess the effect of primary PO use (vs. heroin) on the hazard of transitioning among 5 states: (1) opioid detoxification treatment; (2) Opioid agonist treatment (OAT); (3) legal supervision (probation or parole); (4) incarceration (jail or prison); and (5) out-of-treatment. Transitions were conditional on survival, and death was modeled as an absorbing state.
Results
Both primary PO (n=11,733) and heroin users (n=19,926) spent the majority of the median 2.3 years of observation out of treatment. Primary PO users were significantly younger (median age 30vs.34), a higher percentage were female (43.1% vs. 31.5%; p<0.001), white (74.6%vs.63.1%;p<0.001), and had completed high school (31.8% vs. 18.9%; p<0.001). When compared to primary heroin users, PO users had a higher hazard of transitioning from detoxification to OAT (Hazard Ratio (HR):1.65; 95% confidence interval:1.54, 1.77), and had a lower hazard of transitioning from out-of-treatment to either detoxification (0.75 [0.70, 0.81]) or OAT (0.90 [0.85, 0.96]).
Conclusion
Our findings can be applied directly in state transition modeling to improve the validity of health economic evaluations. Although PO users tended to remain in treatment for longer durations than heroin users, they also tended to remain out of treatment longer after transitioning to an out-of-treatment state. Despite the proven effectiveness of time-unlimited treatment, individuals with OUD spend most of their time out of treatment.
Keywords: State transitions, prescription opioids, heroin, opioid use disorder treatment, criminal justice, subdistribution hazard model
INTRODUCTION
Opioid use disorder (OUD) is a chronic, recurrent disorder characterized by frequent relapse1,2 and high rates of mortality, morbidity, criminal activity, and other adverse health and social consequences.2–4 Treatment for OUD is a critical factor that can reduce mortality risk,4,5 decrease crime-related costs6 and activity,7,8 control infectious disease,9,10 and improve mental health and health-related quality of life.11–13 The chronic and relapsing nature of OUD is typically characterized by cyclical episodes of treatment, relapse and interactions with the criminal justice system.2,14,15
Of the estimated 2.5 million Americans who met the diagnostic criteria for opioid use disorder (OUD) in 2015, approximately 1.9 million used prescription opioids (PO).16 An increased use of PO over the last two decades has resulted in a drug overdose epidemic,17 with drug overdoses becoming the leading cause of injury death in the United States in 2009.18 While California had the highest prevalence of self-reported substance use disorders in 2012 and had an estimated 822,000 individuals reporting needing but not receiving treatment,19 annual admissions for publicly-funded OUD treatment actually declined from 45,592 in 2001 to 21,278 in 2011. Conversely, the proportion of primary PO users presenting for publicly-funded OUD treatment in California increased during the same period from 3.1% to 25.0%.20 Emerging evidence indicates that compared to heroin users, fewer PO users ever receive treatment21,22; yet once in treatment for OUD, PO users have greater detoxification success rates and longer opioid agonist treatment (OAT) durations.20
Increases in mortality, morbidity and detrimental social consequences associated with the proliferation of PO use and more recent evidence of individuals transitioning from PO use to heroin use23–26 have led to calls to improve access to treatment.27–31 Nevertheless, it remains unclear how PO users differ in patterns of treatment use compared to heroin users with OUD. A more refined understanding of the longitudinal patterns of OUD afforded by emerging statistical methods32 can help inform both policy and clinical practice for chronic opioid users. This issue is of particular salience given the changing U.S. policy landscape under the Affordable Care Act, which is expected to bring more individuals with substance use disorders into primary healthcare settings.33
International guidelines and evidence-based standards for the conduct of health economic evaluation34,35 require estimating costs and health outcomes over an extended duration to reflect continued availability and long-term or recurrent access to treatment for substance use disorders.13,36,37 State-transition models are widely used in health economic evaluations to conceptualize such decision problems on the basis of the health states describing the course of a disease.38 A key input for substance use disorders models is empirical knowledge of the timing of individuals’ interactions with the healthcare and criminal justice systems, which can serve as a means of characterizing the disease course as movements between ‘health states’ over time.38,39 Statistical models that can chart the sequence of these events over the life course may be most appropriate for characterizing OUD longitudinally.40 However, models such as regression-based subdistribution hazards models or multistate Markov models, which can adequately account for the competing risks of these different events, have been rarely applied.4
We undertook this study to estimate transitions between periods in and out of treatment, incarceration, and legal supervision, differentiating between primary users of heroin and PO. Our secondary objectives were to determine the differential effects of polydrug use on these treatment transition patterns, as well as to parameterize time-dependent transition probabilities to inform state transition models designed to support health economic evaluation. We hypothesized primary heroin users would spend more time out of treatment compared to primary PO users, consistent with prior findings.20 To fulfill our objectives, we used linked administrative data for the state of California with detailed information on interactions with the drug treatment and criminal justice systems.
METHODS
Sample
We considered data for a retrospective cohort of individuals admitted for the first time to publicly-funded OUD treatment, including OAT and detoxification in California from January 1, 2006 to December 31, 2010. Statewide administrative databases were linked using individuals’ Social Security Number, full name, birth date, and sex. Databases included the California Outcomes Monitoring System (CalOMS), Automated Criminal History System (ACHS), Offender Based Information System (OBIS), and National Death Index (NDI).
Individual-level treatment records were drawn from CalOMS, to which each publicly-funded opioid treatment program licensed to dispense methadone is required to submit data monthly.41 CalOMS contains both self-reported data on alcohol and drug problems, educational attainment and employment status as well as clinical information entered by treatment provider staff at treatment entry and discharge. OAT is a time-unlimited form of treatment while mandated 21-day detoxification episodes usually involve methadone (or naltrexone) to rid the body of opioids while decreasing withdrawal-related discomfort.42 Discharge records are filed by treatment provider staff: (i) upon treatment completion; (ii) or when appointments are missed without notification for ≥3 consecutive days for detoxification and for ≥14 days for OAT with methadone.
Criminal records including arrests, convictions, probation and jail sentences were obtained from ACHS, which is maintained by the California Department of Justice (DOJ). The DOJ matching procedure has been shown to be the most sophisticated and complete data source for identifying a particular person’s criminal justice record, resulting in a low under-linkage probability.43 Prison incarceration and parole movement records were obtained from OBIS, maintained by the California Department of Corrections and Rehabilitation (CDCR), where each individual has a unique identifier used to connect multiple records. Vital statistics data was obtained from the NDI, maintained by the Centers for Disease Control and Prevention (CDC), which contains records of all deaths occurring nationwide and probabilistic data linkage was performed by CDC staff44 Mortality outcomes, treatment utilization and outcomes as well as the costs of crime associated with treatment engagement within the specified cohort have been described elsewhere and include further data collection details.5,20,45,46
We note the percentage of individuals receiving OAT or opioid detoxification with buprenorphine in opioid treatment programs in California ranged from 0.6% to 4.1% over the study period.47 Thus in publicly-funded treatment facilities, OAT and detoxification predominantly entailed offering methadone to treated individuals.
Protocols were approved by the Institutional Review Boards at UCLA and the State of California.
Constructing individual histories
Data from CalOMS, NDI, ACHS, and OBIS were linked to construct longitudinal histories covering the time period between first treatment admission up to December 31, 2010 for all individuals included in the analytic sample. All episodes were first arranged in an ascending order by CalOMS admission dates for treatment, ACHS commitment dates to prison or jail, and OBIS admission dates for prison or parole. When the CalOMS discharge date of the earlier episode t was missing, the imputation depended on the subsequent episode t+1 and was done according to previously-established methods.20 When the successive episodes were both treatment episodes within the 3- and 14-day discontinuation thresholds for detoxification and OAT, respectively, they were merged to a single treatment episode, or the discharge date could be imputed by the OBIS admission to prison or ACHS commitment to jail date of the subsequent episode t+1.
When the CalOMS discharge date was not missing but the treatment episode overlapped with a parole or probation episode, treatment took precedence and the episode was coded as a treatment period up to the treatment discharge date. Jail days and probation terms were imputed from ACHS sentenced time. Based on previous work that obtained each county’s best estimate of percent of time served and estimated average time served,48 we assumed 50% of time served for felony offenses, and 25% of time served for misdemeanors. When the terms of the sentence were missing, we used median time expected to be served, which was conditional on the offense category.49 For individuals convicted to a prison term, the time between conviction and entry into prison was coded as time in jail. Otherwise, for individuals not convicted, we assumed no time spent in jail given that data from Los Angeles County Jails indicates that over half of arrestees booked on a new offense were released on the same day.50
Furthermore, when a prison episode overlapped with a treatment episode, the prison episode took precedence. When there was no overlap, the gaps between successive episodes were coded as out-of-treatment episodes. Final episodes were supplemented by mortality information to determine whether and when death occurred, and all episodes ongoing after December 31, 2012 were considered censored. While some misclassification is inherent in using administrative databases for research, we implemented a number of decision rules and used previously-implemented algorithms to minimize linkage and data management errors.5,20 A hypothetical episodic time frame derived from our data is shown in Figure 1.
Figure 1.
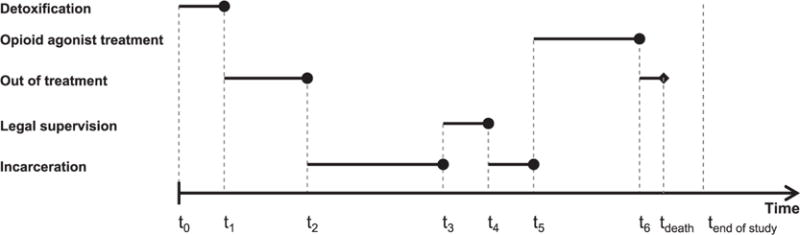
Episodic database organization. The timeline presented represents a hypothetical individuals’ transition between states of treatment, incarceration, legal supervision, and out-of-treatment, constructed from the linked databases used in our study. Legal supervision includes probation and parole, while incarceration includes sentences in county jail or state prison. Time t0 represents individuals’ initiation of treatment for opioid use disorders in California’s public drug treatment system.
Measures
The dependent variable was the duration of each of five mutually exclusive states, defined as consecutive days of (1) detoxification; (2) OAT; (3) legal supervision (probation or parole); (4) incarceration (jail or prison); and (5) out-of-treatment (not in treatment and neither incarcerated nor under legal supervision). Durations were conditional on survival, and death was modeled as an absorbing state.
The primary independent variable was individuals’ self-reported primary drug problem as recorded in CalOMS at treatment entry, coded into a dichotomous variable: PO users, defined as those reporting their primary drug problem consisting of either oxycodone/OxyContin or other opiates or synthetics or non-prescribed methadone, and heroin users, defined as those reporting heroin as their primary drug problem. Because the course of OUD may vary according to polydrug use,15,21 a secondary independent variable of interest was self-reported secondary drug problem as recorded in CalOMS for a single substance, coded into 4 mutually exclusive categories: (1) opioids other than the primary drug problem reported (heroin or PO), (2) alcohol or marijuana (combined category necessary for adequate power), (3) stimulants (methamphetamine or cocaine), and (4) no secondary drug problem.
We also considered fixed covariates known to impact treatment outcomes (e.g., age at first treatment admission as a continuous variable, gender, ethnicity) that were drawn from the first treatment admission. Lastly, as Federal regulations governing opioid treatment programs impose very strict requirement for participation in OAT,51 and in order to proxy for relative individual stability required for daily participation in these programs, we used binary time-varying indicators reflecting whether the previous episode was either a detoxification or OAT episode, or whether the previous episode lasted ≥365 days.
Statistical analysis
Our analysis was executed in five steps. First, the demographic characteristics of PO and heroin users were compared using the chi-square test for categorical variables and the Wilcoxon rank sum test for continuous variables, respectively. Second, the episodes of each state were classified by their order during the study period (e.g., 1st OAT episode, 2nd OAT episode, etc.). The duration of each state for each episode was summarized. Non-parametric estimates of the cumulative incidence functions for the transition of each state to each of the other four states and death were plotted for the 1st and 2nd episodes, using the cmprsk package in R.52 The cumulative incidence function (CIF) extends the Kaplan-Meier estimator and quantifies the cumulative probability of state-specific transition accounting for the competing risks of transitions to other states, without assumptions about the dependence among the states. The non-parametric CIF estimator is a step function defined as
where dij is the number of transitions to state j at time t(i), ni is the total number of observations in the current state at time t(i), and Ŝ(t(i)) is the standard Kaplan-Meier estimator of survival to time t(i). The CIF intuitively provides a graphical representation of the probability of transition of a given state to each of the other four states or death.
Third, we assessed univariate relationships among covariates and study outcomes using several methods. Mantel-Haenszel tests were conducted for the independent variables considered in our analysis and Kaplan-Meier curves were plotted with respect to the independent variables. The assumption of proportionality for each of the study variables was then assessed by visual inspection of Schoenfeld residual plots and weighted residuals score tests.53 When the null hypothesis of proportionality was rejected, the variable was included if the variation in , the estimated coefficient for the variable as a function of time, was not large in comparison with , the parameter estimate, and the variable did not have a circular relation with the outcome.54 All-cause Cox proportional hazards (CPH) models were fitted to estimate durations for the first episode of each of the five states.
Fourth, proportional subdistribution hazards models were similarly fitted for the first episode of each of the five states to account for the potentially differential impact of competing risks of transitioning to each of the four other states or death.55 In similar form to the CPH model for convenient representation, the subdistribution hazards model can be written as
where is the baseline sub-hazard for state j. The subdistribution hazard is directly regressed on cumulative incidence functions as
where denotes the CIF of state j, and the sum of the CIF of each state is treated as a complement of the all-cause survival function, allowing for the calculation of the underlying hazard. This approach allowed us to directly assess the effect of covariates on the CIF of a particular type of event in a competing risks setting. We further note the distinction between all-cause and subdistribution hazards. For the latter, the outcome is represented as a bivariate pair (duration, censorship); however, the censoring variable becomes a multinomial variable to accommodate hazards for ≥2 types of events, transitioning to one of the other four health states or death in our case. This is in contrast to all-cause hazards models, which use the standard outcome specification, treating competing risks as censored observations, and thus removing them from the risk set. Lau et al.32 provide a thorough discussion on competing risks models and their interpretations. For both models, the differential effects of primary PO and heroin use across different states were of primary interest, after controlling for several other covariates. Fifth, stratified analyses for primary PO and heroin users were conducted to account for differential effects of reporting a secondary drug problem.
Finally, we estimated all-cause Weibull regression survival-time models for the first episode of each of the five states to derive shape and scale parameters of the Weibull distribution, necessary to derive time-dependent probabilities of transitioning out of each state.56 For each model specification, we ran likelihood ratio tests to determine whether a Weibull distribution provided a statistically significantly better fit than exponential distribution. As an exponential distribution is simply a Weibull distribution with shape parameter γ=1, which would indicate constant transition probabilities, a likelihood ratio test was appropriate in this instance.
Statistical analyses were executed using SAS version 9.3, R version 3.1.1 and Stata version 13.1.
RESULTS
The patient population in our analytic sample included 31,659 uniquely identifiable individuals (Figure 2); 11,733 (37.1%) of which reported PO as their primary drug of use, and 19,926 (62.9%) reported heroin. Primary PO users differed significantly from those reporting primary heroin use, as they were younger at the point of initiation of drug treatment (median age 30 vs. 34), a higher percentage were female (43.1% vs. 31.5%), white (74.6% vs. 63.1%), had attained a high school degree or equivalent (31.8% vs. 18.9%), and more were employed at least part-time (36.5% vs. 26.9%) (Table 1). Additionally, fewer primary PO users were under legal supervision at the time of first treatment admission (10.4% vs. 16.4%) or had criminal justice involvement during the study period (13.7% vs. 22.9%). Secondary use of heroin amongst primary PO users was lower than secondary use of PO amongst heroin users (5.4% vs. 11.5%), and heroin users were more likely to cite secondary use of stimulants (20.0% vs. 6.9%).
Figure 2.

Study flow chart. aTreatment naïve individuals first admitted to publicly-funded OUD treatment from January 1, 2006 to December 31, 2010. b5.4% of jail convictions had missing sentences and were imputed using median time expected to be served, conditional on the offense category.
Table 1.
Patient Characteristics at First Treatment Admission, by Primary Drug Problem Type
| Primary PO Users (n=11,733) |
Primary Heroin Users (n=19,926) |
Total (N=31,659) |
|
|---|---|---|---|
| Female* | 43.1 | 31.5 | 35.8 |
| Age at first treatment admission, median (IQR)* | 30 (24, 42) | 34 (25, 46) | 32 (25, 45) |
| Race/ethnicity* | |||
| White | 74.6 | 63.1 | 67.3 |
| Hispanic | 11.9 | 21.7 | 18.0 |
| Black | 5.5 | 9.1 | 7.8 |
| Other | 8.0 | 6.2 | 6.9 |
| Less than High school education* | 68.2 | 81.1 | 76.3 |
| Employed (full time or part time)* | 36.5 | 26.9 | 30.5 |
| Legal supervisiona * | 10.4 | 16.4 | 14.2 |
| Self-referred to treatment* | 85.1 | 87.9 | 86.9 |
| Age first used primary drug, y, median (IQR)* | 21 (17, 29) | 19 (17, 24) | 20 (17, 26) |
| Years since first use of primary drug, median (IQR)* | 6 (3,12) | 10 (4, 24) | 8 (3, 20) |
| Daily use of primary drug use * | 74.5 | 79.9 | 77.9 |
| Secondary drug problem type* | |||
| None reported | 54.8 | 56.1 | 56.7 |
| Stimulantsb | 6.9 | 20.0 | 15.1 |
| Alcohol | 4.8 | 4.6 | 4.6 |
| Marijuana | 7.5 | 6.0 | 6.6 |
| Heroin | 5.4 | 0.0 | 2.0 |
| Other opiatesc | 20.7 | 11.5 | 14.9 |
All data are provided as percentages unless otherwise indicated (*P <0.001).
Includes probation and parole.
Includes methamphetamine, crack cocaine, and powder cocaine.
Includes oxycodone/OxyContin, other opiates or synthetics, and non-prescribed methadone. Also includes prescription opioids (PO) users reporting use of more than one category of other opiates. IQR, interquartile range.
Of the 106,505 total episodes, most were categorized as out-of-treatment (n=38,352 episodes; 36.0%), followed by OAT (n=26,998; 25.4%), and detoxification (n=24,303; 22.8%), and fewer were legal supervision (n=8,449; 7.9%) and incarceration (n=8,403; 7.9%) (Table 2). Otherwise, with each subsequent episode, the median duration of time out-of-treatment decreased (from 263 to 179 days and then to 112 days), as did durations of OAT (176 days; 124 days; 88 days), while the duration of detoxification episodes – by design given California’s mandated 21-day duration – remained relatively constant (19 days; 20 days; 18 days). Lastly, the median duration of incarceration episodes increased with each subsequent episode (31 days; 33 days; 45 days), consistent with longer sentences given repeated drug-related convictions.57
Table 2.
Summary Statistics on Duration of Health State Episodes (N=106,505)
| No. | Episode Duration, d | Administrative Censoring No. (%) | Death Censoring No. (%) | ||||
|---|---|---|---|---|---|---|---|
| Mean | Median | Q1 | Q3 | ||||
|
Opioid agonist treatment
| |||||||
| Overall | 26998 | 322 | 161 | 47 | 456 | 8980 (33.3) | 155 (0.6) |
| 1st episode | 21923 | 345 | 176 | 50 | 499 | 7378 (33.7) | 133 (0.6) |
| 2nd episode | 3763 | 241 | 124 | 39 | 326 | 1197 (31.8) | 17 (0.5) |
| ≥3rd episode | 1312 | 175 | 88 | 30 | 222 | 405 (30.9) | 5 (0.4) |
|
Detoxification | |||||||
| Overall | 24303 | 42 | 19 | 10 | 31 | 501 (2.1) | 16 (0.1) |
| 1st episode | 17973 | 44 | 19 | 10 | 34 | 379 (2.1) | 15 (0.1) |
| 2nd episode | 4002 | 41 | 20 | 11 | 31 | 82 (2.0) | 1 (0.0) |
| ≥3rd episode | 2328 | 30 | 18 | 10 | 21 | 40 (1.7) | 0 (0.0) |
|
Out of treatment | |||||||
| Overall | 38352 | 390 | 212 | 60 | 582 | 17903 (46.7) | 731 (1.9) |
| 1st episode | 24741 | 448 | 263 | 72 | 702 | 12241 (49.5) | 515 (2.1) |
| 2nd episode | 8164 | 320 | 179 | 57 | 458 | 3685 (45.1) | 155 (1.9) |
| ≥3rd episode | 5447 | 228 | 112 | 36 | 296 | 1977 (36.3) | 61 (1.1) |
|
Legal supervision | |||||||
| Overall | 8449 | 224 | 163 | 64 | 361 | 2341 (27.7) | 99 (1.2) |
| 1st episode | 5430 | 245 | 181 | 75 | 389 | 1395 (25.7) | 62 (1.1) |
| 2nd episode | 1807 | 208 | 150 | 57 | 329 | 566 (31.3) | 26 (1.4) |
| ≥3rd episode | 1212 | 156 | 102 | 45 | 220 | 380 (31.4) | 11 (0.9) |
|
Incarceration | |||||||
| Overall | 8403 | 107 | 32 | 8 | 124 | 925 (11.0) | 8 (0.1) |
| 1st episode | 5038 | 117 | 31 | 6 | 134 | 526 (10.4) | 5 (0.1) |
| 2nd episode | 1897 | 99 | 33 | 9 | 132 | 201 (10.6) | 3 (0.2) |
| ≥3rd episode | 1468 | 86 | 45 | 13 | 106 | 198 (13.5) | 0 (0.0) |
Estimates of the cumulative incidence of transitioning out of each state indicated that for OAT episodes, transitions to detoxification, incarceration, and death were equally unlikely (Figure 3, panel A). For detoxification episodes, a transition to OAT was more likely than to states other than out-of-treatment (panel B). For out-of-treatment episodes, transitioning to OAT was most likely, followed by detoxification and then incarceration (panel C). From legal supervision, transitioning to OAT was more likely than transitioning to detoxification (panel D) while transitioning from incarceration to detoxification, OAT, and death were similarly unlikely (panel E). The higher likelihood of transitioning within the criminal justice system by cycling between legal supervision and incarceration is captured for both legal supervision and incarceration (panel D & E). As transition patterns of each state were similar between the first and second episodes (results not shown), subsequent analyses were conducted on each states’ first episode.
Figure 3.

Nonparametric estimates of the cumulative incidence functions of each state’s first episode. Each panel represents the cumulative probability of transitioning out of a given state to each of the other states.
Table 3 shows estimation results from respective first episodes for each of the five states from all–cause CPH models (Model 1), which model the hazard of risks of all causes, and subdistribution hazards models (Model 2) capturing the competing risks of transitions to each of the other states. As can be expected with large data sets featuring highly dispersed time-to-event lengths, the null hypothesis of proportionality was rejected for several variables considered in our analysis;54,58 however, inspection of Schoenfeld residual plots revealed that the variation over episodes of different durations in most cases was small relative to the size of the estimated coefficient, and coefficient values were thus interpreted as average effects for the episodes assessed (results not shown).59 We describe our results by state below. Differential effects of secondary drug use presented hereafter are from the stratified analyses by primary drug of use; detailed results are presented in the supplementary material (SM). While we note that OAT and detoxification have been previously shown within this cohort to both independently reduce the hazard of all-cause and drug-related mortality compared to out-of-treatment periods, we restrict our discussion about mortality rates as these results have been described in great detail elsewhere.5
Table 3.
State Transitions* Estimated from the First Episode of Each of the Five States, with Selected Associated Factors
| Model 1a: All Causec | Model 2b: Subdistribution Models to Account for Risks of Transitioning to Each of the 4 Other Statesc | |||||
|---|---|---|---|---|---|---|
| Time to discontinuation for episodes of | HR (95% CI) | HR (95% CI) | HR (95% CI) | HR (95% CI) | HR (95% CI) | HR (95% CI) |
| Opioid agonist treatment | Model 1A | Model 2A | ||||
| OAT->Death | OAT->OOT | OAT->Detox | OAT->SUP | OAT->INC | ||
| Primary PO user (vs heroin) | 0.85 (0.82, 0.88) | 0.91 (0.62, 1.34) | 0.88 (0.85, 0.91) | 0.63 (0.44, 0.89) | 0.81 (0.66, 0.98) | 0.67 (0.51, 0.88) |
| Secondary drug (vs none): Heroin/PO | 0.96 (0.91, 1.01) | 0.64 (0.34, 1.21) | 0.95 (0.90, 0.99) | 0.96 (0.61, 1.51) | 1.25 (0.98, 1.60) | 0.91 (0.62, 1.33) |
| Alcohol/marijuana | 1.14 (1.08, 1.20) | 1.28 (0.77, 2.14) | 1.12 (1.06, 1.19) | 1.16 (0.72, 1.88) | 1.03 (0.76, 1.40) | 1.08 (0.74, 1.56) |
| Stimulants | 1.15 (1.10, 1.20) | 0.86 (0.52, 1.44) | 1.10 (1.05, 1.15) | 0.94 (0.61, 1.45) | 1.44 (1.14, 1.83) | 1.73 (1.31, 2.27) |
| Detoxification | Model 1B | Model 2B | ||||
| Detox->Death | Detox->OOT | Detox->OAT | Detox->SUP | Detox->INC | ||
| Primary PO user (vs heroin) | 0.93 (0.90, 0.97) | 0.76 (0.23, 2.51) | 0.78 (0.75, 0.80) | 1.65 (1.54, 1.77) | 0.91 (0.64, 1.30) | 0.40 (0.23, 0.70) |
| Secondary drug (vs none): Heroin/PO | 1.00 (0.96, 1.04) | 2.33 (0.64, 8.58) | 0.86 (0.82, 0.90) | 1.34 (1.23, 1.45) | 1.06 (0.66, 1.69) | 1.25 (0.69, 2.28) |
| Alcohol/marijuana | 1.08 (1.03, 1.14) | 0.90 (0.11, 7.08) | 1.10 (1.04, 1.16) | 0.83 (0.73, 0.94) | 1.14 (0.65, 1.99) | 1.04 (0.51, 2.13) |
| Stimulants | 1.08 (1.03, 1.12) | 1.77 (0.42, 7.54) | 1.03 (0.98, 1.08) | 1.00 (0.9, 1.11) | 1.72 (1.12, 2.64) | 1.17 (0.66, 2.08) |
| Out of treatment | Model 1C | Model 2C | ||||
| OOT->Death | OOT->OAT | OOT->Detox | OOT->SUP | OOT->INC | ||
| Primary PO user (vs heroin) | 0.75 (0.72, 0.78) | 1.07 (0.88, 1.30) | 0.90 (0.85, 0.96) | 0.75 (0.70, 0.81) | 0.79 (0.67, 0.92) | 0.71 (0.66, 0.77) |
| Secondary drug (vs none): Heroin/PO | 0.94 (0.89, 0.99) | 1.28 (0.99, 1.64) | 0.94 (0.86, 1.03) | 0.87 (0.79, 0.96) | 1.16 (0.93, 1.43) | 0.96 (0.86, 1.07) |
| Alcohol/marijuana | 0.97 (0.91, 1.02) | 1.04 (0.78, 1.39) | 0.84 (0.76, 0.93) | 0.96 (0.87, 1.07) | 1.23 (0.99, 1.55) | 1.17 (1.05, 1.30) |
| Stimulants | 1.06 (1.01, 1.11) | 1.09 (0.85, 1.39) | 0.84 (0.77, 0.91) | 0.93 (0.85, 1.02) | 1.46 (1.21, 1.77) | 1.50 (1.38, 1.64) |
| Legal supervision | Model 1D | Model 2D | ||||
| SUP->Death | SUP->OOT | SUP->OAT | SUP->Detox | SUP->INC | ||
| Primary PO user (vs heroin) | 0.83 (0.77, 0.90) | 0.56 (0.27, 1.15) | 1.37 (1.22, 1.53) | 0.74 (0.6, 0.92) | 0.47 (0.36, 0.62) | 0.86 (0.76, 0.97) |
| Secondary drug (vs none): Heroin/PO | 0.98 (0.88, 1.08) | 0.98 (0.40, 2.43) | 0.98 (0.84, 1.15) | 0.94 (0.72, 1.23) | 0.80 (0.57, 1.12) | 1.02 (0.87, 1.19) |
| Alcohol/marijuana | 0.92 (0.84, 1.02) | 1.34 (0.66, 2.71) | 1.12 (0.97, 1.30) | 0.74 (0.55, 1.00) | 1.01 (0.74, 1.37) | 0.95 (0.82, 1.11) |
| Stimulants | 1.06 (0.98, 1.14) | 0.95 (0.50, 1.79) | 0.94 (0.83, 1.08) | 1.09 (0.89, 1.33) | 0.98 (0.76, 1.25) | 1.11 (0.99, 1.25) |
| Incarceration | Model 1E | Model 2E | ||||
| INC->Death | INC->OOT | INC->OAT | INC->Detox | INC->SUP | ||
| Primary PO user (vs heroin) | 1.30 (1.21, 1.39) | 1.01 (0.16, 6.26) | 1.18 (0.95, 1.46) | 0.96 (0.51, 1.81) | 1.01 (0.38, 2.64) | 1.17 (1.08, 1.27) |
| Secondary drug (vs none): Heroin/PO | 1.07 (0.97, 1.18) | – | 1.01 (0.76, 1.35) | 1.07 (0.50, 2.30) | 0.92 (0.26, 3.29) | 1.05 (0.94, 1.16) |
| Alcohol/marijuana | 1.08 (0.99, 1.19) | 1.40 (0.22, 8.88) | 1.24 (0.94, 1.63) | 1.01 (0.44, 2.34) | 1.38 (0.35, 5.37) | 1.00 (0.91, 1.11) |
| Stimulants | 1.02 (0.95, 1.10) | – | 0.94 (0.73, 1.20) | 0.84 (0.43, 1.64) | 1.36 (0.50, 3.71) | 1.03 (0.96, 1.11) |
Bolded values are statistically significant at α=0.05. CI, confidence interval; detox, detoxification treatment; HR, hazard ratio; INC, incarceration; OOT, out of treatment; SUP, legal supervision.
Model 1: all-cause Cox proportional hazards.
Model 2: proportional subdistribution hazards.
Covariates included but not displayed above: gender, age at first treatment admission, race/ethnicity, and binary indicators reflecting whether the previous episode was either a detoxification or opioid agonist treatment (OAT) episode, or whether the previous episode lasted 365 days or more.
Transition from OAT
Primary PO users tended to remain in OAT for longer durations than heroin users (Model 1A: Hazard ratio 0.85; 95% confidence interval [0.82,0.88]), with the hazard of transitioning to detoxification (2A:0.63[0.44,0.89]) and incarceration (2A:0.67[0.51,0.88]) lowest. Secondary use of stimulants was associated with shorter OAT durations for both PO (1ASM:1.32[1.19,1.46]) and heroin users (1ASM:1.11[1.05,1.17]) while secondary marijuana/alcohol use was associated with shorter OAT durations for primary PO users only (1ASM:1.27[1.17,1.39]).
Transition from detoxification
Primary PO users tended to remain in detoxification for longer durations (1B:0.93[0.90,0.97]) than heroin, and had a higher hazard of transitioning from detoxification to OAT (2B:1.65[1.54,1.77]). Compared to not reporting a secondary drug use, use of other opioids was associated with delayed transition to out-of-treatment for heroin users (2BSM:0.79[0.74,0.85]), but expedited transition to OAT, for both primary PO (2BSM:1.20[1.09,1.33]) and heroin users (2BSM:1.63[1.43,1.87]). Alcohol/marijuana use was associated with higher hazard of transitioning to out-of-treatment for primary PO users (2BSM:1.20[1.10,1.31]).
Transition from out-of-treatment
Once transitioning to an out-of-treatment state, primary PO users tended to remain out-of-treatment for longer durations (1C:0.75[0.72,0.78]), with the hazard of transitioning to OAT (2C:0.90 [0.85,0.96]), detoxification (2C:0.75 [0.70,0.81]) and both criminal justice states all lower, compared to heroin users. Secondary use of stimulants was associated with higher hazard of death for primary PO users (2CSM:1.76[1.07,2.90]) and delayed transition to OAT for heroin users (2CSM:0.81[0.74,0.89]), when compared to those not reporting a secondary drug of use.
Transition from legal supervision and incarceration
The transition from legal supervision into treatment was delayed for primary PO users compared to heroin users, both for OAT (2D:0.74[0.60,0.92]) and detoxification (2D:0.47[0.36,0.62]). Further, primary PO users tended to remain under legal supervision longer (1D:0.83[0.77,0.90]), had shorter durations of incarceration (1E:1.30[1.21,1.39]) and had a higher hazard of transitioning to legal supervision (2E:1.17[1.08,1.27]) from incarceration. Secondary stimulant use was not associated with a higher hazard of transitioning from legal supervision or incarceration to any state for either primary PO or heroin users. Yet, reporting secondary use of stimulants was associated with a higher hazard of transitioning to involvement with the criminal justice system, either via legal supervision or incarceration, across OAT, detoxification and out-of-treatment for heroin users and from out-of-treatment for primary PO users.
Time-dependent transition probabilities
Likelihood ratio tests favored a Weibull distribution for all models compared to an exponential distribution, thus rejecting the null hypothesis of constant transition probabilities and indicative of the appropriateness of time-dependent probabilities to characterize transitions out of each state. All-cause Weibull regression survival-time model estimates for the shape parameter were 0< γ <1 for every state except legal supervision, for both primary PO users and primary heroin users, indicating evidence of decreasing probability of transitioning out of each of these states over time. Detailed estimation results for Weibull distribution shape and scale parameters that can be used to derive time-dependent transition probabilities to inform state transition models38,56 are presented in the supplementary material (Table A3).
DISCUSSION
Taken together, our results suggest important differences in treatment patterns and the associated consequences of OUD between primary PO users and primary heroin users. Specifically, primary PO use was associated with longer treatment engagement, including a greater likelihood of engaging in OAT following detoxification, consistent with prior findings of superior treatment outcomes when compared to primary heroin use.20 However, once primary PO users reached an out-of-treatment state, they tended to remain out of treatment longer. Finally, primary PO users were less likely to become involved with the criminal justice system compared to primary heroin users.
Our results can be applied directly in cost-effectiveness analyses (CEA) to improve the validity of resource allocation decisions as recommended by health economic evaluations.35 The important differences in transition patterns between primary PO and primary heroin users suggested by our estimates need to be considered in state transition models,38 particularly when constructing baseline models representing the natural history of treatment for OUD which can serve as comparator in CEA modeling of relative treatment effects.39 Failure to incorporate these distinctions could impact incremental cost-effectiveness ratios (ICERs), potentially altering recommendations derived from CEA. Our results further suggest that state transition probabilities not only depend on the present state (Markov assumption) but that they are also conditional on the time spent in the present state. Deriving time-dependent transition probabilities informed by our results can facilitate the development of semi-Markov models for use in CEA,56 which may be most appropriate for characterizing OUD longitudinally.13,40
Regression-based methods to handle recurrent event data with transitions to multiple states are at the forefront of statistical methodological development.60–62 Subdistribution hazards models enabled an unbiased observation of the association of covariates on the relative hazard of transition to other states; however our analyses were based strictly on transitions from initial episodes of each of the states under study. To further advance knowledge in this area, the development of new methodologies is necessary. For example, for sequential episodes of each state, advancements in competing risks frailty models may offer us a joint modeling of competing risks with consideration of the intra-individual correlation among episodes.63,64 Multistate Markov models are another option,15,65 though the high dimensionality of the model and the relatively sparse data available in this application led to non-convergence in our study. Further statistical development in this domain has the potential to improve our understanding of the course and consequences of chronic diseases.
Our findings indicated that primary PO and primary heroin users spend most of their time in an out-of-treatment state. While drug use during these out-of-treatment periods was not observed, prior research suggests that transitions from treatment to a state of opioid abstinence are rare,15 as characterized by the substantial increases in mortality and harms immediately following treatment interruption. For instance, the standardized mortality ratio (SMR) in the two-week period following treatment discontinuation within this cohort was previously found to be 31.5 (95% confidence interval: 26.2, 37.5) compared to 1.8 (1.6, 2.1) during treatment and 6.1 (5.7, 6.5) during all out-of-treatment periods.5 If reached, episodes of abstinence tend to be short-lived, with frequent relapse.21,66,67 That individuals with OUD incurred relatively little exposure to treatment over the duration of follow-up underscores the critical need to enhance OUD treatment access by removing access barriers to OAT,68 closing the gap between treatment need and capacity,30 exploring the feasibility of interim strategies during waitlist delays,69 and developing more effective treatment-engagement strategies. A recent U.S. Presidential Memorandum calls for all agencies providing health care services to develop an immediate action plan to increase access to OAT, testifying to the urgent need to review current practices.31
Of further note given our findings that suggest more successful treatment engagement for primary PO users20 (vs. primary heroin users) is that they were less likely to re-engage in either detoxification or OAT once out-of-treatment. This finding might suggest the need for a differential treatment approach for primary PO users but does not necessarily indicate less consequential out-of-treatment outcomes, as it has been suggested elsewhere.21 As reported in studies comparing the characteristics PO users and heroin users,28,70,71 our study also revealed that primary PO users possess a different patient profile than primary heroin users. Primary PO users were younger, a higher percentage were female, white, had completed high school, and fewer self-reported for treatment or had criminal justice involvement. These differences in characteristics, as well as different longitudinal patterns of treatment and criminal justice system involvement together suggest primary PO users are less entrenched in their opioid abuse. Early intervention and treatment engagement before primary PO users transition to heroin use23,25 may be critical in limiting the proliferation of the epidemic of heroin-involved overdose deaths, which have nearly tripled since 2011.24
Finally, more erratic transitions were associated with the co-occurring use of stimulants in particular. This is consistent with our previous findings based on another longitudinal analysis of five observational cohort studies.15 More importantly, the co-occurring use of stimulants was associated with increased hazard of transitioning from out-of-treatment to incarceration, both for primary PO and primary heroin users, consistent with findings of increased criminal activity being associated with polydrug use.72,73 Individuals with substance use disorders who cycle back and forth between out-of-treatment states and incarceration incur greater economic and social costs.74,75 Our findings suggest that among opioid and stimulant polydrug users, the occurrence of arrest, incarceration, and exit from incarcerated settings represent underutilized opportunities for early intervention and treatment diversion.76–78
Our analysis had several limitations. While the proportion of primary PO users presenting for publicly-funded treatment in California over our study period (37.1%) differed from the proportion of primary PO users meeting the diagnostic criteria for OUD in the United States in 2015 (76.6%),16 it was representative of the most recent figures for the proportion of primary PO users presenting for OUD treatment across the United States (32.6% in 2013).79 Nonetheless, given the characteristics of our study population and the nature of California regulations, including criminal justice and OAT access policies, caution must be exercised in applying our findings to other settings. Second, while buprenorphine treatment is available in office-based settings in California, prior studies have suggested that those accessing office-based treatment are unlikely to have also accessed treatment at publicly-funded facilities.80 Third, although factors that have been associated with longer OAT durations including medication dosage81–83 and other treatment aspects (e.g., counseling services, quality of care variation across treatment facilities) were unobserved, our findings are indicative of state-wide average outcomes for the population under study. Fourth, linkage to health administrative databases was not possible and we did not measure effects of other forms of public support such as treatment for mental health conditions. Given California’s high rate of unmet need for treatment of substance use disorders,22 it is unlikely that the effects of individual-level forms of support not specifically targeted at OUD would change population-level conclusions from our findings. Finally, the median observation time was 2.3 years; the stability of our results over a longer timeframe thus remain the subject of further study. Nonetheless, we’ve reported on health and criminal justice system engagement from a linked database with few parallels in size and scope. We believe our results provide considerable insight into the subject matter under study.
Our findings suggest important differences in treatment patterns and the associated consequences of OUD between primary PO and primary heroin users. When compared to primary heroin use, primary PO use was associated with delayed transition to an out-of-treatment state, accelerated transition from detoxification to OAT and decreased hazard of transitioning to incarceration. Obtaining appropriate transition probabilities for health state transition models is challenging and not without its limitations. However, we believe that our results provide a significant contribution toward improving the quality of transition probabilities to be used in state transition modeling. Finally, despite the proven effectiveness of time-unlimited treatment, individuals with OUD spend most of their time in an out-of-treatment state and incur relatively little exposure to pharmacological treatment over time. This finding underscores a critical need to develop more effective and substance-specific treatment-engagement strategies for individuals with OUD.
Supplementary Material
Acknowledgments
Financial support for this study was provided by US National Institutes of Health: R01DA031727 (PI: Nosyk); R01DA032551 (PI: Nosyk); P30DA016383 (PI: Hser). The funding agreement ensured the authors’ independence in designing the study, interpreting the data, writing, and publishing the report.
Footnotes
Conflicts of interest: None.
References
- 1.McLellan AT, Lewis DC, O’Brien CP, Kleber HD. Drug dependence, a chronic medical illness: implications for treatment, insurance, and outcomes evaluation. JAMA. 2000;284(13):1689–1695. doi: 10.1001/jama.284.13.1689. [DOI] [PubMed] [Google Scholar]
- 2.Hser Y-I, Evans E, Grella C, Ling W, Anglin D. Long-term course of opioid addiction. Harv Rev Psychiatry. 2015;23(2):76–89. doi: 10.1097/HRP.0000000000000052. [DOI] [PubMed] [Google Scholar]
- 3.Darke S, Mills KL, Ross J, Teesson M. Rates and correlates of mortality amongst heroin users: findings from the Australian Treatment Outcome Study (ATOS), 2001–2009. Drug Alcohol Depend. 2011;115(3):190–195. doi: 10.1016/j.drugalcdep.2010.10.021. [DOI] [PubMed] [Google Scholar]
- 4.Degenhardt L, Bucello C, Mathers B, et al. Mortality among regular or dependent users of heroin and other opioids: a systematic review and meta-analysis of cohort studies. Addiction. 2011;106(1):32–51. doi: 10.1111/j.1360-0443.2010.03140.x. [DOI] [PubMed] [Google Scholar]
- 5.Evans E, Li L, Min J, et al. Mortality among individuals accessing pharmacological treatment for opioid dependence in California, 2006–10. Addiction. 2015;110(6):996–1005. doi: 10.1111/add.12863. [DOI] [PMC free article] [PubMed] [Google Scholar]
- 6.Krebs E, Kerr T, Montaner J, Wood E, Nosyk B. Dynamics in the costs of criminality among opioid dependent individuals. Drug Alcohol Depend. 2014;144:193–200. doi: 10.1016/j.drugalcdep.2014.09.007. [DOI] [PMC free article] [PubMed] [Google Scholar]
- 7.Marsch LA. The efficacy of methadone maintenance interventions in reducing illicit opiate use, HIV risk behavior and criminality: a meta-analysis. Addiction. 1998;93(4):515–532. doi: 10.1046/j.1360-0443.1998.9345157.x. [DOI] [PubMed] [Google Scholar]
- 8.Prendergast ML, Podus D, Chang E, Urada D. The effectiveness of drug abuse treatment: a meta-analysis of comparison group studies. Drug Alcohol Depend. 2002;67(1):53–72. doi: 10.1016/s0376-8716(02)00014-5. [DOI] [PubMed] [Google Scholar]
- 9.Woody GE, Bruce D, Korthuis PT, et al. HIV Risk Reduction With Buprenorphine–Naloxone or Methadone: Findings From a Randomized Trial. JAIDS Journal of Acquired Immune Deficiency Syndromes. 2014;66(3):288–293. doi: 10.1097/QAI.0000000000000165. [DOI] [PMC free article] [PubMed] [Google Scholar]
- 10.Metzger DS, Woody GE, McLellan AT, et al. Human immunodeficiency virus seroconversion among intravenous drug users in-and out-of-treatment: an 18-month prospective follow-up. JAIDS Journal of Acquired Immune Deficiency Syndromes. 1993;6(9):1049–1056. [PubMed] [Google Scholar]
- 11.Amato L, Davoli M, Perucci CA, Ferri M, Faggiano F, Mattick RP. An overview of systematic reviews of the effectiveness of opiate maintenance therapies: available evidence to inform clinical practice and research. J Subst Abuse Treat. 2005;28(15925266):321–329. doi: 10.1016/j.jsat.2005.02.007. [DOI] [PubMed] [Google Scholar]
- 12.Gossop M, Marsden J, Stewart D, Kidd T. The National Treatment Outcome Research Study (NTORS): 4–5 year follow-up results. Addiction. 2003;98(3):291–303. doi: 10.1046/j.1360-0443.2003.00296.x. [DOI] [PubMed] [Google Scholar]
- 13.Nosyk B, Guh DP, Bansback NJ, et al. Cost-effectiveness of diacetylmorphine versus methadone for chronic opioid dependence refractory to treatment. CMAJ. 2012;184(22410375):317–328. doi: 10.1503/cmaj.110669. [DOI] [PMC free article] [PubMed] [Google Scholar]
- 14.Hser Y. Predicting long-term stable recovery from heroin addiction: findings from a 33-year follow-up study. J Addict Dis. 2007;26(1):51–60. doi: 10.1300/J069v26n01_07. [DOI] [PubMed] [Google Scholar]
- 15.Nosyk B, Li L, Evans E, et al. Characterizing longitudinal health state transitions among heroin, cocaine, and methamphetamine users. Drug Alcohol Depend. 2014;140:69–77. doi: 10.1016/j.drugalcdep.2014.03.029. [DOI] [PMC free article] [PubMed] [Google Scholar]
- 16.Center for Behavioral Health Statistics and Quality. 2015 National Survey on Drug Use and Health: Detailed Tables. Rockville, MD: 2016. [Google Scholar]
- 17.Centers for Disease Control and Prevention. CDC Grand Rounds: Prescription Drug Overdoses — a US Epidemic. 2012 [PubMed] [Google Scholar]
- 18.US Department of Health and Human Services. Addressing prescription drug abuse in the United States: current activities and future opportunities. 2013 [Google Scholar]
- 19.Substance Abuse and Mental Health Services Administration. National Survey on Drug Use and Health, 2012 and 2013. 2013 [PubMed] [Google Scholar]
- 20.Nosyk B, Li L, Evans E, et al. Utilization and outcomes of detoxification and maintenance treatment for opioid dependence in publicly-funded facilities in California, USA: 1991–2012. Drug Alcohol Depend. 2014;143:149–157. doi: 10.1016/j.drugalcdep.2014.07.020. [DOI] [PMC free article] [PubMed] [Google Scholar]
- 21.Wu L-T, Woody GE, Yang C, Mannelli P, Blazer DG. Differences in onset and abuse/dependence episodes between prescription opioids and heroin: results from the National Epidemiologic Survey on Alcohol and Related Conditions. Substance abuse and rehabilitation. 2011;2011(2):77. doi: 10.2147/SAR.S18969. [DOI] [PMC free article] [PubMed] [Google Scholar]
- 22.Substance Abuse and Mental Health Services Administration. Results from the 2013 National Survey on Drug Use and Health: Summary of National Findings. Rockville, MD: 2014. [PubMed] [Google Scholar]
- 23.Dasgupta N, Creppage K, Austin A, Ringwalt C, Sanford C, Proescholdbell SK. Observed transition from opioid analgesic deaths toward heroin. Drug Alcohol Depend. 2014;145:238–241. doi: 10.1016/j.drugalcdep.2014.10.005. [DOI] [PubMed] [Google Scholar]
- 24.Hedegaard H, Chen L, Warner M. National Center for Health Statistics. Hyattsville, MD: CDC; 2015. Drug-poisoning deaths involving heroin: United States, 2000–2013. [PubMed] [Google Scholar]
- 25.Mars SG, Bourgois P, Karandinos G, Montero F, Ciccarone D. “Every ‘never’I ever said came true”: transitions from opioid pills to heroin injecting. International Journal of Drug Policy. 2014;25(2):257–266. doi: 10.1016/j.drugpo.2013.10.004. [DOI] [PMC free article] [PubMed] [Google Scholar]
- 26.Unick GJ, Rosenblum D, Mars S, Ciccarone D. Intertwined epidemics: national demographic trends in hospitalizations for heroin-and opioid-related overdoses, 1993–2009. PloS one. 2013;8(2):e54496. doi: 10.1371/journal.pone.0054496. [DOI] [PMC free article] [PubMed] [Google Scholar]
- 27.Han B, Compton WM, Jones CM, Cai R. Nonmedical Prescription Opioid Use and Use Disorders Among Adults Aged 18 Through 64 Years in the United States, 2003–2013. JAMA. 2015;314(14):1468–1478. doi: 10.1001/jama.2015.11859. [DOI] [PubMed] [Google Scholar]
- 28.Meyer R, Patel AM, Rattana SK, Quock TP, Mody SH. Prescription opioid abuse: a literature review of the clinical and economic burden in the United States. Population health management. 2014;17(6):372–387. doi: 10.1089/pop.2013.0098. [DOI] [PMC free article] [PubMed] [Google Scholar]
- 29.Saloner B, Karthikeyan S. Changes in Substance Abuse Treatment Use Among Individuals With Opioid Use Disorders in the United States, 2004–2013. JAMA. 2015;314(14):1515–1517. doi: 10.1001/jama.2015.10345. [DOI] [PubMed] [Google Scholar]
- 30.Jones CM, Campopiano M, Baldwin G, McCance-Katz E. National and state treatment need and capacity for opioid agonist medication-assisted treatment. American journal of public health. 2015;105(8):e55–e63. doi: 10.2105/AJPH.2015.302664. [DOI] [PMC free article] [PubMed] [Google Scholar]
- 31.The White House. Presidential Memorandum – Addressing Prescription Drug Abuse and Heroin Use. 2015 https://www.whitehouse.gov/the-press-office/2015/10/21/presidential-memorandum-addressing-prescription-drug-abuse-and-heroin. Accessed October 29, 2015.
- 32.Lau B, Cole S, Gange S. Competing risk regression models for epidemiologic data. Am J Epidemiol. 2009;170(2):244–256. doi: 10.1093/aje/kwp107. [DOI] [PMC free article] [PubMed] [Google Scholar]
- 33.Buck JA. The looming expansion and transformation of public substance abuse treatment under the Affordable Care Act. Health Affairs. 2011;30(8):1402–1410. doi: 10.1377/hlthaff.2011.0480. [DOI] [PubMed] [Google Scholar]
- 34.Sculpher M, Claxton K, Drummond M, McCabe C. Whither trial-based economic evaluation for health care decision making? Health Econ. 2006;15(7):677–687. doi: 10.1002/hec.1093. [DOI] [PubMed] [Google Scholar]
- 35.Weinstein M, O’Brien B, Hornberger J, et al. Principles of good practice for decision analytic modeling in health-care evaluation: report of the ISPOR Task Force on Good Research Practices–Modeling Studies. Value Health. 2003;6(1):9–17. doi: 10.1046/j.1524-4733.2003.00234.x. [DOI] [PubMed] [Google Scholar]
- 36.Zaric G, Barnett P, Brandeau M. HIV transmission and the cost-effectiveness of methadone maintenance. American journal of public health. 2000;90(7):1100–1111. doi: 10.2105/ajph.90.7.1100. [DOI] [PMC free article] [PubMed] [Google Scholar]
- 37.Zarkin GA, Dunlap LJ, Hicks KA, Mamo D. Benefits and costs of methadone treatment: results from a lifetime simulation model. Health Econ. 2005;14(11):1133–1150. doi: 10.1002/hec.999. [DOI] [PubMed] [Google Scholar]
- 38.Siebert U, Alagoz O, Bayoumi AM, et al. State-transition modeling: a report of the ISPOR-SMDM modeling good research practices task force-3. Value Health. 2012;15(6):812–820. doi: 10.1016/j.jval.2012.06.014. [DOI] [PubMed] [Google Scholar]
- 39.Dias S, Welton NJ, Sutton AJ, Ades A. Evidence Synthesis for Decision Making 5 The Baseline Natural History Model. Medical Decision Making. 2013;33(5):657–670. doi: 10.1177/0272989X13485155. [DOI] [PMC free article] [PubMed] [Google Scholar]
- 40.Hser Y, Anglin M, Grella C, Longshore D, Prendergast M. Drug treatment careers: a conceptual framework and existing research findings. J Subst Abuse Treat. 1997;14(6):543–558. doi: 10.1016/s0740-5472(97)00016-0. [DOI] [PubMed] [Google Scholar]
- 41.California Department of Health Care Services. California Outcome Measurement System Treatment (CalOMS TX) Data Compliance Standards. 2014 [Google Scholar]
- 42.Stephenson D. Guideline for physicians working in California opioid treatment programs. San Francisco, CA: California Society of Addiction Medicine CSAM Committee on Treatment of Opioid Dependence; 2008. pp. 1–152. [Google Scholar]
- 43.Hser Y-I, Evans E. Cross-system data linkage for treatment outcome evaluation: Lessons learned from the California Treatment Outcome Project. Evaluation and Program Planning. 2008;31(2):125–135. doi: 10.1016/j.evalprogplan.2008.02.003. [DOI] [PMC free article] [PubMed] [Google Scholar]
- 44.National Center for Health Statistics. National Death Index user’s guide. Hyattsville, MD: 2013. [Google Scholar]
- 45.Evans E, Kelleghan A, Li L, et al. Gender differences in mortality among treated opioid dependent patients. Drug Alcohol Depend. 2015;155:228–235. doi: 10.1016/j.drugalcdep.2015.07.010. [DOI] [PMC free article] [PubMed] [Google Scholar]
- 46.Krebs E, Urada D, Evans E, Huang D, Hser Y, Nosyk B. The costs of crime during and after publicly-funded treatment for opioid use disorders: a population-level study for the state of California. Addiction (2nd review) 2016 doi: 10.1111/add.13729. [DOI] [PMC free article] [PubMed] [Google Scholar]
- 47.Substance Abuse and Mental Health Services Administration. National Survey of Substance Abuse Treatment Services (N–SSATS): 2010. Data on Substance Abuse Treatment Facilities DASIS Series S–59, HHS Publication No(SMA) 2011:11–4665. [Google Scholar]
- 48.Longshore D, Urada D, Evans E, et al. Evaluation of the substance abuse and crime prevention act. University of California, Los Angeles, Integrated Substance Abuse Programs Retrieved March. 2006;27:2007. [Google Scholar]
- 49.James DJ, Statistics BoJ, Justice UDo, Programs OoJ, America USo. Profile of Jail Inmates. 2002;2004 [Google Scholar]
- 50.Center on Sentencing and Corrections. Los Angeles County Jail Overcrowding Reduction Project. New York, NY: Vera Institute of Justice; 2011. [Google Scholar]
- 51.Substance Abuse and Mental Health Services Administration. Federal Guidelines for Opioid Treatment Programs. Rockville, MD: 2015. (HHS Publication No. (SMA) EP15-FEDGUIDEOTP). [Google Scholar]
- 52.Gray B. cmprsk: Subdistribution Analysis of Competing Risks. R Package Version 2.2-2. 2011;2014 [Google Scholar]
- 53.Grambsch PM, Therneau TM. Proportional hazards tests and diagnostics based on weighted residuals. Biometrika. 1994;81(3):515–526. [Google Scholar]
- 54.Terry M. Modeling Survival Data: Extending the Cox Model (Statistics for Biology and Health) New York, NY: Springer-Verlag Publishers; 2000. Therneau, Patricia M. Grambsch. [Google Scholar]
- 55.Fine JP, Gray RJ. A proportional hazards model for the subdistribution of a competing risk. Journal of the American Statistical Association. 1999;94(446):496–509. [Google Scholar]
- 56.Briggs A, Claxton K, Sculpher M. Decision Modelling for Health Economic Evaluation. 1. London: Oxford University Press; 2006. [Google Scholar]
- 57.California Legislative Information. California Law: Control of Users of Controlled Substances. Vol Health and Safety Code. 2014 Division 10, Chapter 10, Article 11550. [Google Scholar]
- 58.Nosyk B, MacNab YC, Sun H, et al. Proportional hazards frailty models for recurrent methadone maintenance treatment. Am J Epidemiol. 2009;170(6):783–792. doi: 10.1093/aje/kwp186. [DOI] [PubMed] [Google Scholar]
- 59.Allison PD. Survival analysis using SAS: a practical guide. Sas Institute; 2010. [Google Scholar]
- 60.Beyersmann J, Allignol A, Schumacher M. Competing risks and multistate models with R. Springer Science & Business Media; 2011. [Google Scholar]
- 61.Beyersmann J, Schumacher M. Time-dependent covariates in the proportional subdistribution hazards model for competing risks. Biostatistics. 2008 doi: 10.1093/biostatistics/kxn009. [DOI] [PubMed] [Google Scholar]
- 62.Jackson CH. Multi-state models for panel data: the msm package for R. Journal of Statistical Software. 2011;38(8):1–29. [Google Scholar]
- 63.Gorfine M, Hsu L. Frailty-Based Competing Risks Model for Multivariate Survival Data. Biometrics. 2011;67(2):415–426. doi: 10.1111/j.1541-0420.2010.01470.x. [DOI] [PMC free article] [PubMed] [Google Scholar]
- 64.Zhou B, Fine J, Latouche A, Labopin M. Competing risks regression for clustered data. Biostatistics. 2011:kxr032. doi: 10.1093/biostatistics/kxr032. [DOI] [PMC free article] [PubMed] [Google Scholar]
- 65.Nosyk B, Min J, Lima VD, et al. HIV-1 disease progression during highly active antiretroviral therapy: an application using population-level data in British Columbia: 1996–2011. JAIDS Journal of Acquired Immune Deficiency Syndromes. 2013;63(5):653–659. doi: 10.1097/QAI.0b013e3182976891. [DOI] [PMC free article] [PubMed] [Google Scholar]
- 66.Nosyk B, Anglin MD, Brecht ML, Lima VD, Hser YI. Characterizing Durations of Heroin Abstinence in the California Civil Addict Program: Results From a 33-Year Observational Cohort Study. Am J Epidemiol. 2013;177(7):675–682. doi: 10.1093/aje/kws284. [DOI] [PMC free article] [PubMed] [Google Scholar]
- 67.Termorshuizen F, Krol A, Prins M, Geskus R, van den Brink W, van Ameijden EJ. Prediction of relapse to frequent heroin use and the role of methadone prescription: an analysis of the Amsterdam Cohort Study among drug users. Drug Alcohol Depend. 2005;79(2):231–240. doi: 10.1016/j.drugalcdep.2005.01.013. [DOI] [PubMed] [Google Scholar]
- 68.Nosyk B, Anglin MD, Brissette S, et al. A call for evidence-based medical treatment of opioid dependence in the United States and Canada. Health Affairs. 2013;32(8):1462–1469. doi: 10.1377/hlthaff.2012.0846. [DOI] [PMC free article] [PubMed] [Google Scholar]
- 69.Sigmon SC, Meyer AC, Hruska B, et al. Bridging waitlist delays with interim buprenorphine treatment: Initial feasibility. Addictive behaviors. 2015;51:136–142. doi: 10.1016/j.addbeh.2015.07.030. [DOI] [PMC free article] [PubMed] [Google Scholar]
- 70.Nielsen S, Hillhouse M, Mooney L, Ang A, Ling W. Buprenorphine pharmacotherapy and behavioral treatment: Comparison of outcomes among prescription opioid users, heroin users and combination users. J Subst Abuse Treat. 2015;48(1):70–76. doi: 10.1016/j.jsat.2014.06.006. [DOI] [PMC free article] [PubMed] [Google Scholar]
- 71.Subramaniam GA, Stitzer MA. Clinical characteristics of treatment-seeking prescription opioid vs. heroin-using adolescents with opioid use disorder. Drug Alcohol Depend. 2009;101(1):13–19. doi: 10.1016/j.drugalcdep.2008.10.015. [DOI] [PMC free article] [PubMed] [Google Scholar]
- 72.Best D, Sidwell C, Gossop M, Harris J, Strang J. Crime and Expenditure amongst Polydrug Misusers Seeking Treatment The Connection between Prescribed Methadone and Crack Use, and Criminal Involvement. Br J Criminol. 2001;41(1):119–126. [Google Scholar]
- 73.Stewart D, Gossop M, Marsden J, Rolfe A. Drug misuse and acquisitive crime among clients recruited to the National Treatment Outcome Research Study (NTORS) Crim Behav Ment Health. 2000;10(1):10–20. [Google Scholar]
- 74.Anglin MD, Nosyk B, Jaffe A, Urada D, Evans E. Offender Diversion Into Substance Use Disorder Treatment: The Economic Impact of California’s Proposition 36. Am J Public Health. 2013;103(6):1096–1102. doi: 10.2105/AJPH.2012.301168. [DOI] [PMC free article] [PubMed] [Google Scholar]
- 75.Ettner S, Huang D, Evans E, et al. Benefit-cost in the California treatment outcome project: does substance abuse treatment “pay for itself”? Health Serv Res. 2006;41(1):192–213. doi: 10.1111/j.1475-6773.2005.00466.x. [DOI] [PMC free article] [PubMed] [Google Scholar]
- 76.Friedmann P, Hoskinson R, Gordon M, et al. Medication-assisted treatment in criminal justice agencies affiliated with the criminal justice-drug abuse treatment studies (CJ-DATS): availability, barriers, and intentions. Subst Abus. 2012;33(1):9–18. doi: 10.1080/08897077.2011.611460. [DOI] [PMC free article] [PubMed] [Google Scholar]
- 77.Kubiak S, Arfken CL, Swartz JA, Koch AL. Treatment at the front end of the criminal justice continuum: the association between arrest and admission into specialty substance abuse treatment. Subst Abuse Treat Prev Policy. 2006;1:20. doi: 10.1186/1747-597X-1-20. [DOI] [PMC free article] [PubMed] [Google Scholar]
- 78.Rich JD, Wakeman SE, Dickman SL. Medicine and the epidemic of incarceration in the United States. The New England Journal of Medicine. 2011;364(22):2081–2083. doi: 10.1056/NEJMp1102385. [DOI] [PMC free article] [PubMed] [Google Scholar]
- 79.Center for Behavioral Health Statistics and Quality. Treatment Episode Data Set (TEDS) Rockville, MD: 2016. [Google Scholar]
- 80.Andrews CM, D’Aunno TA, Pollack HA, Friedmann PD. Adoption of evidence-based clinical innovations: the case of buprenorphine use by opioid treatment programs. Med Care Res Rev. 2013 doi: 10.1177/1077558713503188. 1077558713503188. [DOI] [PMC free article] [PubMed] [Google Scholar]
- 81.D’Aunno T, Pollack HA, Frimpong JA, Wuchiett D. Evidence-based treatment for opioid disorders: A 23-year national study of methadone dose levels. J Subst Abuse Treat. 2014;47(4):245–250. doi: 10.1016/j.jsat.2014.06.001. [DOI] [PMC free article] [PubMed] [Google Scholar]
- 82.Peles E, Schreiber S, Adelson M. Factors predicting retention in treatment: 10-Year experience of a methadone maintenance treatment (MMT) clinic in Israel. Drug Alcohol Depend. 2006;82(3):211–217. doi: 10.1016/j.drugalcdep.2005.09.004. [DOI] [PubMed] [Google Scholar]
- 83.Volkow N, Montaner J. The urgency of providing comprehensive and integrated treatment for substance abusers with HIV. Health Aff (Millwood) 2011;30(8):1411–1419. doi: 10.1377/hlthaff.2011.0663. [DOI] [PMC free article] [PubMed] [Google Scholar]
Associated Data
This section collects any data citations, data availability statements, or supplementary materials included in this article.