

Abstract
Non-invasive biomarkers for early pancreatic ductal adenocarcinoma (PDAC) diagnosis and disease risk stratification are greatly needed. We conducted a nested case-control study within the Prospective Investigation into Cancer and Nutrition (EPIC) cohort to evaluate pre-diagnostic microRNAs (miRs) as biomarkers of subsequent PDAC risk. A panel of eight miRs (miR-10a, -10b, -21-3p, -21-5p, -30c, -106b, -155, and -212) based on previous evidence from our group was evaluated in 225 microscopically confirmed PDAC cases and 225 controls matched on center, sex, fasting status, and age/date/time of blood collection. MiR levels in pre-diagnostic plasma samples were determined by quantitative RT-PCR. Logistic regression was used to model levels and PDAC risk, adjusting for covariates, and to estimate area under the receiver operating characteristic curves (AUC). Plasma miR-10b, -21-5p, -30c and -106b levels were significantly higher in cases diagnosed within 2 yr of blood collection compared to matched controls (all P-values <0.04). Based on adjusted logistic regression models, levels for six miRs (miR-10a, -10b, -21-5p, -30c, -155, and -212) overall, and for four miRs (-10a, -10b, -21-5p, and -30c) at shorter follow-up time between blood collection and diagnosis (≤5 yr, ≤2 yr), were statistically significantly associated with risk. A score based on the panel showed a linear dose-response trend with risk (P-value=0.0006). For shorter follow-up (≤5 yr), AUC for the score was 0.73, and for individual miRs ranged from 0.73 (miR-212) to 0.79 (miR-21-p).
Keywords: biomarkers, microRNAs, pancreatic cancer, cohort studies
INTRODUCTION
Pancreatic cancer is the third leading cause of cancer death in men and women combined in the U.S., and, due to late diagnosis and limited treatment options, has the worst prognosis of all cancers (1; 2). Approximately 95% of pancreatic cancers are ductal adenocarcinomas (PDAC) which have been projected to become the second leading cause of cancer death by 2030 (3). Little is understood in terms of preventable risk factors, and known risk factors including common genetic variants are inadequate for risk stratification or early diagnosis; thus, a top research priority in PDAC research has been to identify non-invasive early markers of risk.
MicroRNAs (miRs) are small non-coding RNAs consisting of 18-25 nucleotides that function through several mechanisms. In general, miRs target specific mRNAs for translational repression or degradation, and thus regulate important biological processes including cell proliferation, survival, invasion and metastasis (4–7). In comparison with the normal pancreas, numerous miRs are overexpressed in PDAC, including miR-21, -10b, -30c, -196a, -203, -155, -101b, -205, -210, -221, -222, -223, -486, -744, and -10a (5; 8–21). Both miR-10b and miR-21 are frequently up-regulated in PDAC, where the presence of high levels of each of these miRs has been associated with lower patient survival and responsiveness to gemcitabine (9; 11; 14; 19). Moreover, miR-10b enhances the pro-metastatic actions of EGF and TGF-β (5).
We selected the miRs examined in the present study because, with the exception of miR-21-3p, they are all overexpressed in PDAC and may contribute to PDAC progression and/or metastasis (5; 8–22). We chose to include miR-21-3p which originates from the opposite arm of the same pre-miR as miR-21-5p that is recognized as an oncogenic miR (OncomiR) in PDAC (10; 11), and because miR-21-3p also may have oncogenic properties (23; 24). In the present nested study of pre-diagnostic plasma samples from 225 PDAC cases and 225 matched controls from the EPIC cohort, we evaluated relative expression of a panel of eight miRs (miR-10a, miR-10b, miR-21-3p, miR-21-5p, miR-30c, miR-106b, miR-155, and miR-212) and PDAC risk, adjusting for known risk factors and potential confounders, as well as examination of risk estimates by follow-up time between blood collection and PDAC diagnosis. Importantly, miR-10b, -21-5p, -30c, -106b and -155 are expressed in pancreatic intra-epithelial neoplasia (PanIN) that are the immediate precursor lesions to PDAC (25–27).
METHODS
Population
The EPIC cohort includes a total of 521,457 participants (368,010 women and 153,447 men) recruited through 23 research centers in 10 European countries including Denmark (Aarhus, Copenhagen), France, Germany (Heidelberg, Potsdam), Greece, Italy (Florence, Turin, Varese, Naples, Ragusa), The Netherlands (Bilthoven, Utrecht), Norway, Spain (Asturias, Granada, Murcia, Navarra, Guipuzcoa), Sweden (Malmo, Umeå) and the United Kingdom (Oxford, Cambridge) (28). Most of the participants were enrolled between 1992 and 1998 between the ages of 35 and 70 years. Participants were recruited from the general population residing in the corresponding geographic areas including towns and provinces, except for the French cohort which recruited participants from a teacher’s organization health insurance program, the cohorts consisting of women attending breast cancer screening programs (Utrecht and Florence), parts of the Italian and Spanish cohorts in which participants were recruited from among blood donors, and most of the Oxford cohort which recruited mainly health-conscious participants, including vegetarians. Eligible participants gave written informed consent and completed questionnaires on diet, lifestyle, and medical history at baseline. Anthropometric characteristics were measured by interviews except in France and Norway, and for the majority of participants from EPIC-Oxford (although the accuracy of these self-reported data has been validated (29)), for whom the data were self-reported in the lifestyle questionnaires. All participants were cancer-free at the time of data collection, including biological samples obtained from approximately 80% of the cohort. Ethical review boards from the International Agency for Research on Cancer (IARC) and local centers approved the study. In addition, approval for obtaining blood samples from patients at Indiana University School of Medicine (IUSM) was granted by the local Institutional Review Board, and each participant from whom blood was collected provided written informed consent prior to sample collection.
Nested case-control study
A nested case-control study within EPIC was conducted for the analyses of miR levels and PDAC risk. Cohort follow-up started at study enrolment and continued until diagnosis, death or last completed follow-up, whichever came first. Cancer incidence in EPIC was determined through population-based registries or through active follow-up. Cases had no prior cancer history (other than non-melanoma skin cancer) and included first primary adenocarcinoma of the pancreas ICD-Oncology third edition codes C25.0-C25.3 and C25.7-C25.9 which did not include endocrine or neuroendocrine pancreatic tumors. All PDAC cases selected for this study were microscopically confirmed (based on histology of the primary tumor, metastases, cytology, or autopsy findings). Control participants were selected randomly among EPIC participants who were alive and free of cancer (except non-melanoma skin cancer) at the time of diagnosis of each index case and matched to each case based on sex, study center or country, age at blood collection (+/− 3 years), date of blood collection (+/− 3 months), time of blood collection (+/− 2 hours), fasting status (<3 hours, 3-6 hours, >6 hours after last meal), and among women, use of hormones (OC, HRT). The final sample size was 225 cases and 225 matched controls. Sweden (Malmo, Umea) did not participate in the study.
miR selection and assay methodology
EPIC plasma samples were stored in Denmark (-150°C nitrogen vapour), and at the IARC EPIC-biobank for the remaining non-Danish samples (-196°C liquid nitrogen). Total RNA was isolated from plasma samples using Trizol-LS (Life Technologies, Carlsbad, CA, USA) and Direct-zol RNA MiniPrep kit (Zymo Research). cDNA was generated using 10 ng of RNA per reaction in conjunction with miR-10a, 10b, -30c, -21-3p, -21-5p, 106b, -155, -212, or -425-5p RT primers and a miR reverse transcription kit (Life Technologies), as previously reported (22). Quantitative PCR (qPCR) was performed using miR Taqman® probes and TaqMan Fast Advanced Master Mix (22). Expression levels for candidate miRs were normalized to miR-425-5p, which was expressed at similar levels in all sample types, exhibiting <1 cycle threshold (Ct) difference across the samples (22). After normalization to miR-425-5p (ΔCt), the ΔCt values for miRs in controls were averaged and subtracted from the ΔCt values of each individual sample (ΔΔCt), and expression levels were calculated using the 2−ΔΔCt method (30).
All miR measurements were initially blinded to case-control status. To confirm assay reproducibility, samples from seven subjects (4 cases, 3 controls) were re-analyzed with similar results for all miRs. Moreover, since the same PCR instrument (ViiA7) and methodology were used our current and previous study (22), we compared plasma samples from a cohort of normal controls at IUSM with the normal values in the current study following data unblinding. In spite of differences between EPIC and IUSM with respect to the duration of sample storage, temperature (-150°C or -196°C for European samples vs -70°C for American samples), there was remarkable concordance between the two studies with respect to ΔCt values in the control samples for each miR (Supplementary Table S1).
In view of the near identical seed sequence for miR-10a and -10b, and the fact that their mature forms only differ at a single nucleotide, we next confirmed that our qPCR method readily distinguished between miR-10a and -10b (Supplementary Figure S1).
To confirm that miRNA-425-5p is a reliable internal control, following completion of the RT-qPCR assays and designation of control and PDAC cases, the mean Ct values for miRNA-425-5p in all 450 EPIC samples were compared with the corresponding miRNA mean Ct values for the 225 control subjects and the 225 individuals who were diagnosed with PDAC (Supplementary Table S2). There was remarkable uniformity in miRNA-425-5p levels across the entire study, validating its utility as an internal control miRNA.
To validate the efficiency of our RNA extraction procedure, we performed a spike-in experiment using plasma samples from three normal and three PDAC patients from the IU Simon Cancer Center Tissue and Biofluid Bank that were spiked with varying levels of cel-miRNA-39 (Supplementary Table S3). The mean threshold (Ct) values ± SEM in normal and PDAC samples were then determined for cel-miRNA-39, hsa-miRNA-425-5p, hsa-miRNA-16 or RNU6B, by RT-qPCR. This analysis confirmed the efficiency of our RNA extraction procedure and the uniformity of miRNA-425-5p levels even in plasma from non-EPIC samples. Moreover, miR-16 and RNU6B levels were fairly uniform across normal and PDAC samples.
Danish samples were subjected to a flood in 2011. Therefore, we next evaluated whether miR expression for each miR was systematically different between Danish and non-Danish samples (31). Among 146 Danish and 79 non-Danish control samples, only two miRs (miR21-3p and miR-106b) had lower median expression in Danish samples, but neither difference was statistically significant (Wilcoxon rank sum test P-values ≥0.19). In general, Danish samples showed little evidence of miR degradation in comparison to non-Danish samples. These observations are consistent with the fact that there was no evidence that water entered the vials storing the Danish samples, and that miRs are resistant to degradation under many conditions, including at least 10 cycles of freeze-thawing (32).
Statistical Methods
Data transformation
Expression levels for each miR were modelled continuously using log2-transformation to facilitate interpretation of results and improve normality of the distributions. Spearman correlation coefficients (rs) were used to assess correlations among the un-transformed miRs and covariates. A non-parametric Wilcoxon rank sum test was used to compare median untransformed miR levels by case-control status and other dichotomous variables. Non-parametric Kruskal-Wallis tests were used to compare median untransformed miR levels according to nominal variables.
Logistic regression models
Conditional logistic regression models for associations between log2-transformed miR expression level and PDAC risk [where odds ratios (OR) represent relative risk per doubling of miR expression level] were conditioned on matching variables and adjusted for age at recruitment (years), smoking intensity (never, current 1-15 cig/d, current 16-25 cig/d, current 26+ cig/d, former quit ≤10 yr, former quit 11-20 yr, former quit 20+ yr, and current users of non-cigarette tobacco products) or smoking status (never, former, current), baseline alcohol intake (g/day), education (none, primary, technical/professional, secondary, university/graduate school), BMI (kg/m2), and physical activity using the Cambridge index (inactive, moderately inactive, moderately active, and active)(33). Due to sample size constraints, conditional logistic regression models that were stratified by the follow-up time between blood collection and PDAC diagnosis were adjusted for age, smoking status, and alcohol intake only.
miR score and interactions
A miR score was created for each participant by summing each miR (except miR-21-3p which had similar expression levels between cases and controls) that was over-expressed above the 3rd quartile (75th percentile) in all 225 controls combined (range: 0-7). Participants with scores of 6-7 (the highest category) were combined due to small sample size. In exploratory analyses, two-fold interactions between each miR were evaluated by categorizing each miR as a dichotomous variable or in quartiles (using cutpoints based on the distribution in controls). Joint ORs were estimated for PDAC risk and pair-wise over-expression of miRs. Statistical significance of potential interactions was evaluated using a likelihood ratio test (LRT).
Receiver operating characteristic (ROC) curves
Predictive performance was assessed with respect to the ability of each miR and the miR score to discriminate between PDAC cases and controls using the ROC curve which evaluates the true positive rate (sensitivity) on the y-axis and the false positive rate (1-specificity) on the x-axis, with excellent accuracy defined as AUC > 0.90. Predictive performance for each miR was evaluated based on unconditional logistic regression models adjusted for matching factors, smoking status, and alcohol intake at baseline (34). Models for the miR score were additionally adjusted for BMI. To perform the ROC curve and to assess AUC, functions prediction and performance from the ROCR R package were used; to assess the 95% confidence intervals for the AUC, function ci.cvAUC implemented in the cvAUC R package was used. All statistical analyses were performed using SAS v.9.4 (Cary, NC, USA) and R v.3.2.5.
RESULTS
The median follow-up time between blood collection and PDAC diagnosis in the 225 cases was 7.85 yr (range: 10.86 yr; inter-quartile range: 4.22-9.47 yr). Correlation coefficients (rs) among the eight miRs ranged from 0.09 to 0.6 in control participants (P-values <0.0001 to 0.18) with the strongest correlation between miR-10b and miR-212, and the weakest between miR-10b and miR-106b (Supplementary Table S4). There was little evidence for correlation between miR expression levels and age at recruitment (rs range -0.037 to 0.057, P-values 0.39 to 0.95), except for miR-10b (rs 0.13, P-value 0.049). There was no evidence for correlations between the eight miRs and smoking intensity (correlation range -0.01 to 0.06, P-values 0.13 to 0.89), or BMI (correlation range -0.0003 to 0.037, P-values 0.54 to 0.99). Individual miR expression levels did not significantly differ by sex (all Wilcoxon rank-sum test P-values >0.26). Only miR-10b was weakly correlated with baseline alcohol intake (correlation coefficient 0.16, P-value 0.017), while the remaining miRs were not (correlation range -0.041 to 0.12, P-values 0.069 to 0.79). None of the miRs was significantly associated with physical activity level (Kruskal-Wallis test P-values 0.06 to 0.8), or education level (Kruskal-Wallis test P-values 0.09 to 0.7).
Comparison of expression levels for each miR between patients subsequently diagnosed with localized PDAC (n=13) vs. metastatic PDAC (n=96) did not show any significant differences (all P-values > 0.18; 116 cases had missing data on stage); however, the possibility that some patients with suspected localized PDAC already had micro-metastases cannot be excluded. Nine cases and 9 controls reported having had a history of diabetes at baseline (16 cases and 5 controls were missing data on diabetes). Median relative expression was statistically significantly lower in diabetics vs. non-diabetics for miR-155 (cases: 0.43 vs. 0.75, P-value=0.016; controls: 0.29 vs. 0.72, P-value=0.024), and miR-21-5p (controls: 1.07 vs. 1.11, P-value=0.029). Because of the low number of participants who reported a positive history of diabetes at baseline, this covariate was not included in conditional logistic regression models.
Levels for each miR were compared between cases and controls according to the follow-up time between blood collection and PDAC diagnosis in the index cases (Figure 1). For the shortest follow-up times (≤2 yr), miR-10b, miR-21-5p, miR-30c, and miR-106b were statistically significantly higher in cases than their matched controls (Figure 1 and Table 1). For longer follow-up times (>5-8 yr and >8 yr), miR-10a, miR-10b, miR-30c, and miR-106b were statistically significantly higher in cases than controls. Overall, for longer follow-up times (>8 yr), and for all 225 cases and 225 matched controls (≤12 yr), the most consistent and statistically significant differences were observed for miR-10a, miR-10b, and miR-30c (Figure 1 and Table 1). There was no evidence for longitudinal differences in miR expression levels among controls and among cases by follow-up time between blood collection and PDAC diagnosis (Kruskal-Wallis test P-values >0.6, data not in tables), except for miR-106b among cases (P-value =0.01); however, there was no clear monotonic trend between median miR-106b expression level and follow-up time, and data were relatively sparse, especially at shorter follow-up times.
Figure 1.

microRNA expression levels by case / control status, and by follow-up time between blood collection and PDAC diagnosis.
X-axis represents follow-up time between blood collection and PDAC diagnosis, and the Y-axis represents relative miRNA expression level.
Table 1.
microRNA expression levels in PDAC cases and controls according to follow-up time between blood collection and pancreatic cancer diagnosis
| Median (QR)
| |||||||||||||||
|---|---|---|---|---|---|---|---|---|---|---|---|---|---|---|---|
| microRNA |
≤2 yr Cases n=35 |
≤2 yr Controls n=35 |
P- valuea |
>2–5 yr Cases n=29 |
>2–5 yr Controls n=29 |
P- valuea |
>5–8 yr Cases n=53 |
>5–8 yr Controls n=53 |
P- valuea |
>8 yr Cases n=108 |
>8 yr Controls n=108 |
P-valuea |
≤12 yr Cases n=225 |
≤12 yr Controls n=225 |
P-valuea |
|
| |||||||||||||||
| miR-10a | 0.78 | 0.59 | 0.15 | 0.72 | 0.67 | 0.62 | 0.76 | 0.58 | 0.034 | 0.80 | 0.63 | 0.0055 | 0.79 | 0.62 | 0.0002 |
| (0.52–1.07) | (0.44–1.01) | (0.56–1.00) | (0.48–1.00) | (0.56–1.16) | (0.38–0.85) | (0.53–1.16) | (0.41-0.91) | (0.54–1.14) | (0.42–0.93) | ||||||
|
| |||||||||||||||
| miR-10b | 1.15 | 0.80 | 0.020 | 1.03 | 0.90 | 0.37 | 1.26 | 0.93 | 0.0032 | 1.26 | 0.90 | <0.0001 | 1.23 | 0.90 | <0.0001 |
| (0.74–1.71) | (0.32–1.86) | (0.77–1.76) | (0.72–1.78) | (0.86–1.87) | (0.62–1.15) | (0.90–1.78) | (0.61-1.29) | (0.85–1.76) | (0.60–1.26) | ||||||
|
| |||||||||||||||
| miR-21-3p | 0.71 | 0.89 | 0.88 | 0.77 | 0.64 | 0.17 | 0.69 | 0.68 | 0.76 | 0.76 | 0.75 | 0.40 | 0.75 | 0.72 | 0.23 |
| (0.55–1.36) | (0.51-1.24) | (0.69–0.95) | (0.44–1.01) | (0.50–0.98) | (0.49–1.01) | (0.54–1.15) | (0.50–1.05) | (0.54–1.13) | (0.49–1.05) | ||||||
|
| |||||||||||||||
| miR-21-5p | 1.42 | 1.15 | 0.044 | 1.25 | 1.08 | 0.062 | 1.21 | 1.06 | 0.11 | 1.18 | 1.17 | 0.099 | 1.25 | 1.11 | 0.0009 |
| (1.00–2.05) | (0.91-1.60) | (1.08–1.55) | (0.86–1.32) | (0.94–1.60) | (0.86–1.31) | (0.88–1.77) | (0.76–1.47) | (0.96–1.71) | (0.82–1.42) | ||||||
|
| |||||||||||||||
| miR-30c | 1.49 | 1.03 | 0.0025 | 1.10 | 0.83 | 0.14 | 1.41 | 0.85 | 0.0045 | 1.39 | 0.83 | <0.0001 | 1.38 | 0.85 | <0.0001 |
| (0.95–1.82) | (0.701.27) | (0.70–1.63) | (0.67–1.13) | (0.72–1.74) | (0.63–1.15) | (0.73–1.91) | (0.64–1.25) | (0.73–1.82) | (0.63–1.18) | ||||||
|
| |||||||||||||||
| miR-106b | 0.99 | 0.83 | 0.012 | 0.86 | 0.79 | 0.099 | 0.80 | 0.87 | 0.80 | 0.90 | 0.80 | 0.0006 | 0.83 | 0.85 | 0.28 |
| (0.72–1.28) | (0.67–1.18) | (0.73–1.26) | (0.62–0.98) | (0.68–0.93) | (0.63–1.04) | (0.69–1.23) | (0.58–0.94) | (0.69–1.09) | (0.62–1.07) | ||||||
|
| |||||||||||||||
| miR-155 | 0.63 | 0.55 | 0.52 | 0.79 | 0.68 | 0.33 | 0.75 | 0.73 | 0.23 | 0.75 | 0.70 | 0.31 | 0.74 | 0.69 | 0.068 |
| (0.39–0.93) | (0.28–1.09) | (0.65–1.05) | (0.53–0.86) | (0.51-1.09) | (0.41-0.91) | (0.42–1.09) | (0.41-0.98) | (0.45–1.05) | (0.40–0.98) | ||||||
|
| |||||||||||||||
| miR-212 | 0.58 | 0.47 | 0.62 | 0.73 | 0.53 | 0.32 | 0.93 | 0.64 | 0.22 | 0.69 | 0.70 | 0.14 | 0.71 | 0.61 | 0.031 |
| (0.33–1.05) | (0.22–1.18) | (0.49–1.33) | (0.31-1.11) | (0.53–1.31) | (0.35–1.25) | (0.37–1.47) | (0.28–1.15) | (0.39–1.38) | (0.30–1.15) | ||||||
QR, quartile range.
Wilcoxon rank-sum test on median untranformed miR expression levels (cases vs. matched controls).
Multivariable-adjusted, conditional logistic regression models for the association between relative miR expression level and PDAC risk were evaluated for various overlapping follow-up times (i.e., ≤2 yr, ≤5 yr, ≤8 yr, and ≤12 yr) between blood collection and PDAC diagnosis (Table 2). When evaluating all 225 cases and 225 matched controls (follow-up time ≤12 yr), ORs for the association between miR expression level (as continuous variables) and PDAC risk were statistically significant for six miRs (miR-10a, -10b, -21-5p, -30c, -155, and -212) (Table 2). When these associations were evaluated according to shorter follow-up times between blood collection and PDAC diagnosis (≤2 yr, ≤5 yr, ≤8 yr) ORs remained elevated for miR-10b, miR-21-5p, and miR-30c. The magnitude of ORs was somewhat stronger with shorter follow-up times for miR-21-5p, and to a lesser extent for miR-30c (Table 2).
Table 2.
Odds ratios (OR) for PDAC risk per doubling of log2-transformed microRNA expression level, by follow-up time between blood collection and PDAC diagnosis
|
Follow-up time n, Cases microRNA |
≤2 years 35 ORa (95% CI) |
≤5 years 64 ORa (95% CI) |
≤8 years 117 ORa (95%CI) |
≤12 years 225 ORa (95%CI) |
|---|---|---|---|---|
| miR-10a | 2.71 (0.96–7.63) | 1.77 (1.01-3.09) | 1.70 (1.18–2.45) | 1.80 (1.39–2.33) |
| miR-10b | 1.82 (1.03–3.23) | 1.60 (1.08–2.39) | 1.66 (1.24–2.25) | 1.86 (1.47–2.35) |
| miR-21-3p | 1.30 (0.66–2.54) | 1.31 (0.81-2.14) | 1.21 (0.86–1.69) | 1.24 (0.99–1.56) |
| miR-21-5p | 4.02 (1.14–14.1) | 3.86 (1.64–9.10) | 2.09 (1.26–3.46) | 1.43 (1.10–1.86) |
| miR-30c | 2.64 (1.11-6.27) | 2.15 (1.29–3.59) | 1.98 (1.39–2.82) | 2.06 (1.60–2.67) |
| miR-106b | 1.38 (0.38–4.99) | 1.63 (0.75–3.52) | 0.91 (0.54–1.54) | 1.33 (0.96–1.86 |
| miR-155 | 1.75 (0.80–3.80) | 1.44 (0.90–2.31) | 1.33 (0.97–1.83) | 1.27 (1.03–1.57) |
| miR-212 | 1.08 (0.72–1.62) | 1.05 (0.79–1.41) | 1.13 (0.90–1.41) | 1.18 (1.01-1.38) |
Separate conditional logistic regression models for each log2-transformed miRNA, adjusted for age, smoking status, and alcohol intake at baseline.
Adjusted associations between miR expression levels and PDAC risk were also evaluated according to the non-overlapping follow-up times that were examined in Figure 1 and Table 1 (>2-5 yr, >5-8 yr, and >8 yr). For follow-up times >2-5 yr (29 cases, 29 controls), due to small sample size, these estimates are not shown. For >5-8 yr (53 cases, 53 controls), positive associations were observed for miR-10b (1.76, 95% CI=1.05-2.96) and miR-30c (OR=2.01, 95% CI=1.11-3.62). Finally, for longer follow-up times >8 yr (108 cases, 108 controls), positive associations were observed for miR-10a (OR=2.05, 95% CI=1.36-3.10), miR-10b (OR=2.52, 95% CI=1.62-3.92), miR-30c (OR=2.35, 95% CI=1.54-3.57), and miR-106b (OR=2.61, 95% CI=1.57-4.34). Associations for follow-up ≤2 yr were statistically significant for miR-10b, miR-21-5p, and miR-30c (listed in Table 2).
Fully-adjusted conditional ORs for the association between a miR expression score and PDAC risk showed statistically significant evidence for higher risks with higher numbers of over-expressed miRs, as well as a monotonic dose-response trend (Table 3). Adjusted and un-adjusted analyses of the miR score by shorter follow-up (≤8 yr, ≤5 yr) produced risk estimates that were unstable due to sparse data (not shown).
Table 3.
Odds ratios (OR) for PDAC risk per microRNA expression score
| miR scorea | Cases n=225 |
Controls n=225 |
ORb (95%CI) |
|---|---|---|---|
| 0 | 37 | 77 | 1.0 (referent) |
| 1 | 32 | 41 | 1.31 (0.63–2.73) |
| 2 | 32 | 35 | 1.56 (0.76–3.19) |
| 3 | 52 | 35 | 3.78 (1.89–7.57) |
| 4 | 33 | 19 | 3.48 (1.51-8.02) |
| 5 | 19 | 10 | 2.60 (0.96–7.05) |
| 6–7 | 20 | 8 | 6.74 (2.32–19.5) |
| Trend test P-value | 0.0006 |
Number of miRs (miR-10a, -10b, -21-5p, -30c, -106b, -155, -212) with expression above 75th percentile in EPIC controls.
Conditional logistic regression model adjusted for age, smoking intensity, alcohol intake, education, BMI, and physical activity at baseline.
Fully-adjusted, conditional logistic regression models for each miR analyzed in quintiles and as continuous variables showed monotonic dose-response trends for miR-10a, miR-10b, miR-21-5p, and miR-30c (Supplementary Table S5). A single, mutually-adjusted, conditional logistic regression model including all 8 miRs and covariates was also evaluated, and showed higher PDAC risk with increasing over-expression of miR-10a, miR-10b, and miR-30c, but with less of a tendency for monotonic trends (Supplementary Table S5).
In exploratory analyses, we evaluated joint ORs for 2-fold (miR-miR) interactions. Although some joint effect ORs showed higher PDAC risk in individuals with two over-expressed miRs (e.g., miR-10b//miR-21-5p, and miR-10b//miR-30c) compared to individual with neither or only one over-expressed, none of the interactions showed evidence of statistical significance (all LRT P-values >0.10). Interactions at shorter follow-up times were not evaluated due to small sample sizes.
The performance of each pre-diagnostic miR (and the miR score variable) as a test for discriminating PDAC cases from controls was evaluated using the AUC which compares the true positive rate (sensitivity) on the y-axis with the false positive rate (1-specificity) on the x-axis (Figure 2). For shorter follow-up time (≤5 yr), the highest AUCs were for miR-21-5p (0.79, 95% CI=0.71-0.87) and miR-30c (0.77, 95% CI=0.66-0.76) and the lowest was for miR-212 (AUC=0.73, 95% CI=0.65-0.82). The discriminatory performance (AUC) of each miR and the score dramatically improved when we evaluated shorter follow-up (≤8 yr, ≤5 yr) between blood collection and PDAC diagnosis (Figure 2). Discriminatory performance for follow-up times ≤2 yr was also higher, but due to logistic model non-convergence (i.e., small sample size), these data are not shown.
Figure 2.
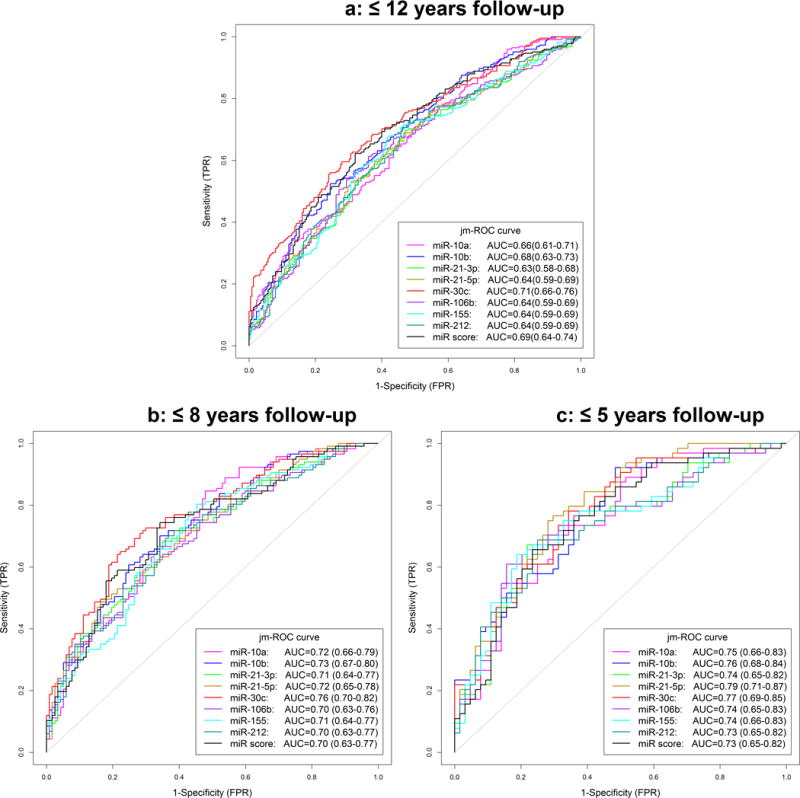
ROC curves for each microRNA and the score variable in 225 PDAC cases and 225 matched controls for different follow-up times (≤12 yr, ≤8 yr, ≤5 yr)
ROC curves for separate unconditional logistic regression models for each log2-transformed miRNA, adjusted for age, smoking status, and alcohol intake at baseline. The miR score was additionally adjusted for BMI. TPR: True positive rate; FPR: False positive rate
DISCUSSION
Our nested case-control study evaluated the relative expression of a targeted panel of eight microRNAs in plasma samples collected years before diagnosis with PDAC. In general, for longer follow-up times (which may represent tumors in earlier stages of tumorigenesis), we observed moderately strong, fully-adjusted positive associations between over-expression of miR-10a, miR-10b, miR-21-5p, miR-30c and PDAC risk. Overexpression of miR-155 and miR-212 showed weak, but statistically significant, associations with risk. For shorter follow-up times (which may represent tumors in later stages of tumorigenesis), we observed stronger associations with over-expression of miR-10b, miR-21-5p, and miR-30c (with ORs for miR-21-5p stronger in magnitude with shorter follow-up times). Consideration of a score created using seven miRs yielded suggestive evidence for a cumulative effect (monotonically increasing risk with each additional over-expressed miR). The ORs for miR expression level and PDAC risk in our study were similar (or stronger) in magnitude to ORs typically observed in epidemiologic studies of smoking and PDAC.
The three miRs that gave the most consistent evidence for an association between over-expression in plasma collected years before PDAC diagnosis and risk were: miR-21-5p, miR-30c, and miR-10b. AUCs at shorter follow-up time (≤5 yr) between blood collection and PDAC diagnosis were highest for miR-21-5p (0.79) and miR-30c (0.77). These results should be replicated in other epidemiological study settings to evaluate their potential use as biomarkers of PDAC risk. Both miR-10a and -10b have been implicated in PDAC pathobiology and along with miR-21 may contribute to PDAC’s propensity to metastasize (5; 10; 11; 14; 21). While it is not known whether miR-21-3p has a role in PDAC, this miR may contribute to cancer progression and cisplatin resistance (23; 24). Moreover, miR-30c is upregulated by the EGF receptor (35) and may contribute to PDAC progression, whereas miR-106b and miR-212 target Rb (16; 36), thereby potentially inducing loss of negative growth constraints. Finally, miR-155 is expressed in PDAC (17), but its role in this cancer remains to be delineated. Nonetheless, miR-155 has been shown to enhance cancer cell proliferation and angiogenesis, and is likely to have an important role in PDAC (37; 38).
It is well established that PDAC is a heterogeneous cancer, and recent studies suggest that there are 4 major molecular subtypes (39). However, there is no evidence that each of these different molecular subtypes is associated with a unique miRNA profile. Conversely, it is possible that the kinetics of miRNA expression occurs at different time-points in these subtypes. Moreover, while PDAC may develop and progress over 15 to 17 years prior to developing distant metastases (40), it is now appreciated that a subgroup of patients have much more rapid PDAC progression due to concurrent and rapid acquisition of mutations (41), which further complicates the delineation of specific time points for the appearance of diagnostic miRNAs in the circulation.
Importantly, a patient who underwent total pancreatectomy and islet autotransplantation (TPIAT), meaning that he received an infusion of his own islets into the venous portal system, developed hepatic metastases 10 months following the infusion that were histologically confirmed to be metastatic PDAC (25). The patient’s pancreas that had been removed 9 months earlier only had PanIN2 lesions, and pre-operative serum samples revealed elevated levels of miR-10b, -30c, and -106b in comparison with serum from four other patients with chronic pancreatitis who underwent TPIAT (25). The high levels of all three miRs normalized three days post-pancreatectomy. Together, these findings suggest that the elevated levels of these three miRs in the patient’s circulation derived from a pancreas harboring advanced PanIN lesions (25), underscoring the potential use of miR-10b, -30c, and -106b in early PDAC diagnosis. Additional studies assaying miR levels in circulating exosomes should be carried out to further explore this possibility. Inasmuch as some PDAC may progress more rapidly than previously realized (41), it is possible that some miR biomarkers, such as miR-21-5p, may only increase in the circulation a relatively short time (≤2 yr) prior to clinical presentation.
To our knowledge, this is the first published evaluation of miR expression and subsequent pancreatic cancer risk in a prospective cohort study. In previous studies, blood- and tissue-based miR expression signatures have been reported to differentiate various pancreatic lesions (precursor lesions, chronic pancreatitis, neuroendocrine tumors, and PDAC) from one another, and from normal tissue, but previous studies have been retrospective, limited in sample size, and the specific miRs evaluated and reported have not been consistent across studies [(22; 26; 27; 42–44), as previously reviewed (45–47)].
Although our analyses provide support for the hypothesis that the over-expression of miRs may help to distinguish some individuals who may be at a higher risk of eventually developing PDAC, based on area under the ROC curves, our miR biomarker results fall short of being considered “clinically useful” tests for early PDAC detection or diagnosis in the general population. As pointed out by Wentzensen and Wacholder (2013), “to achieve any meaningful risk stratification for a rare disease would require a biomarker test with very high specificity” (48). In the case of pancreatic cancer, a biomarker test that yields ORs of magnitude of approximately 100 or more would likely be needed to yield high enough specificity (>99.5%) for a test to be considered clinically useful (48; 49).
Weaknesses of our study include limited information on stage of cancer at diagnosis and diabetes at baseline, the absence of information on pancreatitis and new-onset diabetes prior to diagnosis, lack of information on CA19-9 levels, and a limited sample size. We chose a targeted approach in evaluating eight highly promising miRs as biomarkers of PDAC risk. Clearly, there may be other known or as yet undiscovered miRs that may improve risk prediction, or that may be more appropriate as markers of PDAC prognosis and/or treatment response (50). Strengths of our study design include the collection of exposure data and blood samples in a well-defined cohort many years before pancreatic cancer diagnosis.
Although our study has not yielded a clear biomarker for early PDAC diagnosis, it provides useful information with respect to PDAC risk stratification, and, therefore advances the concept that levels of circulating miRs may have the potential to be useful for diagnosing PDAC. Additional work needs to be done to find a set of biomarkers or biochemical tests that can reliably identify high-risk individuals in the general population before their tumors spread beyond the pancreas. The simultaneous consideration of multiple biomarker tests (low abundance mutations, proteins, over-expressed miRs) in biofluids (plasma, secretin-stimulated pancreatic juice, saliva, etc.) and salient clinical information (e.g., family history, smoking history, recent onset diabetes, ABO blood group, and recent use of heartburn or acid reflux medications) could be one way forward (49; 51). Our data thus advocate for the constitution of a much larger cohort together with molecular and imaging studies.
Supplementary Material
Increasing concentrations of miR-10a or miR-10b oligonucleotides (Sigma) were added (spiked in) to 100 µl of normal human plasma pre-cleared of cell debris by centrifugation at 1,000×g for 10 minutes at 4°C. RNA was isolated using Trizol LS (Life Technologies) and converted to cDNA using 10 ng RNA and the TaqMan MicroRNA Reverse Transcription Kit in conjunction with RNU6B (internal reference), miR-10a, and miR-10b TaqMan primers (Applied Biosystems). Converted cDNA was then subjected to qRT-PCR using the ViiA7 using TaqMan probes and TaqMan Fast Advanced Master Mix (Applied Biosystems). Levels for miR-10a and miR-10b were normalized to the internal reference (U6) to establish the ΔCt value, and then normalized to the ΔCt value from the control sample (without any added oligonucleotides, ΔΔCt). Expression levels were calculated using the 2−ΔΔCt method, documenting that the qRT-PCR assay readily differentiated between miR-10a and miR-10b over a wide concentration range of the respective miR.
Novelty and Impact.
In this first prospective study of microRNAs and pancreatic cancer, samples collected ≤2 yr pre-diagnosis showed elevated plasma levels of miR-10b, miR-21-5p, miR-30c, and miR-106b compared to controls. In multivariable models, levels of miR-10a, miR-10b, miR-21-5p, and miR-30c showed significant associations with subsequent risk; with stronger associations for miR-21-5p and miR-30c ≤2 or ≤5 yr pre-diagnosis. Plasma microRNAs might serve as biomarkers of pancreatic cancer risk and (with other markers) in screening high-risk populations.
Acknowledgments
Funding
This work was supported in part by a grant from the National Cancer Institute (NCI) of the National Institutes of Health under award number CA-075059 to M. Korc, and by the Indiana Economic Development Fund (IEDF) to M. Korc. The coordination of EPIC is financially supported by the European Commission (DG-SANCO) and the International Agency for Research on Cancer. The national cohorts are supported by the Health Research Fund (FIS) of the Spanish Ministry of Health, Regional Governments of Andalucía, Asturias, Basque Country, Murcia [no. 6236], Navarra and the Catalan Institute of Oncology, La Caixa [BM 06-130], Red Temática de Investigación Cooperativa en Cáncer [RD12/0036/0018; RD06/0020/0091] (Spain); Danish Cancer Society (Denmark); Ligue contre le Cancer, Institut Gustave Roussy, Mutuelle Générale de l’Education Nationale, Institut National de la Santé et de la Recherche Médicale (INSERM) (France); Deutsche Krebshilfe, Deutsches Krebsforschungszentrum (DKFZ) and Federal Ministry of Education and Research (Germany); the Hellenic Health Foundation (Greece); Associazione Italiana per la Ricerca sul Cancro (AIRC) and National Research Council (Italy); Dutch Ministry of Public Health, Welfare and Sports (VWS), the Netherlands Cancer Registry (NKR), LK Research Funds, Dutch Prevention Funds, Dutch ZON (Zorg Onderzoek Nederland), World Cancer Research Fund (WCRF) and Statistics Netherlands (the Netherlands); Nordic Center of Excellence in Food, Nutrition and Health-Helga (Norway); Swedish Cancer Society, Swedish Scientific Council and Regional Government of Skåne and Västerbotten (Sweden); Cancer Research UK, Medical Research Council (United Kingdom).
Footnotes
The authors have declared no conflicts of interest
References
- 1.Siegel RL, Miller KD, Jemal A. Cancer statistics, 2016. CA Cancer J Clin. 2016;66(1):7–30. doi: 10.3322/caac.21332. [DOI] [PubMed] [Google Scholar]
- 2.Torre LA, Siegel RL, Ward EM, et al. Global Cancer Incidence and Mortality Rates and Trends--An Update. Cancer Epidemiol Biomarkers Prev. 2016;25(1):16–27. doi: 10.1158/1055-9965.EPI-15-0578. [DOI] [PubMed] [Google Scholar]
- 3.Rahib L, Smith BD, Aizenberg R, et al. Projecting cancer incidence and deaths to 2030: the unexpected burden of thyroid, liver, and pancreas cancers in the United States. Cancer Res. 2014;74(11):2913–21. doi: 10.1158/0008-5472.CAN-14-0155. [DOI] [PubMed] [Google Scholar]
- 4.Iorio MV, Croce CM. MicroRNAs in cancer: small molecules with a huge impact. J Clin Oncol. 2009;27(34):5848–56. doi: 10.1200/JCO.2009.24.0317. [DOI] [PMC free article] [PubMed] [Google Scholar]
- 5.Ouyang H, Gore J, Deitz S, et al. microRNA-10b enhances pancreatic cancer cell invasion by suppressing TIP30 expression and promoting EGF and TGF-beta actions. Oncogene. 2014;33(38):4664–74. doi: 10.1038/onc.2013.405. [DOI] [PMC free article] [PubMed] [Google Scholar]
- 6.Rupaimoole R, Calin GA, Lopez-Berestein G, et al. miRNA Deregulation in Cancer Cells and the Tumor Microenvironment. Cancer Discov. 2016;6(3):235–46. doi: 10.1158/2159-8290.CD-15-0893. [DOI] [PMC free article] [PubMed] [Google Scholar]
- 7.Berindan-Neagoe I, Calin GA. Molecular pathways: microRNAs, cancer cells, and microenvironment. Clin Cancer Res. 2014;20(24):6247–53. doi: 10.1158/1078-0432.CCR-13-2500. [DOI] [PMC free article] [PubMed] [Google Scholar]
- 8.Bloomston M, Frankel WL, Petrocca F, et al. MicroRNA expression patterns to differentiate pancreatic adenocarcinoma from normal pancreas and chronic pancreatitis. JAMA. 2007;297(17):1901–8. doi: 10.1001/jama.297.17.1901. [DOI] [PubMed] [Google Scholar]
- 9.Preis M, Gardner TB, Gordon SR, et al. MicroRNA-10b expression correlates with response to neoadjuvant therapy and survival in pancreatic ductal adenocarcinoma. Clin Cancer Res. 2011;17(17):5812–21. doi: 10.1158/1078-0432.CCR-11-0695. [DOI] [PMC free article] [PubMed] [Google Scholar]
- 10.du Rieu MC, Torrisani J, Selves J, et al. MicroRNA-21 is induced early in pancreatic ductal adenocarcinoma precursor lesions. Clin Chem. 2010;56(4):603–12. doi: 10.1373/clinchem.2009.137364. [DOI] [PubMed] [Google Scholar]
- 11.Giovannetti E, Funel N, Peters GJ, et al. MicroRNA-21 in pancreatic cancer: correlation with clinical outcome and pharmacologic aspects underlying its role in the modulation of gemcitabine activity. Cancer Res. 2010;70(11):4528–38. doi: 10.1158/0008-5472.CAN-09-4467. [DOI] [PubMed] [Google Scholar]
- 12.Greither T, Grochola LF, Udelnow A, et al. Elevated expression of microRNAs 155, 203, 210 and 222 in pancreatic tumors is associated with poorer survival. Int J Cancer. 2010;126(1):73–80. doi: 10.1002/ijc.24687. [DOI] [PubMed] [Google Scholar]
- 13.Lee EJ, Gusev Y, Jiang J, et al. Expression profiling identifies microRNA signature in pancreatic cancer. Int J Cancer. 2007;120(5):1046–54. doi: 10.1002/ijc.22394. [DOI] [PMC free article] [PubMed] [Google Scholar]
- 14.Nakata K, Ohuchida K, Mizumoto K, et al. MicroRNA-10b is overexpressed in pancreatic cancer, promotes its invasiveness, and correlates with a poor prognosis. Surgery. 2011;150(5):916–22. doi: 10.1016/j.surg.2011.06.017. [DOI] [PubMed] [Google Scholar]
- 15.Ohuchida K, Mizumoto K, Lin C, et al. MicroRNA-10a is overexpressed in human pancreatic cancer and involved in its invasiveness partially via suppression of the HOXA1 gene. Ann Surg Oncol. 2012;19(7):2394–402. doi: 10.1245/s10434-012-2252-3. [DOI] [PubMed] [Google Scholar]
- 16.Park JK, Henry JC, Jiang J, et al. miR-132 and miR-212 are increased in pancreatic cancer and target the retinoblastoma tumor suppressor. Biochem Biophys Res Commun. 2011;406(4):518–23. doi: 10.1016/j.bbrc.2011.02.065. [DOI] [PMC free article] [PubMed] [Google Scholar]
- 17.Sempere LF, Preis M, Yezefski T, et al. Fluorescence-based codetection with protein markers reveals distinct cellular compartments for altered MicroRNA expression in solid tumors. Clin Cancer Res. 2010;16(16):4246–55. doi: 10.1158/1078-0432.CCR-10-1152. [DOI] [PMC free article] [PubMed] [Google Scholar]
- 18.Sempere LF, Korc M. A method for conducting highly sensitive microRNA in situ hybridization and immunohistochemical analysis in pancreatic cancer. Methods Mol Biol. 2013;980:43–59. doi: 10.1007/978-1-62703-287-2_4. [DOI] [PubMed] [Google Scholar]
- 19.Setoyama T, Zhang X, Natsugoe S, et al. microRNA-10b: a new marker or the marker of pancreatic ductal adenocarcinoma? Clin Cancer Res. 2011;17(17):5527–9. doi: 10.1158/1078-0432.CCR-11-1477. [DOI] [PubMed] [Google Scholar]
- 20.Szafranska AE, Doleshal M, Edmunds HS, et al. Analysis of microRNAs in pancreatic fine-needle aspirates can classify benign and malignant tissues. Clin Chem. 2008;54(10):1716–24. doi: 10.1373/clinchem.2008.109603. [DOI] [PMC free article] [PubMed] [Google Scholar]
- 21.Weiss FU, Marques IJ, Woltering JM, et al. Retinoic acid receptor antagonists inhibit miR-10a expression and block metastatic behavior of pancreatic cancer. Gastroenterology. 2009;137(6):2136–45. doi: 10.1053/j.gastro.2009.08.065. [DOI] [PubMed] [Google Scholar]
- 22.Cote GA, Gore AJ, McElyea SD, et al. A Pilot Study to Develop a Diagnostic Test for Pancreatic Ductal Adenocarcinoma Based on Differential Expression of Select miRNA in Plasma and Bile. Am J Gastroenterol. 2014 doi: 10.1038/ajg.2014.331. [DOI] [PMC free article] [PubMed] [Google Scholar]
- 23.Degueurce G, D'Errico I, Pich C, et al. Identification of a novel PPARbeta/delta/miR-21-3p axis in UV-induced skin inflammation. EMBO Mol Med. 2016;8(8):919–36. doi: 10.15252/emmm.201505384. [DOI] [PMC free article] [PubMed] [Google Scholar]
- 24.Pink RC, Samuel P, Massa D, et al. The passenger strand, miR-21-3p, plays a role in mediating cisplatin resistance in ovarian cancer cells. Gynecol Oncol. 2015;137(1):143–51. doi: 10.1016/j.ygyno.2014.12.042. [DOI] [PubMed] [Google Scholar]
- 25.Muratore S, Zeng X, Korc M, et al. Metastatic Pancreatic Adenocarcinoma After Total Pancreatectomy Islet Autotransplantation for Chronic Pancreatitis. Am J Transplant. 2016 doi: 10.1111/ajt.13851. [DOI] [PMC free article] [PubMed] [Google Scholar]
- 26.Ryu JK, Hong SM, Karikari CA, et al. Aberrant MicroRNA-155 expression is an early event in the multistep progression of pancreatic adenocarcinoma. Pancreatology. 2010;10(1):66–73. doi: 10.1159/000231984. [DOI] [PMC free article] [PubMed] [Google Scholar]
- 27.Yu J, Li A, Hong SM, et al. MicroRNA alterations of pancreatic intraepithelial neoplasias. Clin Cancer Res. 2012;18(4):981–92. doi: 10.1158/1078-0432.CCR-11-2347. [DOI] [PMC free article] [PubMed] [Google Scholar]
- 28.Riboli E, Hunt KJ, Slimani N, et al. European Prospective Investigation into Cancer and Nutrition (EPIC): study populations and data collection. Public Health Nutr. 2002;5(6B):1113–24. doi: 10.1079/PHN2002394. [DOI] [PubMed] [Google Scholar]
- 29.Spencer EA, Roddam AW, Key TJ. Accuracy of self-reported waist and hip measurements in 4492 EPIC-Oxford participants. Public Health Nutr. 2004;7(6):723–7. doi: 10.1079/phn2004600. [DOI] [PubMed] [Google Scholar]
- 30.Livak KJ, Schmittgen TD. Analysis of relative gene expression data using real-time quantitative PCR and the 2(-Delta Delta C(T)) Method. Methods. 2001;25(4):402–8. doi: 10.1006/meth.2001.1262. [DOI] [PubMed] [Google Scholar]
- 31.Roswall N, Halkjaer J, Overvad K, et al. Measures taken to restore the Danish Diet, Cancer and Health Biobank after flooding: a framework for future biobank restorations. Biopreserv Biobank. 2013;11(4):206–10. doi: 10.1089/bio.2013.0029. [DOI] [PubMed] [Google Scholar]
- 32.Chen X, Ba Y, Ma L, et al. Characterization of microRNAs in serum: a novel class of biomarkers for diagnosis of cancer and other diseases. Cell Res. 2008;18(10):997–1006. doi: 10.1038/cr.2008.282. [DOI] [PubMed] [Google Scholar]
- 33.Wareham NJ, Jakes RW, Rennie KL, et al. Validity and repeatability of a simple index derived from the short physical activity questionnaire used in the European Prospective Investigation into Cancer and Nutrition (EPIC) study. Public Health Nutr. 2003;6(4):407–13. doi: 10.1079/PHN2002439. [DOI] [PubMed] [Google Scholar]
- 34.Pepe MS, Fan J, Seymour CW. Estimating the ROC Curve in Studeis that Match Contols to Cases on Covariates. Acad Radiol. 2013;20(7):863–73. doi: 10.1016/j.acra.2013.03.004. [DOI] [PMC free article] [PubMed] [Google Scholar]
- 35.Garofalo M, Romano G, Di LG, et al. EGFR and MET receptor tyrosine kinase-altered microRNA expression induces tumorigenesis and gefitinib resistance in lung cancers. Nat Med. 2012;18(1):74–82. doi: 10.1038/nm.2577. [DOI] [PMC free article] [PubMed] [Google Scholar] [Retracted]
- 36.Gong C, Qu S, Liu B, et al. MiR-106b expression determines the proliferation paradox of TGF-beta in breast cancer cells. Oncogene. 2015;34(1):84–93. doi: 10.1038/onc.2013.525. [DOI] [PubMed] [Google Scholar]
- 37.Kong W, He L, Richards EJ, et al. Upregulation of miRNA-155 promotes tumour angiogenesis by targeting VHL and is associated with poor prognosis and triple-negative breast cancer. Oncogene. 2014;33(6):679–89. doi: 10.1038/onc.2012.636. [DOI] [PMC free article] [PubMed] [Google Scholar]
- 38.Lao G, Liu P, Wu Q, et al. Mir-155 promotes cervical cancer cell proliferation through suppression of its target gene LKB1. Tumour Biol. 2014;35(12):11933–8. doi: 10.1007/s13277-014-2479-7. [DOI] [PubMed] [Google Scholar]
- 39.Bailey P, Chang DK, Nones K, et al. Genomic analyses identify molecular subtypes of pancreatic cancer. Nature. 2017;531(7592):47–52. doi: 10.1038/nature16965. [DOI] [PubMed] [Google Scholar]
- 40.Yachida S, Jones S, Bozic I, et al. Distant metastasis occurs late during the genetic evolution of pancreatic cancer. Nature. 2010;467(7319):1114–7. doi: 10.1038/nature09515. [DOI] [PMC free article] [PubMed] [Google Scholar]
- 41.Notta F, Chan-Seng-Yue M, Lemire M, et al. A renewed model of pancreatic cancer evolution based on genomic rearrangement patterns. Nature. 2016;538(7625):378–82. doi: 10.1038/nature19823. [DOI] [PMC free article] [PubMed] [Google Scholar]
- 42.Schultz NA, Dehlendorff C, Jensen BV, et al. MicroRNA biomarkers in whole blood for detection of pancreatic cancer. JAMA. 2014;311(4):392–404. doi: 10.1001/jama.2013.284664. [DOI] [PubMed] [Google Scholar]
- 43.Wang J, Chen J, Chang P, et al. MicroRNAs in plasma of pancreatic ductal adenocarcinoma patients as novel blood-based biomarkers of disease. Cancer Prev Res (Phila) 2009;2(9):807–13. doi: 10.1158/1940-6207.CAPR-09-0094. [DOI] [PMC free article] [PubMed] [Google Scholar]
- 44.Xu J, Cao Z, Liu W, et al. Plasma miRNAs Effectively Distinguish Patients With Pancreatic Cancer From Controls: A Multicenter Study. Ann Surg. 2015 doi: 10.1097/SLA.0000000000001345. [DOI] [PubMed] [Google Scholar]
- 45.Brunetti O, Russo A, Scarpa A, et al. MicroRNA in pancreatic adenocarcinoma: predictive/prognostic biomarkers or therapeutic targets? Oncotarget. 2015;6(27):23323–41. doi: 10.18632/oncotarget.4492. [DOI] [PMC free article] [PubMed] [Google Scholar]
- 46.Srivastava SK, Arora S, Singh S, et al. MicroRNAs in pancreatic malignancy: progress and promises. Cancer Lett. 2014;347(2):167–74. doi: 10.1016/j.canlet.2014.02.015. [DOI] [PMC free article] [PubMed] [Google Scholar]
- 47.Visani M, Acquaviva G, Fiorino S, et al. Contribution of microRNA analysis to characterisation of pancreatic lesions: a review. J Clin Pathol. 2015;68(11):859–69. doi: 10.1136/jclinpath-2015-203246. [DOI] [PubMed] [Google Scholar]
- 48.Wentzensen N, Wacholder S. From differences in means between cases and controls to risk stratification: a business plan for biomarker development. Cancer Discov. 2013;3(2):148–57. doi: 10.1158/2159-8290.CD-12-0196. [DOI] [PMC free article] [PubMed] [Google Scholar]
- 49.Risch HA, Yu H, Lu L, et al. Detectable Symptomatology Preceding the Diagnosis of Pancreatic Cancer and Absolute Risk of Pancreatic Cancer Diagnosis. Am J Epidemiol. 2015;182(1):26–34. doi: 10.1093/aje/kwv026. [DOI] [PMC free article] [PubMed] [Google Scholar]
- 50.Jamieson NB, Morran DC, Morton JP, et al. MicroRNA molecular profiles associated with diagnosis, clinicopathologic criteria, and overall survival in patients with resectable pancreatic ductal adenocarcinoma. Clin Cancer Res. 2012;18(2):534–45. doi: 10.1158/1078-0432.CCR-11-0679. [DOI] [PubMed] [Google Scholar]
- 51.Yu J, Sadakari Y, Shindo K, et al. Digital next-generation sequencing identifies low-abundance mutations in pancreatic juice samples collected from the duodenum of patients with pancreatic cancer and intraductal papillary mucinous neoplasms. Gut. 2016 doi: 10.1136/gutjnl-2015-311166. [DOI] [PMC free article] [PubMed] [Google Scholar]
Associated Data
This section collects any data citations, data availability statements, or supplementary materials included in this article.
Supplementary Materials
Increasing concentrations of miR-10a or miR-10b oligonucleotides (Sigma) were added (spiked in) to 100 µl of normal human plasma pre-cleared of cell debris by centrifugation at 1,000×g for 10 minutes at 4°C. RNA was isolated using Trizol LS (Life Technologies) and converted to cDNA using 10 ng RNA and the TaqMan MicroRNA Reverse Transcription Kit in conjunction with RNU6B (internal reference), miR-10a, and miR-10b TaqMan primers (Applied Biosystems). Converted cDNA was then subjected to qRT-PCR using the ViiA7 using TaqMan probes and TaqMan Fast Advanced Master Mix (Applied Biosystems). Levels for miR-10a and miR-10b were normalized to the internal reference (U6) to establish the ΔCt value, and then normalized to the ΔCt value from the control sample (without any added oligonucleotides, ΔΔCt). Expression levels were calculated using the 2−ΔΔCt method, documenting that the qRT-PCR assay readily differentiated between miR-10a and miR-10b over a wide concentration range of the respective miR.