

Abstract
Focusing and enriching submicrometer and nanometer scale objects is of great importance for many applications in biology, chemistry, engineering, and medicine. Here, we present an acoustofluidic chip that can generate single vortex acoustic streaming inside a glass capillary through using low-power acoustic waves (only 5 V is required). The single vortex acoustic streaming that is generated, in conjunction with the acoustic radiation force, is able to enrich submicrometer- and nanometersized particles in a small volume. Numerical simulations were used to elucidate the mechanism of the single vortex formation and were verified experimentally, demonstrating the focusing of silica and polystyrene particles ranging in diameter from 80 to 500 nm. Moreover, the acoustofluidic chip was used to conduct an immunoassay in which nanoparticles that captured fluorescently labeled biomarkers were concentrated to enhance the emitted signal. With its advantages in simplicity, functionality, and power consumption, the acoustofluidic chip we present here is promising for many point-of-care applications.
Keywords: nanoparticle enrichment, acoustofluidics, acoustic streaming, surface acoustic waves, acoustic tweezers
Graphical abstract

Manipulating objects and particles at the submicrometer and nanometer ranges is of great importance in many biochemical and biomedical applications, such as the study of bacteria–host cell interaction,1,2 nanoparticle–cell interaction,3–7 sample enrichment for diagnostics,6,8–10 bioassays,11–15 and food and environmental monitoring.16 However, only a handful of methods can achieve some form of control over nanoparticles due to their small size. Centrifugation has been used to separate nanoparticles of different sizes;17,18 dielectrophoresis has been applied to accumulate and assemble nanoparticles and nanowires;19–23 magnetophoresis has been used to label and bind nanoparticles with other particles in order to mark specific samples or achieve complex manipulation of target particles;24–28 and optical tweezers and plasmonic nanotweezers have been used to realize versatile manipulation of nanoparticles and biomolecules.29–31
Compared to the aforementioned methods, acoustofluidic-based (i.e., the fusion of acoustics and microfluidics) particle manipulation offers advantages including simplicity, noncontact manipulation, high biocompatibility, low power consumption, and low equipment requirements.32–38 It has been used for the handling and processing of various biosamples including the separation of blood components,39,40 the isolation of circulating tumor cells,41 the patterning and coculturing of cells,42–48 and the manipulation of protein crystals.49 However, most existing acoustofluidic-based manipulation devices are limited to microsized particles because, as the particle size decreases, so does the acoustic radiation force experienced by the particle.
In a static fluid, small particles in an acoustic field are subjected to both the acoustic radiation force and a hydrodynamic viscous force that arises from acoustic streaming.50,51 The motion of microsized particles is dominated by the acoustic radiation force, which is much larger than the hydrodynamic force. Manipulation of microsized particles in an acoustic wave field is possible only with a specific acoustic radiation force distribution in the fluid, such as a standing wave field in a half-wavelength resonator for particles separation and focusing52,53 or a standing wave field with multiple pressure nodes created for particles patterning.35,42–46,54 As the diameter of the particles decreases to submicrometer lengths or even smaller, the acoustic radiation force decreases much more quickly than the hydrodynamic viscous force.51 As a result, the hydrodynamic viscous force becomes comparable to, or larger than, the acoustic radiation force for particles with submicrometer to nanometer diameters and, therefore, plays a significant role on the particles’ motion. The competition between the acoustic radiation force and the hydrodynamic viscous force is the reason existing acoustic wave-based systems have been unable to manipulate small particles.
One strategy to tackle this problem is to increase the magnitude of the acoustic radiation force. For example, high-frequency (>20 MHz) surface acoustic waves (SAWs)44 or well-designed bulk acoustic waves (BAWs)55 have been used to achieve successful patterning and concentrating of bacteria with a diameter of around 1 μm in static fluid. In addition, secondary acoustic radiation has been exploited to trap and concentrate nanoparticles (110 nm) in an acoustic resonator using seeding particles (∼10 μm) embedded in the fluid. This is due to the fact that the seeding particles can enhance the secondary acoustic radiation force when particle-to-particle distances become small.56 The above methods can either only handle particles with diameters of ∼1 μm or require seeding microparticles (∼10 μm) to trap nanoparticles (∼100 nm), which introduces additional complications and may not be practical for many applications.
Here, we seek to coordinate the acoustic radiation force and the hydrodynamic viscous force induced by acoustic streaming in such a way that allows the forces acting on the small particles to work together to realize prescribed manipulations of extremely small particles. In particular, we studied the generation of acoustic streaming inside a glass capillary and revealed the mechanism of single vortex acoustic streaming formation. We found that a SAW-induced general torsional vibration mode is able to create single vortex acoustic streaming in the fluid confined in the glass capillary. The working principle is different from the assumption made in a BAW system.56 In the BAW system, it is assumed that a perfect 90° phase lag between the vibrations of vertical and horizontal walls of a nearly square channel induces the single vortex acoustic streaming in the channel. Based on our theoretical simulations, we developed a simple device in which a SAW is used to introduce the torsional vibration mode to a square glass capillary that generates a single vortex acoustic streaming inside the glass capillary. Combined with the acoustic radiation force in the glass capillary, the single vortex acoustic streaming can facilitate the focusing and enrichment of particles with submicrometer to nanometer length diameters. We demonstrated the successful focusing of polystyrene particles with diameters of 500, 220, and 110 nm and silica nanoparticles with lengths of 200 and 80 nm. With its capability of high-efficiency nanoparticle concentration, our system also enables a capillary-based, disposable, homogeneous immunoassay. We demonstrated the successful detection of streptavidin with a concentration as low as 0.9 nM using biotin-labeled nanoparticles. The signal intensity was enhanced 30-fold with acoustofluidic-enabled nanoparticle enrichment as compared to direct measurement of fluorescence. Moreover, the assay only needs a sample volume of 0.5 μL and a power input as low as 5 Vpp. These low requirements make our method an excellent platform for point-of-care applications.
RESULTS AND DISCUSSION
Working Mechanism
Figure 1A illustrates the scheme of the acoustofluidic-based nanoparticle-enrichment device that consists of a lithium niobate (LiNbO3) substrate with chirped interdigital transducers (IDTs) fabricated on top and a square glass capillary which is bonded on the substrate through a thin UV epoxy layer. The image of the acoustofluidic device is given in Figure 1C. When a radio frequency signal is applied to the IDTs, a SAW is generated and travels along the x direction. The traveling SAW then propagates into the glass capillary via the epoxy layer and actuates certain vibrational modes and the corresponding acoustic streaming inside. Here, the traveling SAW is used to introduce specific vibrational modes to the glass capillary and to generate a type of acoustic streaming with a single vortex.
Figure 1.
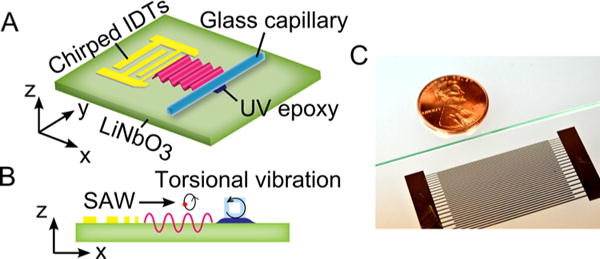
Scheme of the acoustofluidic-based nanoparticle-enrichment device. (A) 3D view of the device. (B) x–z side view of the device, showing that the SAW propagates on the surface and induces a torsional vibration in the glass capillary. (C) Image of our acoustofluidic device.
The SAW on the LiNbO3 substrate is a Rayleigh wave in which particles move in the counterclockwise direction along ellipses in a plane perpendicular to the surface and parallel to the direction of propagation when the wave propagates from left to right, as shown in Figure 1B. Such elliptical vibration can trigger a type of torsional vibrational mode in the glass capillary that the glass capillary would vibrate somehow circumferentially. Antfolk57 et al. assumed that a phase difference of π/2 between the vibrations of horizontal and vertical walls can induce a type of acoustic streaming with a large vortex in a nearly square microchannel. In this assumption, the centroid of the microchannel cross section moves rigidly along a perfect circle. Here, the general torsional vibration mainly oscillates circumferentially and is potentially able to generate a type of acoustic streaming with a single vortex in the confined fluid.
We developed numerical models to investigate the torsional vibration and the resulting acoustic streaming with a single vortex. As shown in Figure 2A, a 2D model consisting of a square cross section of the glass capillary, the fluid domain inside the glass capillary, and a thin epoxy layer was used to study the details of the vibration mode of the glass capillary, the acoustic fields, and the acoustic streaming inside the fluid domain. In the 2D model, the linear elastic wave equation for solid materials (the glass capillary and the thin epoxy layer) and the first-order wave equation for a linear viscous and compressible fluid are coupled together by requiring the continuity of the displacement and traction fields at the glass/fluid interface. The solution of the first-order problem determines the vibration mode of the glass capillary and the first-order acoustic fields in the fluid. After obtaining the first-order acoustic fields, the second-order effect of acoustic streaming is calculated by inputting the source terms determined from first-order solutions into the time-averaged, second-order, compressible Navier–Stokes equation and continuity equation. A traveling SAW is applied at the bottom of the epoxy layer to actuate the whole system. Details of the theoretical description of the model can be found in the Supporting Information (SI).
Figure 2.
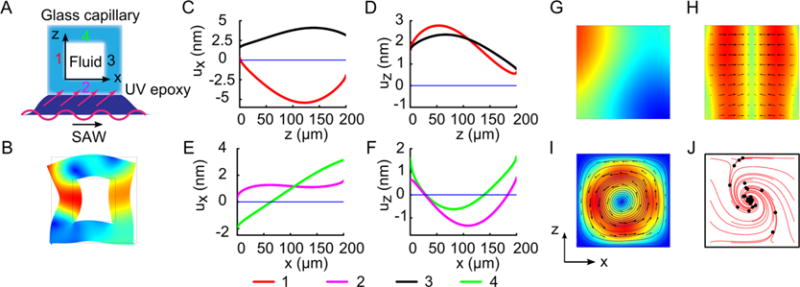
Scheme of numerical model and numerical results. (A) Scheme of numerical model. (B) Numerical results of the glass capillary’s displacement fields. (C–F) Distribution of displacement along the glass capillary’s inner walls. (G) Acoustic pressure, (H) acoustic radiation force, (I) streamline and velocity vector of acoustic streaming, and (J) trajectories of 500 nm polystyrene particles in the fluid domain, respectively.
Figure 2B shows the simulation results of the glass capillary’s displacement field when the frequency is set to 3.574 MHz, as was used in the later experiments. The animation of the glass capillary’s vibration is given in Movie 1. It can be seen that the glass capillary oscillates in a torsional mode and the inner glass/fluid interfaces vibrate in different phases. Figure 2C–F gives the displacements along the four interfaces in the normal and parallel directions. Essentially, the vertical interfaces vibrate in-phase in the z-direction while oscillating in antiphase (with phase difference of π) in the x-direction. For the horizontal interfaces, the vibrations of the bottom interface lags behind the top interface both in the x and z-directions. Under action of the specific oscillations of the four interfaces, certain first-order acoustic fields can be induced. Figure 2G shows the acoustic pressure in the fluid domain, and the corresponding acoustic radiation force acting on polystyrene particles is given in Figure 2H. As shown in the figure, the acoustic radiation force distribution is similar to the one in a half-wavelength resonator, pointing from the side-wall toward the middle. Figure 2I shows the calculated acoustic streaming in the glass capillary when it is subjected to the vibration mode shown in Figure 2B–F, having a single vortex. It should be noted that although the single vortex acoustic streaming here is formed in a square glass capillary, we can generate the single vortex acoustic streaming with the same mechanism in other asymmetric shapes (e.g., the rectangular cross sections with different W/H ratio) and in channels made of other materials (e.g., PMMA) by adjusting the input frequencies. Numerical simulation of acoustic streaming in such channels can be found in Figure S2 in the SI.
For small particles (<1 μm) in the glass capillary, the hydrodynamic viscous force induced by acoustic streaming, which drags the particles moving along the stream, plays a significant role in their motion. Meanwhile, they also experience a weak acoustic radiation force. Driven by these two forces, the small particles circulate in the single vortex, while the acoustic radiation force pushes them progressively toward the center. Numerical simulations were conducted to find the trajectories of small particles in the glass capillary when subjected to the two forces. The trajectories of 500 nm polystyrene particles are shown in Figure 2J. All of the particles move toward the center of the glass capillary in spiral traces and finally aggregate in the center. With the help of the single vortex acoustic streaming, the combined effect of the hydrodynamic viscous force and acoustic radiation force is able to aggregate and enrich small particles in the center of the glass capillary.
Single Vortex and Nanoparticle Enrichment
To demonstrate the single vortex-based nanoparticle focusing and enrichment, we performed experiments using the SAW-actuated glass capillary to concentrate nanoparticles. Figure 3A illustrates the top view of a bonded glass capillary on a LiNbO3 substrate, indicating that only a small portion of the glass capillary contacts the UV epoxy layer. First, a solution with 500 nm polystyrene particles was injected into the glass capillary with an inner cross section of 200 μm × 200 μm, as shown in Figure 3B. The length of the bonded glass capillary portion is 3.7 mm. After applying an RF signal of frequency 3.574 MHz to the chirped IDTs for 1 min, the 500 nm polystyrene particles were focused in the center of the glass capillary and formed a single line along the bonded glass capillary portion ii and the conjugate sections i and iii (Figure 3C). Figure 3D gives the enlarged images of the portions 1, 2, and 3 in Figure 3C. It can be seen that 500 nm polystyrene particles were focused very well in the bonded glass capillary region as well as the surrounding region. The focusing area was extended to ∼2 mm away from the epoxy bonding spot. Due to the relative large ratio of the length scale to the cross section scale, the acoustic wave will propagate along the capillary and generates certain vibration modes along the direction. Therefore, the operation length limit of the system is affected by the vibration mode along the capillary. We also employed confocal microscopy to check the focusing performance of the platform in the z direction. As shown in Figure 4, 530 nm fluorescent polystyrene particles can be focused very well in both the x–y and x–z planes, demonstrating that excellent 3D focusing was achieved via the acoustofluidic platform.
Figure 3.

Demonstration of the acoustofluidic focusing of 500 nm polystyrene beads inside a glass capillary. (A) Scheme of the top view of the bonded glass capillary. (B, C) Top view of solution with 500 nm polystyrene beads inside the glass capillary when the SAW was off and on, respectively. (D) Enlarged images of the sections 1, 2, and 3 in (C). The scale bars in (B) and (C) both represent 200 μm.
Figure 4.

Confocal microscopic images show effective 3D acoustofluidic focusing of 530 nm fluorescent polystyrene particles. (A) Top view (x–y plane) of the particles in the capillary when the SAW was off and on, respectively. (B) Cross section of the glass capillary showing positions of the particles in the z direction when the SAW was off and on, respectively (the cross sections 1–5 correspond to the slices of 1–5 given in (A)). The scale bars represent 100 μm. The dashed lines indicate the channel wall.
We also recorded the dynamic motion of small-sized particles in region 2 to verify that the single vortex acoustic streaming was generated inside the capillary. A solution with 530 nm fluorescent polystyrene particles was injected into the same device shown in Figure 3. The same RF signal was used to actuate the device. Figure 5 shows a series of frames from a segment of the recorded dynamic process (Movie 2). As seen in Figure 5A–H, the two labeled particles (marked with either a cyan or red circle) moved spirally around the focused particles at the center of the glass capillary, indicating that single vortex acoustic streaming has been formed in the bonded glass capillary portion. Figure 5I gives the positions of the two particles in the x direction, where the zero represents the center of the glass capillary. With the help of the single vortex acoustic streaming, the two particles rotated about, and progressively moved toward, the center. The dynamic motion of the particles verified the existence of single vortex acoustic streaming inside the glass capillary and its effect on focusing the nanoparticles.
Figure 5.
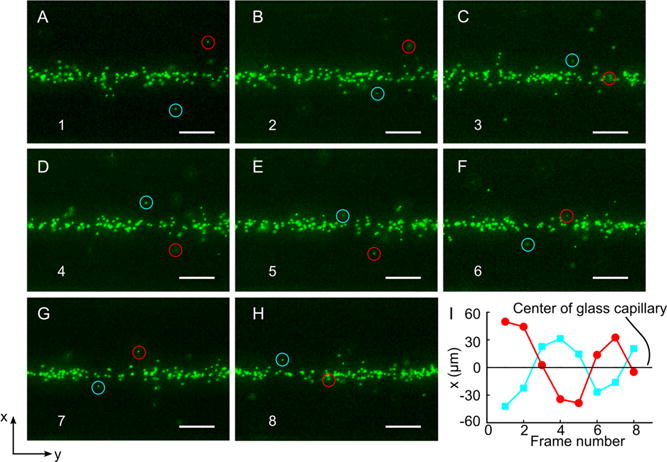
Dynamic motion of 530 nm fluorescent polystyrene particles within section 2 shown in Figure 3C when the SAW was on. (A–H) Frames from a video segment, indicating that the two labeled particles (cyan circle and red circle) moved around the center focused particles. (I) Relative positions of the two labeled particles about the center in the x-direction. The scale bar represents 50 μm.
After demonstrating the creation of single vortex acoustic streaming in the glass capillary and the focusing of 500 nm polystyrene particles, we further employed numerical simulations to analyze the possibility of focusing even smaller nanoparticles in the square glass capillary. In an acoustic field, as a particle’s size shrinks, the acoustic radiation force acting on it will drop much more rapidly than the hydrodynamic viscous force induced by acoustic streaming. Barnkob51 et al. established an expression to evaluate the critical size of particles in an acoustic resonator where the two forces play equally important roles in the particles’ motion:
| (1) |
where ν is the dynamic viscosity of the fluid, ω is the angular velocity, and Φ is the acoustic contrast factor between the particles and the fluid. For polystyrene particles in a typical acoustic resonator where the frequency is 2 MHz, the critical size would be 1.6 μm. The motion of particles whose sizes are below the critical value would be dominated by the hydrodynamic viscous force. This phenomenon would prevent focusing of nanoparticles directly using acoustic radiation force alone. Figure 6A shows the simulation results of trajectories of 220 nm polystyrene beads in a square glass capillary with inner cross section of 200 μm × 200 μm when the frequency of the SAW is 3.574 MHz. Details of the simulation can be found in SI. The particles move spirally and finally focus in the center of the glass capillary.
Figure 6.

Numerical and experimental results of focusing even smaller particles (80–220 nm) in the glass capillaries. A, B) Numerical results of 220 and 110 nm polystyrene particles’ trajectories in a glass capillary’s inner cross section with dimensions of 200 μm × 200 μm when a SAW with a frequency of 3.574 MHz is applied. (C, D) Numerical results of 110 nm polystyrene particles and 80 nm silica particles’ trajectories in a glass capillary with an inner cross section of 100 μm × 100 μm when a SAW with a frequency of 6.9 MHz is applied. (E, F) Top view of the focused 220 nm fluorescent polystyrene particles and 200 nm fluorescent silica particles in a glass capillary with inner cross section of 200 μm × 200 μm when a SAW with a frequency of 3.574 MHz was on. (G, H) Top view of focused 110 nm fluorescent polystyrene particles and 80 nm fluorescent silica particles in a glass capillary whose inner cross section is 100 μm × 100 μm when a SAW with a frequency of 7.138 MHz was on. The scale bars represent 100 μm. The dashed lines indicate the channel walls.
As the size of the particles is decreased to 110 nm, particles in the same glass capillary move toward the center and flow annularly about the center, but cannot be focused in the center, as shown in Figure 6B. This is due to the relative scale of the acoustic radiation force and the hydrodynamic viscous force acting on the particles.51 For 220 nm polystyrene particles, the acoustic radiation force acting on the particles is comparable with the viscous drag force induced by the single vortex acoustic streaming, and it can compete against the hydrodynamic viscous force and push the particles to the center. However, for the 110 nm polystyrene particles, the acoustic radiation force is much smaller than the hydrodynamic viscous force, particularly in the center region where the acoustic radiation force is much weaker than the force in the other regions (as shown in Figure 2H). As a result, in this region, the hydrodynamic viscous force dominates over the acoustic radiation force and pushes the 110 nm polystyrene particles to flow nearly along the streamlines of single vortex acoustic streaming. To focus the smaller nanoparticles, like the 110 nm polystyrene particles, the ratio between the acoustic radiation force and the hydrodynamic viscous force acting on the particles must be improved.
In acoustofluidic devices, higher-frequency acoustic fields can help enhance the relative scale, i.e., enhance the acoustic radiation force and weaken the acoustic streaming as well as weaken the hydrodynamic viscous force. In this regard, we conducted numerical simulations for these cases of higher frequencies. In these cases, a SAW with a frequency of 6.900 MHz was used to actuate a square glass capillary with an inner cross section of 100 μm × 100 μm via a thin UV epoxy layer (details about the simulation can be found in SI). Figure 6C gives the trajectories of 110 nm polystyrene particles in the smaller square glass capillary when the frequency of a SAW is 6.900 MHz, showing that the smaller particles can be focused in the center along the spiral trajectories. Thus, it is possible to focus the smaller nanoparticles by using higher-frequency SAWs to generate single vortex acoustic streaming inside a smaller square glass capillary.
Additionally, nanoparticles made of denser and harder materials can experience a stronger acoustic radiation force in an acoustic field than other nanoparticles of the same size because the denser and harder nanoparticles have a larger acoustic contrast factor with the fluid. Meanwhile, since the acoustic streaming is only dependent on the acoustic field and the properties of the fluid, it has the same effects on nanoparticles of the same size, independent of material composition. As a result, the hydrodynamic viscous force on the nanoparticles of the same size is the same. Therefore, the denser and harder nanoparticles have a larger relative ratio between the acoustic radiation force and the hydrodynamic viscous force in the glass capillary. Because it is easier to focus denser and harder nanoparticles, the limiting size for nanoparticles decreases. The numerical results of focusing 80 nm silica nanoparticles in the smaller square glass capillary are shown in Figure 6D. It can be seen that the trajectories shown in Figure 6D are sparser than the ones in Figure 6C. This indicates that the 80 nm silica nanoparticles take less rotations to reach the center of the glass capillary than the 110 nm polystyrene nanoparticles, suggesting that the 80 nm silica nanoparticles experience a larger acoustic radiation force and approach the center faster than the 110 nm polystyrene nanoparticles, even though the size of silica nanoparticles is smaller than the polystyrene nanoparticles.
Based on the numerical analysis, we experimentally focused smaller nanoparticles in square glass capillaries using SAWs of different frequencies. Figure 6E,F shows the images of focused fluorescent 220 nm polystyrene nanoparticles and 200 nm silica nanoparticles, respectively, in a square glass capillary with an inner cross section of 200 μm × 200 μm when a SAW with a frequency of 3.574 MHz is applied. Even smaller nanoparticles, like 110 nm polystyrene nanoparticles and 80 nm silica nanoparticles, were focused in a square glass capillary with an inner cross section of 100 μm × 100 μm using a SAW with a frequency of 7.138 MHz, as shown in Figure 6G,H, respectively. The success of focusing smaller nanoparticles in two square glass capillaries with different cross-sectional dimensions indicates that the single vortex acoustic streaming can be induced by certain torsional vibration modes that are repeatable in square glass capillaries with different sizes using SAWs of corresponding frequencies. Therefore, the method of using SAWs to induce torsional vibration in square glass capillaries that can generate single vortex acoustic streaming can be extended to other systems in which a SAW of higher frequency is applied to focus even smaller nanoparticles.
Besides the acoustic radiation force in the lateral direction (x–z plane), there is also an acoustic radiation force component in the longitudinal direction (y) within the square glass capillary. As shown in Figure 5, the two labeled particles moved from right to left as they flowed annularly approaching the center of the glass capillary. Also, 80 nm silica nanoparticles aggregated into a spindle-like shape in Figure 6H. Both of these observations suggest that a component of the acoustic radiation force along the y-direction can push the focused nanoparticles toward the region where the acoustic radiation force along the y-direction is small. With the help of the acoustic radiation force in the y-direction, focused nanoparticles can be further enriched in the longitudinal direction, which is important for applications of sample enrichment, such as the signal enhancement for an immunoassay given below.
Signal Enhancement for Immunoassay
Nanoparticles have been widely used as capture platforms for biomolecule detection due to their superior surface to volume ratio and fast reaction kinetics. However, it is challenging to concentrate nanoparticles in a point-of-care setting for sample preparation and signal enhancement. As demonstrated above, the acoustofluidic-based method enables the concentration of nanoparticles with a simple setup. To demonstrate the feasibility of the acoustofluidic-enhanced biomolecule detection platform, we tested the detection of streptavidin using biotin-modified nanoparticles (Figure 7A). The nanoparticles were first coated with bovine serum (BSA)-biotin and then mixed with Alexa 488 labeled streptavidin for 30 min. If the streptavidin molecules are present, they will be captured by the biotin-modified nano-particles. After applying acoustic waves, the nanoparticles will be concentrated in the center of the capillary. Due to the concentration of nanoparticles, the fluorescence signals from the Alexa 488-streptavidin will be enhanced significantly compared to randomly distributed signals. As a result, no washing step is necessary to differentiate whether the streptavidin molecules are present or not. As shown in Figure 7B, when the biotin-modified nanoparticles were mixed with PBS, no signal was detected under either acoustic on or off conditions. When the capture nanoparticles were mixed with 9.0 nM Alexa 488-streptavidin solution, strong fluorescence signals can be detected after the application of acoustic waves. Although weak fluorescence can also be detected with the acoustic off condition while using the high-sensitivity CMOS camera, the signal enhancement by acoustofluidic enrichment is so significant that no washing step is necessary to detect the presence of the target molecules.
Figure 7.
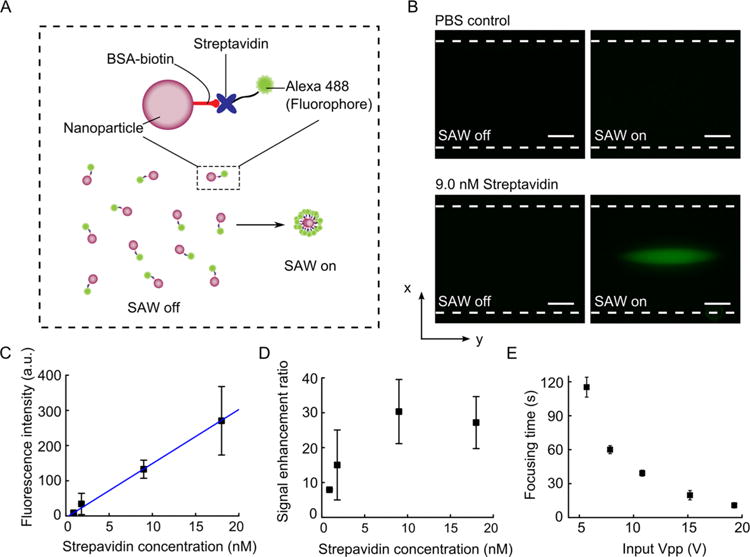
Scheme of the acoustofluidic-enhanced biomolecule detection and results of signal enhancement using the acoustofluidic platform. (A) An illustration of the assay procedure. (B) Fluorescent images of nanoparticles in a glass capillary for a PBS control group (200 nm silica nanoparticles + PBS) and a 9.0 nM streptavidin group (200 nm silica nanoparticles + 9.0 nM streptavidin) when the SAW was off and on. (C) Fluorescence intensity of nanoparticle concentrations as the streptavidin concentration increased. (D) Signal enhancement ratio as the streptavidin concentration increased. (E) Focusing time for 9.0 nM streptavidin group (200 nm silica nanoparticles + 9.0 nM streptavidin) at different input Vpp of the SAW. The scale bars in (B) represent 50 μm. The dashed lines indicate the channel walls.
In addition to the qualitative validation, we also studied the quantitative performance of the acoustofluidic-enhanced immunoassay. We prepared streptavidin solutions with a range of concentrations from 0.9 nM to 18.0 nM and measured the fluorescence intensity of the concentrated nanoparticles after applying acoustic waves. A linear response (with R2 = 0.9982) was obtained (Figure 7C), indicating the quantitative potential of this assay. We also quantified the signal enhancement ratio by comparing the mean fluorescence intensity of the solution before and after applying acoustic waves. As shown in Figure 7D, the enhancement ratio can be as high as ∼30-fold at a concentration of 9.0 nM and is ∼10-fold at a concentration of 0.9 nM.
To be used in a point-of-care setting, a device should be simple to setup as well as power-efficient. The device should be able to function even under low power inputs. To understand the potential of our device for point-of-care applications, we studied the power requirement of the system. As shown in Figure 7E, the device can achieve the same concentration performance with a power input as low as ∼5 Vpp. The only trade off when operating at a lower power is the prolonged time required to reach maximum concentration. However, even at ∼5 Vpp, the concentration time is still only ∼2 min, which does not prevent the device from being practical for real point-of-care applications. Also, in the demonstration, we loaded the samples via the capillary effect, as shown in Figure S6, requiring samples with volumes as small as 0.5 μL.
Although the above results have demonstrated that our acoustofluidic platform is effective in improving nanoparticle-based immunoassay, its applicability in real application is still unclear as the above assay used a prelabeled streptavidin as the target molecule, which is often not the case for most immunoassays. To demonstrate that our acoustofluidic platform can also be used in general immunoassay procedures, we examined the performance of this method with an independent detection antibody. Different from the aforementioned assay in which streptavidin was initially conjugated with a fluorescent label Alexa 488, here streptavidin was to be detected by an independent DyLight 488-labeled antistreptavidin antibody. As shown in Figure 8A, streptavidin was first incubated with biotin-modified nanoparticles for 30 min, then mixed with the DyLight 488 antistreptavidin antibody for 30 min in order to bind the molecule with the marker. Similar to the aforementioned assay, the mixture was injected into the glass capillary, and the acoustic wave was applied to concentrate the nanoparticles. Once the streptavidin is present, the two-step binding would occur, and the fluorescence signals were concentrated in the center of the channel. As a result, the detection signal was enhanced. Figure 8B shows the fluorescent images before and after applying acoustic waves with and without the presence of target molecule streptavidin, respectively. In Figure 8C, with a fixed concentration of detection antibody (2.5 μg/mL), we also showed that the detection signal is linearly related to streptavidin concentration (R2 = 0.9563). The fluorescent images of the detection signals are given in Figure S3 in the SI. The linear response indicates that the platform is capable of conducting quantitative detection of the target molecules with a generic immunoassay procedure. Additionally, we evaluated the effect of concentration of the detection antibody on the signal enhancement ratio. In this experiment, streptavidin concentration was fixed at 18.0 nM, while the concentration of the detection antibody varied from 2.5 μg/mL to 20.0 μg/mL. As shown in Figure 8D, the signal enhancement ratio decreases at a high concentration of the detection antibody (20.0 μg/mL). This may be due to the fact that the bindings between streptavidin and the detection antibody were close to saturation even when using a low concentration of detection antibody, and a higher concentration of the detection antibody increased the initial fluorescence signal before concentration. These results demonstrated that the acoustofluidic-based signal enhancement can work with general immunoassay procedures and can be valuable in many clinical diagnosis applications.
Figure 8.
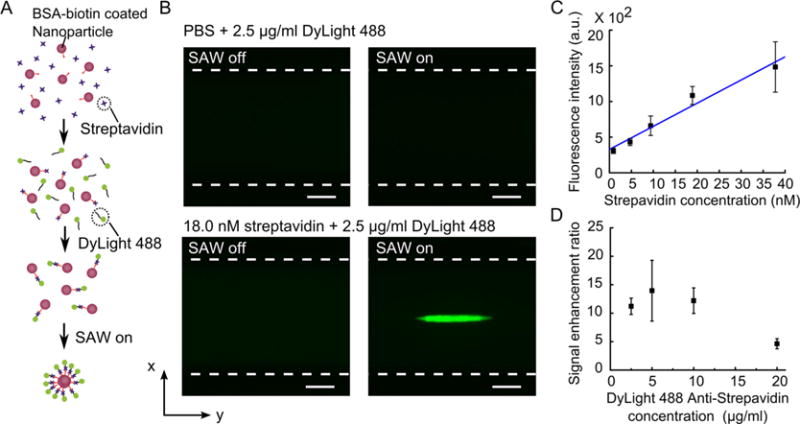
Detection of streptavidin using an independent antistreptavidin antibody. (A) An illustration of the independent detection procedures. (B) Fluorescent images of nanoparticles in a glass capillary for a PBS control group (200 nm silica nanoparticles + PBS + 2.5 μg/mL DyLight 488) and 18.0 nM streptavidin (200 nm silica nanoparticles + streptavidin + 2.5 μg/mL DyLight 488) when the SAW was off and on. (C) Fluorescence intensity as the streptavidin concentration increased (concentration of fluorescent marker was fixed at 2.5 μg/mL). (D) Signal enhancement ratio as the concentration of the detection antibody increased (streptavidin concentration was fixed at 18.0 nM). The scale bars in (B) represent 50 μm. The dashed lines indicate the channel wall.
CONCLUSIONS
In summary, we proposed a simple point-of-care device that uses SAWs to actuate a torsional vibration mode in a square glass capillary via a thin UV epoxy layer and generates acoustic streaming with a single vortex inside. With the combined action of the acoustic radiation force and the hydrodynamic viscous force induced by the single vortex acoustic streaming, submicrometer- and nanometer-sized particles can be focused and enriched within the glass capillary. Numerical analyses were employed to unfold the single vortex mechanism and found that a more general torsional vibration mode, other than a perfect circumferential vibration, is able to create the single vortex form acoustic streaming inside the glass capillary. We also experimentally confirmed the existence of single vortex form acoustic streaming inside glass capillaries actuated by SAWs. Focusing of 500–110 nm diameter polystyrene particles, as well as 200 and 80 nm silica particles, was achieved using this device. Furthermore, the device was successfully used to enrich nanoparticles coated with BSA-biotin that can capture Alexa 488-labeled streptavidin molecules in a small sample volume (∼0.5 μL) in order to enhance the output signal in an immunoassay. The device’s simple configuration, small size, and low power consumption (5 V) makes it an excellent platform for many applications such as point-of-care diagnostics, bioassays, and rare sample processing.
MATERIALS AND METHODS
Device Fabrication
The devices used in the experiments were composed of a lithium niobate substrate (Y+128° X-propagation, Red Optronics, USA) with chirped IDTs fabricated on top and a square cross-section glass capillary (Vitro tubes, VitroCom, USA) which is bonded on the substrate via UV epoxy (NOA 61, Norland Optical Adhesives, USA). Two chirped IDT structures, both of which have 20 pairs of electrodes, were fabricated on two lithium niobate substrates to obtain working frequency ranges of 3.3–7.0 MHz and 6.3–19.8 MHz. For the chirped IDTs working in a frequency range of 3.3–7.0 MHz, the spacing between the electrodes ranges linearly from 140 to 330 μm, and from 50 to 160 μm for the one working in a frequency range of 6.3 to 19.8 MHz. The aperture of both the chirped IDTs is 30 mm. The IDTs, composed of two metal layers (Cr/Au, 50 Å/500 Å), were fabricated on the substrate by a photolithography process and an e-beam evaporation process successively. Glass capillaries with dimensions of 400 μm × 400 μm × 10 mm and 200 μm × 200 μm × 10 mm were bonded on the two substrates, respectively. The dimensions of the inner square cross-section of the aforementioned glass capillaries are 200 μm × 200 μm and 100 μm × 100 μm, respectively. The glass capillaries were aligned parallel to the IDTs with a gap of 120 μm above the substrate. UV epoxy was dropped in the gap and solidified by exposure to UV light for 15 min. Detailed fabrication process is illustrated in Figure S4 in the SI.
Nanoparticles and Chemicals
The 110, 220, and 530 nm fluorescent polystyrene beads and 500 nm polystyrene beads were purchased from BangsLabs, Inc. (USA). The 80 and 200 nm silica beads were purchased from nanoComposix (USA). For the chemicals used in the immunoassay, bovine serum (BSA)-biotin was purchased from BioVision (USA), Alexa 488-setreptavidin was purchased from Invitrogen (USA), and streptavidin and DyLight 488 antistreptavidin antibody were purchased from Vector Laboratories (USA). In the immunoassay, silica nanoparticles were first coated with BSA-biotin via mixing 50 μL of silica nanoparticle solution (10 mg/mL) with 200 μL of BSA-biotin (2 mg/mL) and incubating in 4 °C for 12 h. The coated nanoparticle solution was washed by phosphate buffered saline (PBS, purchased from Sigma-Aldaich, USA) after centrifuging at 4500 g for 15 min, finally forming 50 μL of washed solution. Two μL of the coated nanoparticle solution (from 50 μL washed solutions) was then mixed with 20 μL of Alexa 488-setreptavidin solution in certain concentrations (0.9 nM, 1.8 nM, 9.0 nM, and 18.0 nM) and was placed at room temperature for 30 min to capture the molecules. In the independent detection antibody assay, 2 μL of the coated nanoparticle solution (from 50 μL washed solutions) was first mixed with 20 μL of streptavidin solution in certain concentrations (0.9 nM, 1.8 nM, 9.0 nM, 18.0 nM, and 36.0 nM) for 30 min at room temperature; the mixture was centrifuged at 4500 g for 15 min and washed by 20 μL of DyLight antistreptavidin antibody solution in certain concentrations (2.5 μg/mL, 5.0 μg/mL, 10.0 μg/mL, and 20.0 μg/mL); finally the mixture with the detection antibody was placed at room temperature for 30 min to finish the binding.
Experimental Setup
During experiments, the device was mounted on the stage of an inverted microscope (TE200U, Nikon, Japan). An AC signal, from a RF signal generator (E4422B, Agilent, USA), was applied to the chirped IDTs after amplification (100A250A, Amplifier Research, USA) to excite SAWs and actuate the acousto-fluidic system. A CCD camera (CoolSNAP HQ2, Photometrics, USA) was used to record the motion of the particles in the glass capillary. Confocal microscopy (FV1000, Olympus, Japan) was used to record the fluorescent images in z direction.
Supplementary Material
Acknowledgments
We acknowledge support from the National Institutes of Health (R01 HD086325) and the National Science Foundation (IDBR-1455658). We also acknowledge the Research Computing and Cyber infrastructure Unit of Information Technology Services at The Pennsylvania State University for providing advanced computing resources and services that have contributed to the research results reported in this article.
Footnotes
Supporting Information
The Supporting Information is available free of charge on the ACS Publications website at DOI: 10.1021/acsnano.6b06784.
Numerical simulation models (Figure S1), acoustic streaming in cross sections with different shapes and channel material (Figure S2), fluorescent images of focused particles in detection antibody assay (Figure S3), device fabrication processes (Figure S4), intensity curve of particles in the channel center for determining focusing time (Figure S5), scheme of loading small volume sample into the glass capillary (Figure S6), parameters used in the simulations (Table S1) (PDF) Movie 1: Torsional vibration of the glass capillary (AVI) Movie 2: 550 nm polystyrene particles focusing in the capillary (AVI)
ORCID
Tony Jun Huang: 0000-0003-1205-3313 Notes The authors declare no competing financial interest.
Notes
The authors declare no competing financial interest.
References
- 1.Podbilewicz B. Virus and Cell Fusion Mechanism. Annu Rev Cell Dev Biol. 2014;30:111–139. doi: 10.1146/annurev-cellbio-101512-122422. [DOI] [PubMed] [Google Scholar]
- 2.Holm CK, Jensen SB, Jakobsen MR, Cheshenko N, Horan KA, Moeller HB, Gonzalez-Dosal R, Rasmussen SB, Christensen MH, Yarovinsky TO, Rixon FJ, Herold BC, Fitzgerald KA, Paludan SR. Virus-Cell Fusion as a Trigger of Innate Immunity Dependent on the Adaptor STING. Nat Immunol. 2012;13:737–743. doi: 10.1038/ni.2350. [DOI] [PMC free article] [PubMed] [Google Scholar]
- 3.Verma A, Stellacci F. Effect of Surface Properties on Nanoparticle-Cell Interaction. Small. 2010;6:12–21. doi: 10.1002/smll.200901158. [DOI] [PubMed] [Google Scholar]
- 4.Valencia PM, Pridgen EM, Rhee M, Langer R, Farokhzad OC, Karnik R. Microfluidic Platform for Combinatorial Synthesis and Optimization of Targeted Nanoparticles for Cancer Therapy. ACS Nano. 2013;7:10671–10680. doi: 10.1021/nn403370e. [DOI] [PMC free article] [PubMed] [Google Scholar]
- 5.Kong F, Zhang X, Zhang H, Qu X, Chen D, Servos M, Mäkilä E, Salonen J, Santos HA, Hai M, Weitz DA. Inhibition of Multidrug Resistance of Cancer Cells by Co-Delivery of DNA Nanostructures and Drugs Using Porous Silicon Nanoparticles@Giant Liposomes. Adv Funct Mater. 2015;25:3330–3340. [Google Scholar]
- 6.Wang S, Zhang X, Yu B, Lee RJ, Lee LJ. Targeted Nanoparticles Enhanced Flow Electroporation of Antisense Oligonucleotides in Leukemia Cells. Biosens Bioelectron. 2010;26:778–783. doi: 10.1016/j.bios.2010.06.025. [DOI] [PMC free article] [PubMed] [Google Scholar]
- 7.Chen W, Villa-Diaz LG, Sun Y, Weng S, Kim JK, Lam RHW, Han L, Fan R, Krebsbach PH, Fu J. Nanotopography Influences Adhesion, Spreading, and Self-Renewal of Human Embryonic Stem Cells. ACS Nano. 2012;6:4094–4103. doi: 10.1021/nn3004923. [DOI] [PMC free article] [PubMed] [Google Scholar]
- 8.Nash MA, Waitumbi JN, Hoffman AS, Yager P, Stayton PS. Multiplexed Enrichment and Detection of Malarial Biomarkers Using a Stimuli-Responsive Iron Oxide and Gold Nanoparticle Reagent System. ACS Nano. 2012;6:6776–6785. doi: 10.1021/nn3015008. [DOI] [PMC free article] [PubMed] [Google Scholar]
- 9.Moioli EK, Chen M, Yang R, Shah B, Wu J, Mao JJ. Hybrid Adipogenic Implants from Adipose Stem Cells for Soft Tissue Reconstruction In Vivo. Tissue Eng, Part A. 2010;16:3299–3307. doi: 10.1089/ten.tea.2010.0157. [DOI] [PMC free article] [PubMed] [Google Scholar]
- 10.Yang R, Chen M, Lee CH, Yoon R, Lal S, Mao JJ. Clones of Ectopic Stem Cells in the Regeneration of Muscle Defects. PLoS One. 2010;5:e13547. doi: 10.1371/journal.pone.0013547. [DOI] [PMC free article] [PubMed] [Google Scholar]
- 11.Wu W, Li J, Pan D, Li J, Song S, Rong M, Li Z, Gao J, Lu J. Gold Nanoparticle-Based Enzyme-Linked Antibody-Aptamer Sandwich Assay for Detection of Salmonella Typhimurium. ACS Appl Mater Interfaces. 2014;6:16974–16981. doi: 10.1021/am5045828. [DOI] [PubMed] [Google Scholar]
- 12.Sun J, Xianyu Y, Jiang X. Point-of-Care Biochemical Assays Using Gold Nanoparticle-Implemented Microfluidics. Chem Soc Rev. 2014;43:6239–6253. doi: 10.1039/c4cs00125g. [DOI] [PubMed] [Google Scholar]
- 13.Zhu X, Wu J, Shan W, Tao W, Zhao L, Lim J-M, D’Ortenzio M, Karnik R, Huang Y, Shi J, Farokhzad O-C. Polymeric Nanoparticles Amenable to Simultaneous Installation of Exterior Targeting and Interior Therapeutic Proteins. Angew Chem, Int Ed. 2016;55:3309–3312. doi: 10.1002/anie.201509183. [DOI] [PMC free article] [PubMed] [Google Scholar]
- 14.Wang TH. Micro and Nanotechnologies Enhanced Biomolecular Sensing. Biosensors. 2013;3:283–285. doi: 10.3390/bios3030283. [DOI] [PMC free article] [PubMed] [Google Scholar]
- 15.Beh CW, Pan D, Lee J, Jiang X, Liu KJ, Mao H-Q, Wang T-H. Direct Interrogation of DNA Content Distribution in Nanoparticles by a Novel Microfluidics-Based Single-Particle Analysis. Nano Lett. 2014;14:4729–4735. doi: 10.1021/nl5018404. [DOI] [PMC free article] [PubMed] [Google Scholar]
- 16.Wang Z, Yue T, Yuan Y, Cai R, Niu C, Guo C. Preparation of Immunomagnetic Nanoparticles for the Separation and Enrichment of Alicyclobacillus Spp. in Apple Juice. Food Res Int. 2013;54:302–310. [Google Scholar]
- 17.Akbulut O, Mace CR, Martinez RV, Kumar AA, Nie Z, Patton MR, Whitesides GM. Separation of Nanoparticles in Aqueous Multiphase Systems through Centrifugation. Nano Lett. 2012;12:4060–4064. doi: 10.1021/nl301452x. [DOI] [PubMed] [Google Scholar]
- 18.Sharma V, Park K, Srinivasarao M. Shape Separation of Gold Nanorods Using Centrifugation. Proc Natl Acad Sci U S A. 2009;106:4981–4985. doi: 10.1073/pnas.0800599106. [DOI] [PMC free article] [PubMed] [Google Scholar]
- 19.Bhatt KH, Velev OD. Control and Modeling of the Dielectrophoretic Assembly of On-Chip Nanoparticle Wires. Langmuir. 2004;20:467–476. doi: 10.1021/la0349976. [DOI] [PubMed] [Google Scholar]
- 20.Dürr M, Kentsch J, Müller T, Schnelle T, Stelzle M. Microdevices for Manipulation and Accumulation of Micro- and Nanoparticles by Dielectrophoresis. Electrophoresis. 2003;24:722–731. doi: 10.1002/elps.200390087. [DOI] [PubMed] [Google Scholar]
- 21.Xu J, Kwak KJ, Lee JL, Agarwal G. Lifting and Sorting of Charged Au Nanoparticles by Electrostatic Forces in Atomic Force Microscopy. Small. 2010;6:2105–2108. doi: 10.1002/smll.201000924. [DOI] [PubMed] [Google Scholar]
- 22.Glawdel T, Ren CL. Encyclopedia of Micro fluidics and Nano fluidics. Springer New York; New York: 2015. Electrokinetic Focusing; pp. 806–807. [Google Scholar]
- 23.Ren CL. Encyclopedia of Micro fluidics and Nanofluidics. Springer New York; New York: 2015. Electrokinetic Dispensing; pp. 773–782. [Google Scholar]
- 24.Sahoo Y, Goodarzi A, Swihart MT, Ohulchanskyy TY, Kaur N, Furlani EP, Prasad PN. Aqueous Ferrofluid of Magnetite Nanoparticles: Fluorescence Labeling and Magnetophoretic Control. J Phys Chem, B. 2005;109:3879–3885. doi: 10.1021/jp045402y. [DOI] [PubMed] [Google Scholar]
- 25.Pan X, Guan J, Yoo J-W, Epstein AJ, Lee LJ, Lee RJ. Cationic Lipid-Coated Magnetic Nanoparticles Associated with Transferrin for Gene Delivery. Int J Pharm (Amsterdam, Neth) 2008;358:263–270. doi: 10.1016/j.ijpharm.2008.02.020. [DOI] [PMC free article] [PubMed] [Google Scholar]
- 26.Bannwarth MB, Utech S, Ebert S, Weitz DA, Crespy D, Landfester K. Colloidal Polymers with Controlled Sequence and Branching Constructed from Magnetic Field Assembled Nanoparticles. ACS Nano. 2015;9:2720–2728. doi: 10.1021/nn5065327. [DOI] [PubMed] [Google Scholar]
- 27.Tay A, Kunze A, Jun D, Hoek E, Di Carlo D. The Age of Cortical Neural Networks Affects Their Interactions with Magnetic Nanoparticles. Small. 2016;12:3559–3567. doi: 10.1002/smll.201600673. [DOI] [PMC free article] [PubMed] [Google Scholar]
- 28.Kunze A, Tseng P, Godzich C, Murray C, Caputo A, Schweizer FE, Di Carlo D. Engineering Cortical Neuron Polarity with Nanomagnets on a Chip. ACS Nano. 2015;9:3664–3676. doi: 10.1021/nn505330w. [DOI] [PubMed] [Google Scholar]
- 29.Wang K, Schonbrun E, Steinvurzel P, Crozier KB. Trapping and Rotating Nanoparticles Using a Plasmonic Nano-Tweezer with an Integrated Heat Sink. Nat Commun. 2011;2:469. doi: 10.1038/ncomms1480. [DOI] [PubMed] [Google Scholar]
- 30.Yang AHJ, Moore SD, Schmidt BS, Klug M, Lipson M, Erickson D. Optical Manipulation of Nanoparticles and Biomolecules in Sub-Wavelength Slot Waveguides. Nature. 2009;457:71–75. doi: 10.1038/nature07593. [DOI] [PubMed] [Google Scholar]
- 31.Erickson D, Serey X, Chen Y-F, Mandal S. Nano-manipulation Using near Field Photonics. Lab Chip. 2011;11:995–1009. doi: 10.1039/c0lc00482k. [DOI] [PubMed] [Google Scholar]
- 32.Ren L, Chen Y, Li P, Mao Z, Huang P-H, Rufo J, Guo F, Wang L, McCoy JP, Levine SJ, Huang TJ. A High-Throughput Acoustic Cell Sorter. Lab Chip. 2015;15:3870–3879. doi: 10.1039/c5lc00706b. [DOI] [PMC free article] [PubMed] [Google Scholar]
- 33.Jakobsson O, Grenvall C, Nordin M, Evander M, Laurell T. Acoustic Actuated Fluorescence Activated Sorting of Microparticles. Lab Chip. 2014;14:1943–1950. doi: 10.1039/c3lc51408k. [DOI] [PubMed] [Google Scholar]
- 34.Ding X, Lin S-CS, Lapsley MI, Li S, Guo X, Chan CY, Chiang IK, Wang L, McCoy JP, Huang TJ. Standing Surface Acoustic Wave (SSAW) Based Multichannel Cell Sorting. Lab Chip. 2012;12:4228–4231. doi: 10.1039/c2lc40751e. [DOI] [PMC free article] [PubMed] [Google Scholar]
- 35.Li SX, Ding XY, Guo F, Chen YC, Lapsley MI, Lin SCS, Wang L, McCoy JP, Cameron CE, Huang TJ. An On-Chip, Multichannel Droplet Sorter Using Standing Surface Acoustic Waves. Anal Chem. 2013;85:5468–5474. doi: 10.1021/ac400548d. [DOI] [PMC free article] [PubMed] [Google Scholar]
- 36.Mao Z, Xie Y, Guo F, Ren L, Huang P-H, Chen Y, Rufo J, Costanzo F, Huang TJ. Experimental and Numerical Studies on Standing Surface Acoustic Wave Microfluidics. Lab Chip. 2016;16:515–524. doi: 10.1039/c5lc00707k. [DOI] [PMC free article] [PubMed] [Google Scholar]
- 37.Chen Y, Nawaz AA, Zhao Y, Huang P-H, McCoy JP, Levine SJ, Wang L, Huang TJ. Standing Surface Acoustic Wave (SSAW)-Based Microfluidic Cytometer. Lab Chip. 2014;14:916–923. doi: 10.1039/c3lc51139a. [DOI] [PMC free article] [PubMed] [Google Scholar]
- 38.Huang P-H, Xie Y, Ahmed D, Rufo J, Nama N, Chen Y, Chan CY, Huang TJ. An Acoustofluidic Micromixer Based on Oscillating Sidewall Sharp-Edges. Lab Chip. 2013;13:3847–3852. doi: 10.1039/c3lc50568e. [DOI] [PMC free article] [PubMed] [Google Scholar]
- 39.Chen Y, Wu M, Ren L, Liu J, Whitley PH, Wang L, Huang TJ. High-Throughput Acoustic Separation of Platelets from Whole Blood. Lab Chip. 2016;16:3466–3472. doi: 10.1039/c6lc00682e. [DOI] [PMC free article] [PubMed] [Google Scholar]
- 40.Yu ZTF, Aw Yong KM, Fu J. Microfluidic Blood Cell Sorting: Now and Beyond. Small. 2014;10:1687–1703. doi: 10.1002/smll.201302907. [DOI] [PMC free article] [PubMed] [Google Scholar]
- 41.Li P, Mao Z, Peng Z, Zhou L, Chen Y, Huang P-H, Truica CI, Drabick JJ, El-Deiry WS, Dao M, Suresh S, Huang TJ. Acoustic Separation of Circulating Tumor Cells. Proc Natl Acad Sci U S A. 2015;112:4970–4975. doi: 10.1073/pnas.1504484112. [DOI] [PMC free article] [PubMed] [Google Scholar]
- 42.Gesellchen F, Bernassau AL, Déjardin T, Cumming DRS, Riehle MO. Cell Patterning with a Heptagon Acoustic Tweezer – Application in Neurite Guidance. Lab Chip. 2014;14:2266–2275. doi: 10.1039/c4lc00436a. [DOI] [PubMed] [Google Scholar]
- 43.Guo F, Li P, French JB, Mao Z, Zhao H, Li S, Nama N, Fick JR, Benkovic SJ, Huang TJ. Controlling Cell–cell Interactions Using Surface Acoustic Waves. Proc Natl Acad Sci U S A. 2015;112:43–48. doi: 10.1073/pnas.1422068112. [DOI] [PMC free article] [PubMed] [Google Scholar]
- 44.Shi J, Ahmed D, Mao X, Lin S-CS, Lawit A, Huang TJ. Acoustic Tweezers: Patterning Cells and Microparticles Using Standing Surface Acoustic Waves (SSAW) Lab Chip. 2009;9:2890–2895. doi: 10.1039/b910595f. [DOI] [PubMed] [Google Scholar]
- 45.Li S, Guo F, Chen Y, Ding X, Li P, Wang L, Cameron CE, Huang TJ. Standing Surface Acoustic Wave Based Cell Coculture. Anal Chem. 2014;86:9853–9859. doi: 10.1021/ac502453z. [DOI] [PMC free article] [PubMed] [Google Scholar]
- 46.Guo F, Mao Z, Chen Y, Xie Z, Lata JP, Li P, Ren L, Liu J, Yang J, Dao M, Suresh S, Huang TJ. Three-Dimensional Manipulation of Single Cells Using Surface Acoustic Waves. Proc Natl Acad Sci U S A. 2016;113:1522–1527. doi: 10.1073/pnas.1524813113. [DOI] [PMC free article] [PubMed] [Google Scholar]
- 47.Chen Y, Ding X, Steven Lin S-C, Yang S, Huang P-H, Nama N, Zhao Y, Nawaz AA, Guo F, Wang W, Gu Y, Mallouk TE, Huang TJ. Tunable Nanowire Patterning Using Standing Surface Acoustic Waves. ACS Nano. 2013;7:3306–3314. doi: 10.1021/nn4000034. [DOI] [PMC free article] [PubMed] [Google Scholar]
- 48.Ding X, Shi J, Lin SC, Yazdi S, Kiraly B, Huang TJ. Tunable Patterning of Microparticles and Cells Using Standing Surface Acoustic Waves. Lab Chip. 2012;12:2491–2497. doi: 10.1039/c2lc21021e. [DOI] [PMC free article] [PubMed] [Google Scholar]
- 49.Guo F, Zhou W, Li P, Mao Z, Yennawar NH, French JB, Huang TJ. Precise Manipulation and Patterning of Protein Crystals for Macromolecular Crystallography Using Surface Acoustic Waves. Small. 2015;11:2733–2737. doi: 10.1002/smll.201403262. [DOI] [PMC free article] [PubMed] [Google Scholar]
- 50.Muller PB, Barnkob R, Jensen MJH, Bruus H. A Numerical Study of Microparticle Acoustophoresis Driven by Acoustic Radiation Forces and Streaming-Induced Drag Forces. Lab Chip. 2012;12:4617–4627. doi: 10.1039/c2lc40612h. [DOI] [PubMed] [Google Scholar]
- 51.Barnkob R, Augustsson P, Laurell T, Bruus H. Acoustic Radiation- and Streaming-Induced Microparticle Velocities Determined by Microparticle Image Velocimetry in an Ultrasound Symmetry Plane. Phys Rev, E. 2012;86:056307. doi: 10.1103/PhysRevE.86.056307. [DOI] [PubMed] [Google Scholar]
- 52.Lenshof A, Laurell T. Continuous Separation of Cells and Particles in Microfluidic Systems. Chem Soc Rev. 2010;39:1203–1217. doi: 10.1039/b915999c. [DOI] [PubMed] [Google Scholar]
- 53.Jakobsson O, Antfolk M, Laurell T. Continuous Flow Two-Dimensional Acoustic Orientation of Nonspherical Cells. Anal Chem. 2014;86:6111–6114. doi: 10.1021/ac5012602. [DOI] [PubMed] [Google Scholar]
- 54.Chen Y, Li S, Gu Y, Li P, Ding X, Wang L, McCoy JP, Levine SJ, Huang TJ. Continuous Enrichment of Low-Abundance Cell Samples Using Standing Surface Acoustic Waves (SSAW) Lab Chip. 2014;14:924–930. doi: 10.1039/c3lc51001h. [DOI] [PMC free article] [PubMed] [Google Scholar]
- 55.Limaye MS, Hawkes JJ, Coakley WT. Ultrasonic Standing Wave Removal of Microorganisms from Suspension in Small Batch Systems. J Microbiol Methods. 1996;27:211–220. [Google Scholar]
- 56.Hammarström B, Laurell T, Nilsson J. Seed Particle-Enabled Acoustic Trapping of Bacteria and Nanoparticles in Continuous Flow Systems. Lab Chip. 2012;12:4296–4304. doi: 10.1039/c2lc40697g. [DOI] [PubMed] [Google Scholar]
- 57.Antfolk M, Muller PB, Augustsson P, Bruus H, Laurell T. Focusing of Sub-Micrometer Particles and Bacteria Enabled by Two-Dimensional Acoustophoresis. Lab Chip. 2014;14:2791–2799. doi: 10.1039/c4lc00202d. [DOI] [PubMed] [Google Scholar]
Associated Data
This section collects any data citations, data availability statements, or supplementary materials included in this article.