Abstract
The interaction of the multimodular heterogeneous nuclear ribonucleoprotein (hnRNP) K protein with many of its protein and nucleic acid partners is regulated by extracellular signals. Acting as a docking platform, K protein could link signal-transduction pathways to DNA- and RNA-directed processes such as transcription, mRNA processing, transport, and translation. Treatment of hepatocyte culture with insulin increased K protein tyrosine phosphorylation. Insulin altered K protein interaction with RNA and DNA in vitro. Administration of insulin into mice had similar effects on K protein in liver. Coimmunoprecipitations of RNA with K protein revealed preferential in vivo K protein binding of a subset of transcripts, including the insulin-inducible c-fos mRNA. These results suggest a class of insulin pathways that signal nucleic acid-directed processes that involve K protein.
The pleiotropic cellular effects of insulin action are mediated by multiple-signaling pathways that respond to the binding of insulin to its cell-surface receptor (1). Much is known about signaling pathways that activate insulin-mediated metabolic effects (2) and about the key role of the insulin receptor substrates (3, 4). Insulin also activates translation (5) and transcription (6, 7), but the picture of the mechanisms responsible for the diversity of the insulin-induced effects on gene expression is less complete.
The heterogeneous nuclear ribonucleoprotein (hnRNP) K protein was first identified as 1 of more than 20 protein components of the hnRNP particle (8). Subsequently, K protein was identified in the context of a multitude of molecular interactions (9). The modular structure of K protein accounts for the diversity of its partners, which belong to one of three groups of molecules: (i) factors involved in signal transduction, such as inducible kinases (10–12) and Vav (13); (ii) proteins involved in processes that compose gene expression, such as chromatin remodeling (14, 15), transcription (16, 17), translation (9), and RNA-processing (15) factors; and (iii) specific RNA and DNA sequences. The diversity of K protein interactions suggests that K protein acts within multiple functional modules that compose gene expression.
Because K protein is inducibly phosphorylated in response to extracellular signals (11, 12, 18), and because insulin's diverse effects on gene expression are reminiscent of the diversity of processes that involve K protein, we explored the possibility that K protein participates in insulin-responsive nucleic acid-directed events.
Materials and Methods
Cells.
Rat hepatoma cells expressing human insulin receptors (HTC-IR) were grown in plastic cell-culture flasks (19) in DMEM supplemented with 10% (vol/vol) FBS/2 mM glutamine/penicillin (100 units/ml)/streptomycin (0.01%) and humidified with a 7:93% air:CO2 mixture.
Western Blotting and Immunoprecipitations.
Immunoprecipitations with anti-K protein antibody 54 directed against the C terminus were carried out as described (10). Western blotting and immunostaining with anti-K protein antibody 54 and anti-phosphotyrosine antibodies were done by standard methods (10). All blots were developed with alkaline phosphatase colorimetric detection.
Digital Imaging and Analysis.
Digital images of bands were acquired with an Expression 638 scanner (Epson, Portland, OR) and photoshop Version 6.0 (Adobe Systems, Mountain View, CA). Densitometric analysis of protein bands was done with optiquant image analysis software (Packard).
Results
Insulin Modifies K Protein in Cultured Cells.
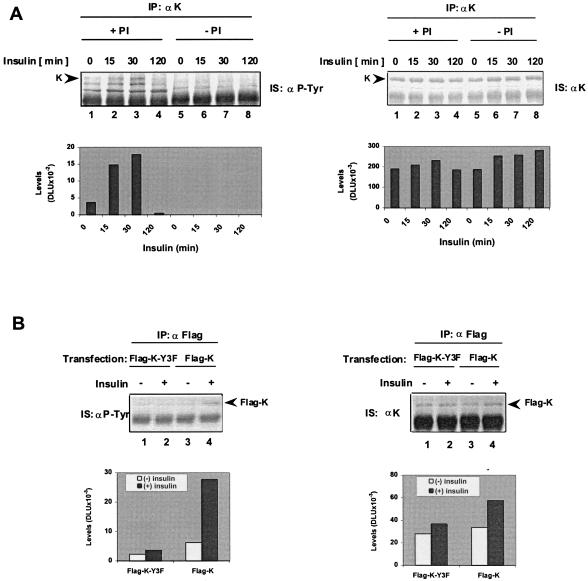
To test the effects of insulin on K protein, HTC-IR cells (19) were treated with 2 × 10⁻⁹ M insulin (Humulin-N, Lilly Research Laboratories, Indianapolis). At given times, whole-cell lysates were prepared in the presence of phosphatase inhibitors (+PI) (Fig. 1A, lanes 1–4) or their absence (−PI, lanes 5–8). K protein was immunoprecipitated with anti-K protein antibody directed against its C terminus (18). Anti-phosphotyrosine immunostaining of the K protein immunoprecipitates (Fig. 1A Left) revealed a 65-kDa insulin-inducible tyrosine-phosphorylated band that matches exactly the electrophoretic mobility of the K protein band (Fig. 1A Right). The peak level of this band was detected 30 min after insulin treatment (Fig. 1A Left, lane 3). The 65-kDa protein was undetected in anti-phosphotyrosine blots when the lysates were prepared in the absence of PIs, indicating that this protein is tyrosine-phosphorylated. There were also two other tyrosine-phosphorylated bands (Fig. 1A Left) that exhibited faster electrophoretic mobility compared with the K protein band detected in anti-K protein immunostaining (Fig. 1A Right). These bands were less detectable in extracts prepared in the absence of PIs, indicating that they also represent tyrosine-phosphorylated proteins.
Figure 1.
Insulin treatment increases tyrosine phosphorylation of K protein in the hepatoma HTC-IR cells. (A) Serum-deprived HTC-IR cells (0.5% FCS for 24 hr) were treated with 2 × 10⁻⁹ M insulin (Humulin-N, Lilly Research Laboratories). At given times, cells were harvested, and whole-cell extracts were prepared with immunoprecipitated (IP) buffer (150 mM NaCl/5 mM EDTA/1% Triton X-100/0.5% Nonidet P-40/50 mM Tris⋅HCl, pH 7.5/10 μg/ml leupeptin/0.5 mM PMSF) with PIs (+PI) (0.5 mM DTT/30 mM p-nitrophenyl phosphate/10 mM NaF/0.1 mM Na3VO4/0.1 mM Na2MoO4/10 mM β-glycerolphosphate) or without PIs (−PI). Immunoprecipitated proteins from whole-cell lysates (200 μg) were resolved by SDS/PAGE, and after Western blotting, colorimetric immunostaining (IS) was done with either an anti-phosphotyrosine (Left, IS: αP-Tyr) or anti-K protein (Right, IS: αK) antibody. Blots were scanned with an Expression 638 scanner (Epson), and densitometric analysis of K protein bands (K) was done with OPTIQUANT image analysis software (Packard). Levels of band intensities after background subtraction are expressed in digital light units (DLU). (B) Serum-deprived HTC-IR cells were transiently transfected with SuperFect (Qiagen, Chatsworth, CA) (12) with Flag-tag expression plasmid containing either wild-type K protein Flag-K (lanes 3 and 4) or Flag-K-Y3F mutant (lanes 1 and 2). At 24 hr after transfection, cells were treated without insulin or with 2 × 10⁻⁹ M insulin for 30 min, and cell extracts were prepared in 1 ml of IP buffer +PI. Proteins were immunoprecipitated with anti-Flag monoclonal antibody (1 hr) and protein A beads (30 min). Beads were washed four times with 1 ml of IP buffer, and proteins were eluted by boiling in SDS-loading buffer. Eluted proteins were resolved on SDS/PAGE, and after electrotransfer, Western blotting was carried out by using anti-phosphotyrosine (Left) and anti-K protein antibody (Right). Blots were scanned, and densitometric analysis of the Flag-K protein band (Flag-K) intensities was done as described for A.
To ensure that the 65-kDa inducible tyrosine-phosphorylated band is K protein, we transfected HTC-IR cells with either wild-type Flag-tag K fusion protein, Flag-K, or a mutant, Flag-K-Y3F, where three key tyrosine sites, Tyr-230, Tyr-234, and Tyr-236) were mutated to Phe (12). After transfection (24 hr), cells were treated for 30 min with either media or 2 × 10⁻⁹ M insulin. Proteins immunoprecipitated with anti-Flag monoclonal antibody were analyzed by Western blotting by using both anti-phosphotyrosine (Fig. 1B Left) and anti-K protein antibody (Fig. 1B Right). The anti-Flag blot revealed one insulin-inducible 65-kDa band. The size of this protein is identical to the one associated with the inducible band seen in the anti-phosphotyrosine blot from cells transfected with the wild-type Flag-K (Fig. 1B Left, lanes 3 and 4). Little tyrosine phosphorylation induction of the Flag-K-Y3F mutant was seen in insulin-treated cells compared with the cells transfected with the wild-type Flag-K protein (Fig. 1B Left, lanes 1 and 2). These results confirm that the 65-kDa insulin-responsive tyrosine-phosphorylated band is K protein. We also tested the human HeLa and primary rat mesangial cells grown in culture. In both cell lines, insulin increased the level of tyrosine phosphorylation of K protein, indicating that this effect is not restricted to the hepatic cell lineage (data not shown).
Insulin-Induced Modification of K Protein Alters Its Binding to Some but Not All Cognate Nucleic Acid Motifs in Vitro.
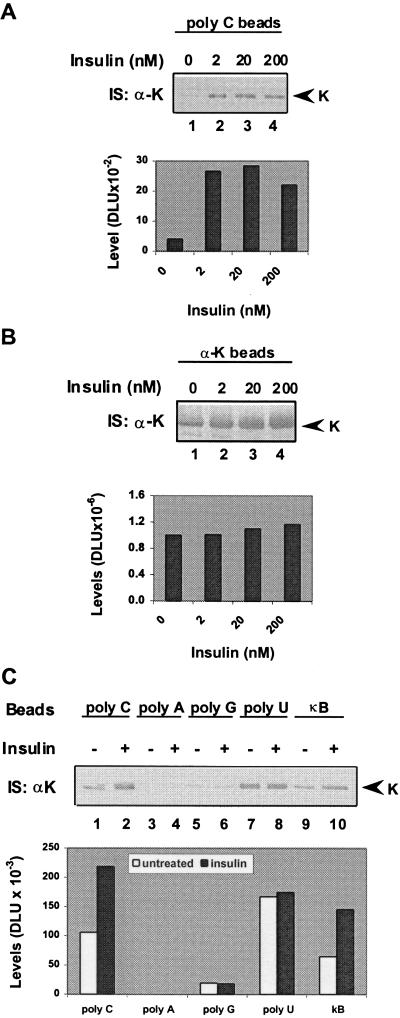
K protein binds in vitro poly(C)- and poly(U)-RNA and the κB-enhancer element (18). Phosphorylation of K protein changes its interaction with RNA (12, 20). We next tested whether insulin-induced modification of K protein alters its binding to target RNA and DNA. HTC-IR cells were treated with a range of insulin concentrations for 30 min, and whole-cell extracts were prepared. Pull-down assays were done with poly(C)-agarose, and the eluted proteins were analyzed by anti-K protein Western blotting (Fig. 2A). For comparison, K protein also was immunoprecipitated from the same amount of whole-cell lysates (Fig. 2B). These results showed that the binding of K protein from insulin-treated (2–200 nM) cells to poly(C)-beads was greater than the binding of K protein from untreated cells. These results also show that only a small fraction of the total K protein pool binds to poly(C).
Figure 2.
RNA- and DNA-binding activities of K protein from untreated and insulin-treated cells. (A and B) Serum-deprived HTC-IR cells were treated with given concentrations of insulin for 30 min. Cells were harvested, and lysates were prepared with IP buffer (Fig. 1A). Pull-down assays (200 μg of protein) were done by using either agarose beads bearing poly(C)-homopolymer in HKMT (10 mM Hepes, pH 7.5/2 mM MgCl2/0.1% Triton X-100/100 mM KCl) buffer (A) or anti-K protein antibody-protein A in IP buffer (B). (C) Serum-deprived HTC-IR cells were treated without (−) insulin or with (+) 2 × 10⁻⁹ M insulin for 30 min. Pull-down assays from lysates containing 200 μg of total protein were done with beads bearing poly(C) (lanes 1 and 2), poly(A) (lanes 3 and 4), poly(G) (lanes 5 and 6), and poly(U) (lanes 7 and 8) in HKMT buffer or biotinylated −κB DNA strand and streptavidin beads (18) in IP buffer (lanes 9 and 10).
Next, we tested binding of K protein to other RNA homopolymers and to the negative strand of the κB motif (Fig. 2C). In agreement with previous results, K protein bound weakly to poly(A) and poly(G) (18) and was insulin-unresponsive (compare lanes 1 and 2 to lanes 3–6). There was strong binding to poly(U), but the amount of K protein pulled down by poly(U) from untreated and insulin-treated cells was the same (lanes 7 and 8). As in the case of poly(C) (Fig. 2A and C, lanes 1 and 2), there was stronger binding of K protein to the κB motif (lanes 9 and 10) in extracts from insulin-treated cells compared with extracts from untreated cells. The differences in the strong binding to poly(C) and poly(U) may indicate that different pools of the K protein bind to these homopolymers.
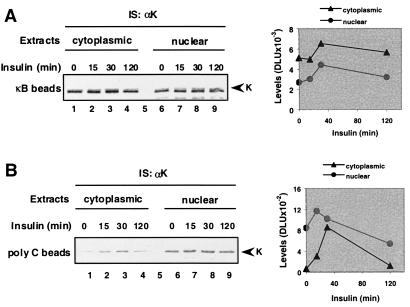
K protein is found in the nucleus and in the cytoplasm (21). Cytoplasmic and nuclear extracts were prepared from untreated and insulin-treated cells; pull-down assays were done by using κB and poly(C)-beads (Fig. 3). Both nuclear and cytoplasmic K protein bound to the κB motif. The level of binding was higher in nuclear and cytoplasmic extracts from cells treated with insulin for 15–30 min compared with untreated cells and returned to baseline after 120 min (Fig. 3A). As in the case of the κB motif, both cytoplasmic and nuclear K protein from insulin-treated cells bound to poly(C), and the level of binding was lower from untreated cells or cells treated with insulin for 2 hr (Fig. 3B). These results demonstrate that insulin modifies both nuclear and cytoplasmic K protein such that its ability to bind nucleic acids in vitro is altered.
Figure 3.
RNA- and DNA-binding activities of cytoplasmic and nuclear K protein from untreated and insulin-treated cells. Serum-deprived HTC-IR cells were treated with 2 × 10⁻⁹ M insulin. At given times, cells were harvested, and cytoplasmic (lanes 1–4) and nuclear extracts (lanes 6–9) were prepared. Pull-down assays of 200 μg of protein from cytoplasmic or nuclear extracts were done by using beads bearing either the κB DNA element in IP buffer (A) or poly(C)-RNA homopolymer in HKMT buffer (B).
Increased Poly(C) Binding of K Protein from Insulin-Treated HTC-IR Cells Is Phosphorylation-Dependent.
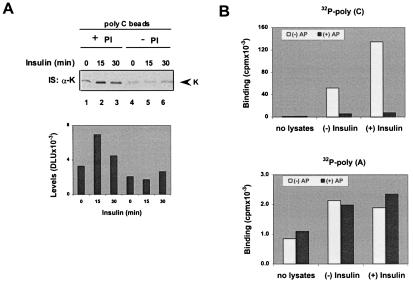
Omission of PIs in cell lysates leads to in vitro dephosphorylation of K protein by the endogenous phosphatases (Fig. 1A; ref. 18). We used this maneuver to test the role of K protein phosphorylation on binding to poly(C) (Fig. 4). There were no differences in the amount of K protein pulled down by poly(C) from untreated and insulin-treated cells when the lysates were prepared in the absence of PIs (Fig. 4A, compare lanes 1–3 to lanes 4–6). This result suggests that the increased binding of K protein to poly(C) (Figs. 2–4) reflects, in part, insulin-induced changes in the state of K protein phosphorylation. This conclusion is supported by another type of experiment in which we used alkaline phosphatase to dephosphorylate K protein followed by poly(C) binding. Fig. 4B shows that without alkaline phosphatase treatment, more (greater than 3-fold increase) [32P]poly(C) bound to K protein immunoprecipitated from insulin-treated cells compared with K protein from untreated cells. Dephosphorylation of immunoprecipitated K protein with alkaline phosphatase greatly decreased [32P]poly(C) binding, and there was little difference in the level of binding of [32P]poly(C) to dephosphorylated K protein from untreated and insulin-treated cells. In contrast, alkaline phosphatase treatment had no effect on the binding of 32P-labeled poly(A) to immunoprecipitated K protein. These experiments provide additional evidence that the enhanced binding of K protein to poly(C) is the result of insulin-induced phosphorylation of K protein.
Figure 4.
Increased poly(C) binding of K protein from insulin-treated HTC-IR cells is phosphorylation-dependent. (A) Serum-deprived HTC-IR cells were treated with 2 × 10⁻⁹ M insulin; at given times, cell lysates were prepared with IP buffer containing either the full complement of PIs (+PI) (Fig. 1A, lanes 1–3) or no PIs (−PI) (lanes 4–6). Pull-down assays were then done by using poly(C)-agarose beads. (B) Serum-deprived HTC-IR cells were treated either without (−) insulin or with (+) insulin (2 × 10⁻⁹ M insulin for 30 min). Whole-cell lysates were prepared with IP buffer containing the full complement of PIs. K protein was immunoprecipitated as before. Beads bearing anti-K protein antibody without any of the lysates (no lysates) were used as control. Beads were washed four times with 1 ml of IP buffer and two times with 1 ml of 50 mM Tris, pH 8.0/10 mM MgCl2. Beads were divided into equal aliquots and were treated without (−AP) or with (+AP) 0.1 unit of alkaline phosphatase (EC 3.1.3.1, type I-S, Sigma) in 0.1 ml of 50 mM Tris, pH 8.0/10 mM MgCl2 at 37°C for 10 min. Beads were washed four times with HKMT buffer and then were incubated in 0.3 ml of HKMT buffer containing 5 × 10⁵ cpm of [32P]poly(C) or [32P]poly(A) at 4°C for 30 min on a rotator. After binding, beads were washed four times with 1 ml of HKTM buffer, and bound radioactivity was measured with a scintillation counter (cpm).
Insulin Modifies K Protein in Mice.
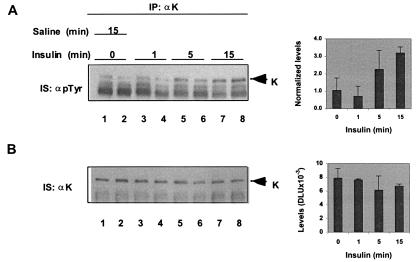
To determine whether the effects of insulin on K protein observed in cultured cells (Figs. 1–4) are relevant to the organs of intact animals, we injected portal veins of groups of anesthetized mice with either saline or 20 milliunits (mU) of insulin (Fig. 5). At given times after injections, livers were harvested, whole-liver extracts were prepared, and pull-down assays were done in the same fashion described above with HTC-IR extracts. Immunoprecipitates were analyzed in Western blots by using anti-phosphotyrosine (Fig. 5A) and anti-K protein (Fig. 5B) antibodies. Like in insulin-treated HTC-IR cells (Fig. 1), insulin administration increased the level of tyrosine phosphorylation of K protein (Fig. 5A).
Figure 5.
Insulin injection modifies K protein in mouse livers. Portal veins of a group of two ether-anesthetized mice (20 gm each) were injected with 100 μl of either saline (15 min; lanes 1 and 2) or saline containing 20 mU insulin (Humulin N, Lilly Research Laboratories) (1, 5, and 15 min; lanes 3–8). At given times, livers were excised and frozen in liquid nitrogen (12). K protein immunoprecipitates (IP) were analyzed by SDS/PAGE and Western blotting. Band intensities were quantified by densitometric analysis as before. The tyrosine-phosphorylated K protein band levels were normalized by dividing the band intensities by the level of IgG heavy-chain signal. The data are expressed as means ± SD (n = 2 animals).
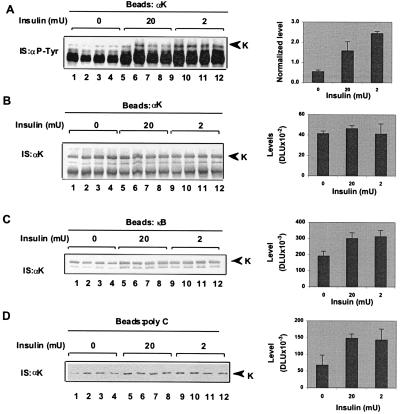
Next, we tested RNA- and DNA-binding activity of K protein in livers from groups of four mice 15 min after injection of the portal vein with either saline or 2 or 20 mU insulin. As before (Fig. 5), immunoprecipitation of K protein (Fig. 6B) revealed tyrosine phosphorylation of K protein (Fig. 6A). In agreement with the results in cultured cells (Figs. 2 and 3), there was stronger binding of K protein assays to the κB element in the pull-down of extracts from insulin-treated livers as compared with saline-injected livers (Fig. 6C). As in the case of κB binding, pull-down assays also showed that binding of K protein to poly(C)-RNA was higher in animals treated with either 2 or 20 mU of insulin compared with those injected with saline (Fig. 6D).
Figure 6.
RNA- and DNA-binding activities of K protein from insulin-treated mouse livers. Portal veins of ether-anesthetized mice in groups of four were injected with 100 μl of either saline (lanes 1–4) or saline containing insulin [Humulin-N, Lilly Research Laboratories; 20 mU (lanes 5–8) or 2 mU (lanes 9–12)]. After injection (15 min), livers were excised, and protein extracts were prepared. K protein immunoprecipitates were analyzed by SDS/PAGE and Western blotting (IS) by using either anti-phosphotyrosine (A, αP-Tyr) or anti-K (B, αK) protein antibody. DNA and RNA pull-down assays were done by using κB-DNA beads (C) and poly(C)-beads (D), respectively. Bound proteins were analyzed by SDS/PAGE and Western blotting by using anti-K protein antibodies. Band intensities were quantified by densitometric analysis as before. The tyrosine-phosphorylated K protein band levels were normalized by dividing the band intensities by the level of IgG heavy-chain signal. The data are expressed as means ± SD (n = 4 animals).
Insulin Increases c-fos mRNA Levels Associated with K Protein in HTC-IR Cells.
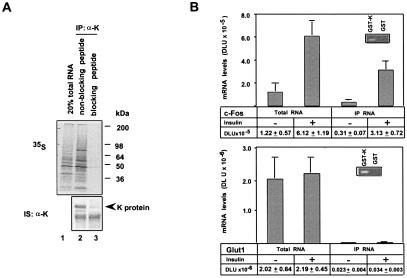
Coimmunoprecipitations followed by translation-based assays (12) were used to explore the interaction of K protein with mRNAs in cultured cells. To control for specificity, the immunoprecipitation was done with competing or noncompeting peptide. Total cellular RNA and RNA coimmunoprecipitated with K protein were used as templates in cell-free translation. 35S-labeled translational products were analyzed by SDS/PAGE and autoradiography (Fig. 7A Upper). The 35S autoradiograph revealed that when immunoprecipitation was done in the presence of noncompeting peptide, there were many mRNAs that were pulled down by the beads (lane 2). These mRNAs were precipitated specifically by K protein, because with competing peptide no mRNAs were pulled down. The profile of the 35S-labeled translation products generated from the immunoprecipitated mRNA is different from the whole-cell mRNA templates (Fig. 7A Upper, compare lane 1 with lane 2), indicating that there is a subset of mRNAs that preferentially bind K protein in vivo.
Figure 7.
Binding of mRNAs to K protein in HTC-IR cells. (A) HTC-IR cells were lysed with 0.5 ml of IP buffer containing RNase inhibitor (50 units) and the full complement of phosphatase and protease inhibitors at 4°C for 30 min. Half of the lysate was used to prepare total RNA (lane 1, 20% total RNA). The other half of the lysate was incubated with either the peptide used to produce the anti-K protein antibody [lane 3, blocking peptide (CGCQNSVKQYADVEGF); ref. 18] or a peptide from another protein [lane 2, nonblocking peptide (CGCVSNPKKPGRVTNQ)]. K protein was immunoprecipitated with anti-K protein antibody and protein A beads (IP:α-K). Total cellular RNA and the RNA eluted from the beads were translated in vitro by using the Flexi Rabbit Reticulocyte Lysate System (Promega; ref. 12). 35S-labeled translational products were resolved by SDS/PAGE and were analyzed by autoradiography (Upper). Immunoprecipitated K (IP:αK) was assayed by SDS/PAGE and Western blotting with anti-K protein antibody (IS:αK, Lower). (B) Serum-starved HTC-IR cells were treated without (−) insulin or with (+) 2 × 10⁻⁹ M insulin for 30 min. After harvesting, half of the cells were used to extract total RNA, and the other half was used in K protein pull-down experiments with anti-K protein antibody-protein A beads. Total RNA and RNA pulled down with K protein were used in reverse transcriptase with oligo(dT) primer. mRNA was reverse transcribed by using the Superscript II RT system (GIBCO/BRL). PCR was carried out by using c-fos and Glut1 primers. PCR products were resolved by nondenaturing PAGE and were quantified with a Cyclone PhosphorImager (Packard). Results are expressed as mean DLU ± SE (n = 6 independent experiments). (Insets) Total cellular RNA was mixed with beads bearing either glutathione S-transferase (GST) or GST-K. RNA extracted from the beads was used as a template in reverse transcription, and PCR was done by using either c-fos or Glut1 primers. PCR products were visualized by ethidium bromide.
Insulin increases c-fos mRNA level in hepatocytes (22). Screening of cDNA arrays with a complex 32P-labeled DNA probe generated from whole-cell RNA and RNA immunoprecipitated with K protein revealed that c-fos transcript is induced by insulin and binds to K protein (data not shown). We used semiquantitative reverse transcription–PCR of whole-cell RNA and of coimmunoprecipitated mRNA templates to quantitate c-fos-mRNA–K protein interaction in untreated and insulin-treated (2 × 10⁻⁹ M for 30 min) HTC-IR cells (Fig. 7B). These experiments revealed that ≈25% of the total cellular c-fos mRNA bound to K protein in untreated cells. Insulin treatment increased the total c-fos mRNA by 5-fold, whereas the c-fos mRNA coimmunoprecipitated with K protein increased 10-fold, such that in insulin-treated cells 50% of the total c-fos mRNA was engaged by K protein. Because a major fraction of c-fos mRNA is K protein-bound, K protein is likely to play a role in transducing insulin signal to the c-fos mRNA.
Insulin has been reported to regulate transcription of the Glut1 glucose transporter in a hepatoma cell line (23). We tested whether Glut1 mRNA coimmunoprecipitates with K protein. In contrast to c-fos, insulin treatment (2 × 10⁻⁹ M) of HTC-IR cells had no effect on the Glut1 mRNA levels in these cells (Fig. 7B). Only 1% of the total cellular Glut1 mRNA coprecipitated with K protein.
To test whether these mRNAs bind K protein directly, we mixed whole-cell RNA with beads bearing either GST-K or GST. RNA extracted from the beads was used as the template in reverse transcription, and PCR was done by using either c-fos or Glut1 primers. RNA extracted from GST-K but not from GST beads yielded PCR fragments of predicted size (Fig. 7B Insets), suggesting that both c-fos and Glut1 mRNAs bind K protein directly in vitro.
Discussion
This study demonstrates that insulin tyrosine phosphorylates K protein both in cultured cells (Figs. 1–3) and in an intact mouse organ (Figs. 5 and 6). Insulin-induced phosphorylation of K protein alters its interaction with target RNA (Figs. 2–4) and DNA (Figs. 2 and 3) sequences.
K protein is phosphorylated by several serine/threonine and tyrosine kinases including protein kinase C (11), extracellular signal-regulated kinase (ERK) (24), casein kinase II (18), and the Src family of kinases (12). These enzymes are all responsive to insulin treatment (1, 25). The theoretical number of phosphorylation compendiums of a given molecule equals 2n, where n is the number of phosphorylation sites. Seven phosphorylation sites have thus far been identified within K protein (11, 12, 24). Accordingly, K protein could exist in as many as 128 different phosphorylation states, suggesting that there may be a host of different insulin-induced K protein phosphorylation states.
Tyrosine phosphorylation of K protein in vitro by the Src family of kinases decreases binding of K protein to poly(C) and to a repertoire of mRNAs (12). Because K protein has several phosphorylation sites, the net effect of phosphorylation on nucleic acid-binding affinity and specificity might be determined by a compendium of serine, threonine, and tyrosine phosphorylated residues, rather than being determined by phosphorylation of a single residue. A given set of phosphorylated residues may favor RNA-DNA-binding, whereas another compendium may inhibit these interactions. Moreover, as illustrated by the differences in K protein binding to poly(C), poly(U), and poly(G) (Fig. 2D), the relationship between phosphorylation and K protein binding to RNA/DNA may also depend on the target nucleic acid sequence.
K protein engages nucleic acids by one or more of its three K homology (KH) domains. The KH3 domain binds both poly(C) and the CT-rich κB-enhancer element (unpublished observations; ref. 26) in vitro. It is plausible that the three KH domains are differentially affected by insulin treatment. If so, this fact may explain the observation that insulin-induced phosphorylation of K protein enhances binding of K protein to both poly(C) and the κB motif (Fig. 2D, lanes 1, 2, 9, and 10). In contrast, the strong poly(U) binding is not altered by insulin (Fig. 2D, lanes 7 and 8), because it may bind to a different KH domain that is not altered by insulin treatment.
The general function of K protein probably is to serve as a transducer of extracellular signals to sites of nucleic acid-directed processes. This notion is supported by the observations that K protein has several phosphorylation sites, that it interacts with signal transducers, and that it regulates both transcription (27) and translation (28). In the case of transcription, K protein has been shown to activate some promoters (27) but inhibit others (17). The type of process (chromatin remodeling, transcription, translation, or other) and nature (activation or inhibition) of the signal transduced by K protein could be governed, in part, by a phosphorylation compendium-specific molecular microenvironment.
Based on the diversity of K protein interactions (9), the molecular mechanisms of K protein action in insulin signaling are likely to be complex. K protein interacts with many protein factors (9). Metabolic labeling of HTC-IR cells and K protein immunoprecipitation show that insulin treatment alters the profile of proteins that associate with K protein in vivo (data not shown). A given compendium of insulin-modified K protein residues, therefore, could determine what effectors would be engaged by K protein at a specific site and how such a complex would interact with a specific nucleic acid target. By recruitment of these factors and enzymes to sites of nucleic acid-directed processes, K protein would create a microenvironment for molecular cross talk. For example, K protein interacts with and is phosphorylated by the Src and protein kinase C families of kinases (11, 12), enzymes that are insulin-responsive (29, 30). Thus, in response to insulin, K protein could facilitate cross talk between these enzymes, which, for example, could then target a translational factor at a site of mRNA translation.
Acknowledgments
We thank Dr. Goldfine for providing the HTC-IR cells. This work was supported by National Institutes of Health Grants GM45134 and DK45978, the Northwest Kidney Foundation, the American Diabetes Association, a North Atlantic Treaty Organization International Collaboration grant (to K.B.), Centrum Medyczne Ksztalcenia Podyplomowego Grant 501-1-2-08-41/00, Polish Committee for Scientific Research (Komitet Badan Naukowych) Grant 4 PO5A 084 19, Yamagiwa-Yoshida Memorial International Cancer Study Grant from the International Union Against Cancer (to J.O.), and the American Heart Association, Northwest Affiliate (to O.N.D.).
Abbreviations
- HTC-IR
rat hepatoma cells expressing human insulin receptors
- mU
milliunits
- PI
phosphatase inhibitor
- IS
colorimetric immunostaining
- GST
glutathione S-transferase
References
- 1.Saltiel R A. Am J Physiol. 1996;270:E375–E385. doi: 10.1152/ajpendo.1996.270.3.E375. [DOI] [PubMed] [Google Scholar]
- 2.Czech M P, Corvera S. J Biol Chem. 1999;274:1865–1868. doi: 10.1074/jbc.274.4.1865. [DOI] [PubMed] [Google Scholar]
- 3.White M F. Diabetologia. 1997;40, Suppl. 2:S2–S17. doi: 10.1007/s001250051387. [DOI] [PubMed] [Google Scholar]
- 4.White M F, Maron R, Kahn C R. Nature (London) 1985;318:183–186. doi: 10.1038/318183a0. [DOI] [PubMed] [Google Scholar]
- 5.Proud C G, Denton R M. Biochem J. 1997;328:329–341. doi: 10.1042/bj3280329. [DOI] [PMC free article] [PubMed] [Google Scholar]
- 6.Tavare J M, Rutter G A, Griffiths M R, Dobson S P, Gray H. Biochem Soc Trans. 1996;24:378–384. doi: 10.1042/bst0240378. [DOI] [PubMed] [Google Scholar]
- 7.Messina J L. J Biol Chem. 1991;266:17995–18001. [PubMed] [Google Scholar]
- 8.Swanson M S, Dreyfuss G. Mol Cell Biol. 1988;8:2237–2241. doi: 10.1128/mcb.8.5.2237. [DOI] [PMC free article] [PubMed] [Google Scholar]
- 9.Bomsztyk K, Van Seuningen I, Suzuki H, Denisenko O, Ostrowski J. FEBS Lett. 1997;403:113–115. doi: 10.1016/s0014-5793(97)00041-0. [DOI] [PubMed] [Google Scholar]
- 10.Van Seuningen I, Ostrowski J, Bustelo X, Sleath P, Bomsztyk K. J Biol Chem. 1995;270:26976–26985. doi: 10.1074/jbc.270.45.26976. [DOI] [PubMed] [Google Scholar]
- 11.Schullery D S, Ostrowski J, Denisenko O N, Stempka L, Shnyreva M, Suzuki H, Gschwendt M, Bomsztyk K. J Biol Chem. 1999;274:15101–15109. doi: 10.1074/jbc.274.21.15101. [DOI] [PubMed] [Google Scholar]
- 12.Ostrowski J, Schullery D S, Denisenko O N, Higaki Y, Watts J, Aebersold R, Stempka L, Gschwendt M, Bomsztyk K. J Biol Chem. 2000;275:3619–3628. doi: 10.1074/jbc.275.5.3619. [DOI] [PubMed] [Google Scholar]
- 13.Bustelo X R, Suen K-I, Michael W M, Dreyfuss G, Barbacid M. Mol Cell Biol. 1995;15:1324–1332. doi: 10.1128/mcb.15.3.1324. [DOI] [PMC free article] [PubMed] [Google Scholar]
- 14.Denisenko O N, Bomsztyk K. Mol Cell Biol. 1997;17:4707–4717. doi: 10.1128/mcb.17.8.4707. [DOI] [PMC free article] [PubMed] [Google Scholar]
- 15.Shnyreva M, Schullery D S, Suzuki H, Higaki Y, Bomsztyk K. J Biol Chem. 2000;275:15498–15503. doi: 10.1074/jbc.275.20.15498. [DOI] [PubMed] [Google Scholar]
- 16.Miau L H, Chang C J, Shen B J, Tsai S C, Lee S C. J Biol Chem. 1998;273:10784–10791. doi: 10.1074/jbc.273.17.10784. [DOI] [PubMed] [Google Scholar]
- 17.Du Q, Melnikova I N, Gardner P D. J Biol Chem. 1998;273:19877–19883. doi: 10.1074/jbc.273.31.19877. [DOI] [PubMed] [Google Scholar]
- 18.Van Seuningen I, Ostrowski J, Bomsztyk K. Biochemistry. 1995;34:5644–5650. doi: 10.1021/bi00016a040. [DOI] [PubMed] [Google Scholar]
- 19.Iwamoto Y, Wong K Y, Goldfine I D. Endocrinology. 1981;108:44–51. doi: 10.1210/endo-108-1-44. [DOI] [PubMed] [Google Scholar]
- 20.Dejgaard K, Leffers H, Rasmussen H H, Madsen P, Kruse T A, Gesser B, Nilesen H, Celis J E. J Mol Biol. 1994;236:33–48. doi: 10.1006/jmbi.1994.1116. [DOI] [PubMed] [Google Scholar]
- 21.Ostrowski J, Van Seuningen I, Seger R, Rouch C T, Sleath P R, McMullen B A, Bomsztyk K. J Biol Chem. 1994;269:17626–17634. [PubMed] [Google Scholar]
- 22.Taub R, Roy A, Dieter R, Koontz J. J Biol Chem. 1987;262:10893–10897. [PubMed] [Google Scholar]
- 23.Barthel A, Okino S T, Liao J, Nakatani K, Li J, Whitlock J P, Jr, Roth R A. J Biol Chem. 1999;274:20281–20286. doi: 10.1074/jbc.274.29.20281. [DOI] [PubMed] [Google Scholar]
- 24.Habelhah H, Shah K, Huang L, Burlingame A, Shokat K, Ronai Z. J Biol Chem. 2001;276:18090–18095. doi: 10.1074/jbc.M011396200. [DOI] [PubMed] [Google Scholar]
- 25.Kim S J, Kahn C R. Biochem J. 1997;323:621–627. doi: 10.1042/bj3230621. [DOI] [PMC free article] [PubMed] [Google Scholar]
- 26.Ito K, Sato K, Endo H. Nucleic Acids Res. 1994;22:53–58. doi: 10.1093/nar/22.1.53. [DOI] [PMC free article] [PubMed] [Google Scholar]
- 27.Michelotti E F, Michelotti G A, Aronsohn A I, Levens D. Mol Cell Biol. 1996;16:2350–2360. doi: 10.1128/mcb.16.5.2350. [DOI] [PMC free article] [PubMed] [Google Scholar]
- 28.Ostareck D H, Ostareck-Lederer A, Wilm M, Thiele B J, Mann M, Hentze M W. Cell. 1997;89:597–606. doi: 10.1016/s0092-8674(00)80241-x. [DOI] [PubMed] [Google Scholar]
- 29.Sun X J, Pons S, Asano T, Myers M G, Jr, Glasheen E, White M F. J Biol Chem. 1996;271:10583–7. doi: 10.1074/jbc.271.18.10583. [DOI] [PubMed] [Google Scholar]
- 30.Virkamaki A, Ueki K, Kahn C R. J Clin Invest. 1999;103:931–943. doi: 10.1172/JCI6609. [DOI] [PMC free article] [PubMed] [Google Scholar]


