

Abstract
Background
Research suggests that posttraumatic stress disorder (PTSD) is associated with metabolic syndrome (MetS) and that PTSD-associated MetS is related to decreased cortical thickness. However, the role of genetic factors in these associations is unclear. This study evaluated contributions of polygenic obesity risk and PTSD to MetS and of MetS and polygenic obesity risk to cortical thickness.
Methods
196 white, non-Hispanic veterans of the wars in Iraq and Afghanistan underwent clinical diagnostic interviews, physiological assessments, and genome-wide genotyping; 168 also completed magnetic resonance imaging scans. Polygenic risk scores (PRSs) for obesity were calculated from results of a prior genome-wide association study (Speliotes et al., 2010) and PTSD and MetS severity factor scores were obtained.
Results
Obesity PRS (β = .15, p = .009) and PTSD (β = .17, p = .005) predicted MetS and interacted such that the association between PTSD and MetS was stronger in individuals with greater polygenic obesity risk (β = .13, p = .02). Whole-brain vertex-wise analyses suggested that obesity PRS interacted with MetS to predict decreased cortical thickness in left rostral middle frontal gyrus (β = −.40, p < .001).
Conclusions
Results suggest that PTSD, genetic variability, and MetS are related in a transactional fashion wherein obesity genetic risk increases stress-related metabolic pathology, and compounds the ill health effects of MetS on the brain. Genetic proclivity towards MetS should be considered in PTSD patients when prescribing psychotropic medications with adverse metabolic profiles. Results are consistent with a growing literature suggestive of PTSD-related accelerated aging.
Keywords: metabolic syndrome, obesity, cortical thickness, polygenic risk, magnetic resonance imaging, posttraumatic stress disorder, accelerated aging
Posttraumatic stress disorder (PTSD) is associated with elevated risk for metabolic syndrome (MetS; Rosenbaum et al., 2015b), a condition defined by obesity, dyslipidemia, hypertension, and elevated blood sugars (National Cholesterol Education Program [NCEP], 2001). MetS is a major risk factor for the development of cardiac disease, type 2 diabetes, and other common medical conditions (Wilson et al., 2005). Two recent meta-analyses found that the prevalence of MetS was approximately two times higher in PTSD samples compared to controls, with an estimated prevalence of approximately 40% (Bartoli et al., 2013; Rosenbaum et al., 2015b). Moreover, a recent longitudinal study of young veterans returning from the wars in Iraq and/or Afghanistan found evidence of premature development of MetS among those with PTSD and suggested that PTSD severity was associated with increasing metabolic risk over time (Wolf et al., 2016a).
Twin and molecular studies suggest that genetic factors contribute to the development of specific MetS features (Avery et al., 2011), to their comorbidity (Avery et al., 2011; Kraja et al., 2011), and to the MetS diagnosis (Kraja et al., 2011). The most critical component of MetS is obesity (NCEP, 2001). Twin and molecular studies suggest that genetic factors influence approximately 40–80% of the variance in obesity-related indices such as body mass index (BMI), waist circumference, and waist-to-hip ratio (Maes et al., 1997; Silventoinen et al., 2016). The influence of additive and non-additive genetic factors on obesity may increase with age (Silventoinen et al., 2016), highlighting the changing role of genetic factors over time. A genome-wide association study (GWAS) of BMI that included discovery and replication samples totaling nearly 250,000 subjects of European ancestry (Speliotes et al., 2010) provided support for 32 loci with significant GWAS-level associations (p < 5 X 10⁻⁸) with BMI that together explained 1.45% of the variance in BMI and individually increased the odds of obesity by 1.6% to 20.3%. Many of the strongly associated variants were located in genes that had previously been associated with BMI or related phenotypes, including fat mass and obesity-associated (FTO; the top variant was located in this gene), brain-derived neurotrophic factor (BDNF), melanocortin 4 receptor (MC4R), and neuronal growth regulator 1 (NEGR1). A gene network analysis of the 32 top-associated single nucleotide polymorphisms (SNPs) revealed enrichment in pathways related to metabolism, immune functioning, growth factors, neurogenesis, and neural cell differentiation, among others (Speliotes et al., 2010).
GWAS results have been used to develop polygenic risk scores (PRSs) that summarize SNP-level phenotypic associations into a single variable that captures the additive weighted contribution of common genetic variation to the phenotype (Purcell et al., 2009; Dudbridge, 2013). While the vast majority of SNPs included in a PRS have no individual predictive value, PRSs have been shown to explain a greater proportion of phenotypic variance compared to the top GWAS SNPs (e.g., Lango Allen et al., 2010). Speliotes et al. (2010) used the aforementioned BMI GWAS to compute a PRS for BMI; using a p-value threshold of .05, this risk score explained 2.5% of the variance in BMI.
Based on the forgoing, one goal of this study was to build on our prior work on the relationship between PTSD and MetS by examining associations with an index of polygenic risk for increasing BMI, which we refer to as “obesity polygenic risk” because the high end of the BMI dimension is obesity. Although not yet evaluated in the context of PTSD, one prior study found that a polygenic score (termed “BMI polygenic profile score”), derived from the same BMI GWAS (Speliotes et al., 2010) that we utilized in this study, interacted with major depression such that polygenic scores were more strongly associated with BMI among those with depression (Clarke et al., 2015). In this study, we tested if genetic risk (as opposed to psychiatric condition) moderated the association between PTSD and MetS (see Kraemer, 2012).
MetS has also been shown to be associated with indices of neural health and integrity, such as cortical thickness. Song et al. (2015) reported reduced cortical thickness primarily in parietal regions in MetS patients compared to controls. Further, our group recently showed in whole-brain analyses conducted in the same young veteran sample that is the focus of this investigation, that PTSD-related MetS was associated with reduced cortical thickness in bilateral temporal and parietal regions and in right frontal regions, including orbitofrontal cortex, rostral anterior cingulate cortex, and central sulcus, which divides frontal and parietal lobes (Wolf et al., 2016c). These results raise the possibility that premature cortical thinning may be influenced by MetS.
However, it is also possible that genetic variability, which was not evaluated in our prior study, could account for some or all of the effects of MetS on cortical thickness or otherwise alter the nature of the association between MetS and cortical thickness. In this study, we evaluated alternative hypotheses concerning the possible associations between genes, MetS, and cortical thickness. First, we hypothesized that genetic variability could directly influence both MetS and cortical thickness (i.e., a shared main effect on both variables). If this were the case, we reasoned that the association between MetS (i.e., an acquired condition) and decreased cortical thickness would be better accounted for by the obesity PRS. Prior evidence supporting this hypothesis comes from research suggesting pleiotropic effects of genes on both obesity and brain structure. Specifically, a linkage study among Mexican American families found overlapping genetic contributions to obesity, cortical surface area in temporal, parietal, and frontal regions, and subcortical volume (Curran et al., 2013). Overlap between genetic risk for obesity and white matter microstructural integrity (in the corpus callosum and superior fronto-occipital tract) has also been reported (Spieker et al., 2015). SNPs in a number of candidate genes, including FTO (Chuang et al., 2015), and NEGR1 (Dennis et al., 2014) have also been shown to contribute to both obesity and neural structure and/or function.
An alternative hypothesis is that genetic risk for obesity moderates the association between MetS and cortical thickness. In this case, the same genetic factors that might increase risk for MetS could further interact with MetS expression to contribute to degraded neural integrity. For example, one study of the BDNF val66met obesity-related variant found that the met allele interacted with obesity to predict decreased cortical thickness in two frontal regions, with main effects for both obesity and genotype on cortical thickness also evident (Marqués-Iturria et al., 2014). Given the various ways that genes could be associated with indices of metabolic function and neural health in trauma-exposed individuals, we sought to evaluate: (1) the main and interactive associations between obesity PRS and PTSD symptoms on MetS; and (2) the main and interactive associations between obesity PRS and MetS on cortical thickness.
Methods
Participants
Participants were 196 white, non-Hispanic (as determined through genetic ancestry analyses, see below) veterans of the wars in Iraq and/or Afghanistan (Table 1). These participants were a subset of the 346 mixed-ancestry veterans who were included in Wolf et al. (2016c) who also had genotype data and who were of white, non-Hispanic ancestry. The sample for this study was limited to this ancestral group because this population was the focus of Speliotes et al. (2010) and PRSs are only appropriate for use in samples of similar ancestral background to those in the original GWAS. All subjects participated in an assessment at the Translational Research Center for TBI and Stress Disorders, a US Department of Veterans Affairs (VA) Rehabilitation Research and Development Traumatic Brain Injury Center of Excellence at VA Boston Healthcare System. Exclusion criteria were history of seizures unrelated to head injury, neurological illness, active psychotic or bipolar disorder, severe depression or anxiety that interfered with data collection, active homicidal and/or suicidal ideation with intent, cognitive disorder due to general medical condition other than traumatic brain injury (TBI), and other unstable psychological diagnosis that would interfere with accurate data collection. Men comprised 90.8% of the sample and the mean age was 31.61 years (SD: 8.33, range: 19 – 58). Of these, 168 underwent MRI (92.9% male) and were the focus of the cortical thickness analyses; none of these subjects had a history of moderate or severe TBI.
Table 1.
Demographic, Metabolic, and Psychiatric Participant Characteristics (N = 196)
| Variable | M (SD) | n (%) |
|---|---|---|
| Demographic | ||
| Sex (male) | 178 (90.8) | |
| Age | 31.61 (8.33) | |
| Race & ethnicity (WNH) | 196 (100) | |
| Metabolic | ||
| Body mass index | 27.89 (4.49) | |
| Waist/hip ratio | .88 (.07) | |
| Systolic BP | 115.92 (12.57) | |
| Diastolic BP | 74.87 (9.77) | |
| HDL | 46.50 (11.88) | |
| Triglyceridesa | 138.61 (135.01) | |
| Glucose | 87.77 (28.99) | |
| Hemoglobin A1c | 5.35 (.55) | |
| Psychiatric | ||
| Max lifetime PTSD severity | 65.03 (32.88) | |
| Lifetime PTSD dx | 143 (73) | |
Note. Mean scores on latent variables (e.g., latent metabolic syndrome, latent PTSD severity) are not provided because factor scores derived from confirmatory factor analyses are mean centered at 0. WNH = white non-Hispanic; BP = blood pressure; HDL = high density lipoprotein; PTSD = posttraumatic stress disorder; dx = diagnosis.
Two outliers affected the mean and SD. Based on this, regression analyses were re-run with the outliers removed and results were unchanged from that reported in the main text, thus they were included in all analyses.
Measures
PTSD was assessed with the Clinician Administered PTSD Scale (CAPS; Blake et al., 1995). The CAPS is a structured diagnostic interview that assesses the frequency and intensity of each of the DSM-IV PTSD criteria. Frequency and intensity scores for each criterion were summed to yield a total severity score and the DSM algorithm was applied to determine presence of PTSD diagnosis for descriptive purposes (based on frequency ≥ 1 and intensity ≥ 2 rule for symptom presence). Symptoms for three periods of time were evaluated: past month (current), post-military (worst period of symptoms following discharge), and pre-military (if relevant pre-military trauma). Analyses in this study focused on an index of PTSD severity across the lifespan: factor scores derived from a latent PTSD severity variable (obtained via confirmatory factor analysis) indicated by total symptom severity scores for each of the three PTSD assessment periods, as described in Wolf et al. (2016b; Table 1). Trauma exposure was assessed with the Traumatic Life Events Questionnaire (TLEQ, Kubany et al., 2000), a measure of exposure to 21 different types of traumatic experiences, which were summed to form an index of the total number of lifetime trauma exposure types.
Procedure
Veterans provided informed consent and underwent diagnostic interviews by PhD-level psychology professionals, blood draw for genotyping and metabolic assays, biophysiological measurements (e.g., blood pressure, weight, height), and magnetic resonance imaging (MRI). The study was approved by all relevant institutional review boards.
MetS Measurement
The MetS diagnosis was defined per the NCEP Adult Treatment Panel (ATP) III criteria (NCEP, 2001) for descriptive purposes. The main analyses focused not on MetS classification but instead on factor scores reflecting latent MetS severity as derived from a higher-order confirmatory factor analysis of the individual assay and biophysiological measures as detailed in Wolf et al. (2016c). Specifically, the lower-order factors in this model reflected blood pressure (indicated by systolic and diastolic blood pressure readings), lipid/obesity (indicated by waist-to-hip ratio, BMI, high density lipoprotein, and triglyceride levels), and blood sugars (indicated by fasting glucose and A1c levels) and these three factors loaded together on a higher-order MetS factor. Factor scores on latent MetS were the focus of analyses. This analytic approach avoids problems associated with variation in MetS criteria across different diagnostic systems and those associated with arbitrarily classifying individuals just above and below the MetS thresholds into positive/negative groups. It also reflects the gradient of MetS severity better than a single dichotomous determination and captures what is common across the individual MetS indicators. Table 1 provides descriptive statistics for the measurements used to index the latent variables.
Genotype Data
The genome-wide genotyping and cleaning of SNP data has been described in detail elsewhere (Sadeh et al., 2016) and will only be briefly described here. DNA was extracted from whole-blood samples, hybridized to Illumina HumanOmni2.5–8 microarrays, and scanned with an Illumina iScan System (Illumina, San Diego, CA) according to manufacturer’s protocol. Samples were screened for cryptic relatedness and mismatches between self-identified sex and X-chromosome heterozygosity using PLINK (Purcell et al., 2007). Self-reported ancestry was confirmed by computing principal components (PCs) which were generated by the program EIGENSTRAT (Price et al., 2006) based on 100,000 SNPs merged with 1000 genomes phase 1 reference data (The 1000 Genomes Project Consortium, 2012). All subjects in the current analysis were self-reported white, non-Hispanic within 6 SDs of the EUR (European ancestry) sample mean on the first 10 PCs. Within these subjects, an additional set of PCs was computed for use in modeling potentially confounding population substructure. Imputation of ungenotyped SNPs was performed using IMPUTE2 (Howie et al., 2012) and the EUR 1000 genomes phase 1 reference data (The 1000 Genomes Project Consortium, 2012). SNPs with missing rates > 1%, as well as SNPs failing Hardy Weinberg equilibrium tests (p < 10−6) were removed prior to imputation.
MRI Acquisition and Processing
Structural scans were acquired on a 3-Tesla Siemens Trio whole-body MRI scanner. Two T1-weighted images were collected (voxel size = 1mm3, TR = 2530ms, TE = 3.32ms, FOV = 256, Matrix = 256 × 256, flip angle = 7°, number of slices = 176) and averaged to create a single high contrast-to-noise image. Cortical thickness was measured using the FreeSurfer image analysis suite (version 5.1), which is available for download at http://surfer.nmr.mgh.harvard.edu. The preprocessing pipeline included reconstruction of the cortical surface and spatial smoothing of 10mm full width half maximum. Cortical surface models were manually checked and edited for accuracy. Additional preprocessing details are provided in Supplementary Materials.
Statistical Analyses
Obesity PRS
PRSs are computed by obtaining the GWAS results from a study and using these results as weights to compute a single score reflecting the weighted average of genome-wide genotypes for subjects in a distinct sample (Purcell et al., 2009; Dudbridge, 2013). For GWAS of continuous traits, the weights are the estimated slope for each SNP from the GWAS, which are used to average the additively coded SNPs (coded 0, 1, or 2 copies) or imputed SNP dosages in the target sample. Usually, only SNPs with significance under a pre-specified p-value threshold in the original GWAS results (e.g., all SNPs with p < .05 or p < .5) are included in the p-value calculation.
We used the results of Speliotes et al. (2010) to compute an obesity PRS. Strand-ambiguous genotypes (A-T and C-G SNPs), SNPs with a minor allele frequency less than 1% or with IMPUTE2 quality scores less than 0.5, and SNPs that were not included in the Speliotes et al. (2010) results were dropped from the imputed genotype data. The remaining SNPs were trimmed for linkage disequilibrium (LD) using PLINK’s (Purcell et al., 2007) clumping procedure with a r2 threshold of 0.2 in 500 kb window based on LD patterns in the 1000 Genomes EUR (European ancestry) sample. Then, SNPs with p < .05 in association with BMI in Speliotes et al. were used to develop the weighted obesity PRS—the same p-value threshold employed in the Speliotes et al. PRS. The final PRS was based on 17,955 SNPs.
Analytic Plan
We first employed hierarchical linear regression to examine the main and interactive effects of PTSD and obesity PRS on MetS. To do so, population substructure (top two PCs), age, sex, trauma exposure, PTSD severity factor scores (mean centered), and obesity PRS (mean centered) were entered into the first step of a regression predicting MetS factor scores. The mean centered PTSD X Obesity PRS was then entered into the second step of the equation. Following this, we conducted three whole cortex vertex-based analyses to examine the association between obesity PRS and MetS on cortical thickness. These analyses used the FreeSurfer command-line tool mri_glmfit. The first model examined the main effect of obesity PRS controlling for PTSD factor scores, age, sex, and population substructure (top two PCs). The second model also examined the main effect of obesity PRS but added MetS factor scores to the aforementioned covariates. To the extent that significant effects associated with the obesity PRS were no longer significant in this second model, this would suggest that the effects were better accounted for by MetS (the only new variable in the second model). The third model examined the association between the interaction of obesity PRS and MetS factor scores on cortical thickness, controlling for the main effects of latent MetS and obesity PRS as well as age, sex, population substructure, and PTSD factor scores. In all of these analyses, the vertex-wise significance threshold was set at p < .05, following recent research (Williams et al., 2017).
For each whole brain regression, multiple comparison correction was performed using a clusterwise procedure available in the FreeSurfer processing stream as mri_glmfit-sim (Hagler et al. 2006) with a clusterwise p-value of p < .05 (see Supplementary Materials for details). Briefly, this approach (Hagler et al., 2006; Segonne et al., 2004) generates a normally distributed synthesized z-map using an iterative procedure based on 10,000 replicates to determine the maximum possible size of adjacent (clustered) vertices for each hemisphere. Then, the obtained results are compared against the multiple-testing corrected maximum synthesized clusters to determine if the obtained clusterwise p-value is more significant than would be expected by chance based on the simulation. We extracted cortical thickness scores from significant clusters for use in follow-up analyses.
Results
Sample Characteristics
The prevalence of lifetime PTSD was 73.0% (Table 1) and the prevalence of MetS was 12.2%. Fifty-seven percent met at least one MetS criterion, and 29.6% met the NCEP ATP III waist-to-hip ratio criterion for obesity. The mean number of different types of lifetime traumatic experiences was 3.09 (SD: 2.59), and the mean maximum CAPS PTSD severity score across the three periods of assessment (current, post-deployment, pre-deployment) was 65.03 (SD: 32.88). The mean maximum duration of PTSD symptoms across the three periods of assessment was 62.17 months (SD: 65.46). Anti-depressant use was reported by 24.5% of the sample and sedative/hypnotic use by 8.7%.
PTSD and Polygenic Obesity Risk as Predictors of MetS
As shown in Table 2, significant predictors of MetS from the first step of the regression equation included age (β = .39, p < .001), sex (β = −.57, p < .001; with men showing greater MetS severity), lifetime trauma exposure (β = .13, p = .032), polygenic obesity risk (β = .15, p = .009), and latent lifetime PTSD severity (β = .17, p = .005). In total, this first step accounted for 45.3% of the variance in MetS severity. The association between PTSD and MetS was moderated by polygenic obesity risk (β = .13, p = .022) and explained an additional (and statistically significant) 1.5% of the variance in MetS.1 Figure 1 depicts the association between latent lifetime PTSD severity and latent MetS severity as a function of high versus low levels of polygenic obesity risk (for the purposes of the figure, split at the median for polygenic risk). It shows the increased strength of association between PTSD and MetS among those with greater polygenic risk.
Table 2.
Regression Results: PTSD, Obesity PRS, and their Interaction as Predictors of Latent MetS
| Step/Variable | R2 | B | SE | β | p |
|---|---|---|---|---|---|
| Step 1 | .453 | < .001 | |||
| PC1 | −.03 | .04 | −.05 | .36 | |
| PC2 | −.03 | .04 | −.05 | .42 | |
| Age | .002 | <.001 | .39 | < .001 | |
| Sex | −.09 | .009 | −.57 | < .001 | |
| Trauma total | .002 | .001 | .13 | .032 | |
| Latent PTSD sev | .04 | .01 | .17 | .005 | |
| Obesity PRS | .01 | .004 | .15 | .009 | |
| Step 2 | .469 | < .001 | |||
| Latent PTSD sev X Obesity PRS | .04 | .02 | .13 | .022 |
Note. Latent PTSD sev, Obesity PRS, and their interaction were mean centered. MetS = metabolic syndrome; PC = principal component (for ancestry); PTSD = posttraumatic stress disorder; sev = severity; PRS = polygenic risk score.
Figure 1.

Figure 1 shows the scatter plot for the association between latent lifetime PTSD severity and latent metabolic syndrome factor scores as a function of high versus low levels of polygenic obesity risk. The solid line reflects the association between PTSD severity and MetS for individuals with greater polygenic obesity risk while the dotted line reflects that association for those with lower polygenic obesity risk. The figure does not account for the covariates that were included in the associated regression model. *p < .05.
Follow-up analyses focused on potential confounds of our main and interactive effects, including education, and cigarette and anti-depressant use, are reported in the Supplementary Materials. In addition, we evaluated additional potential interaction term confounds of our main findings and detail these in the Supplementary Materials. We also examined if obesity PRS was associated with PTSD factor scores. None of these additional analyses impacted the pattern of results reported in the main text. Finally, to evaluate the specificity of this effect to PTSD, we examined if diagnostic or dimensional indicators of major depressive disorder, generalized anxiety disorder, panic disorder, or alcohol-use disorders were included in place of PTSD. None of these variables significantly predicted MetS or interacted with the obesity PRS (see Supplementary Materials).
MetS and Polygenic Obesity Risk as Predictors of Cortical Thickness
The first whole cortex analysis focused on the main effect of obesity PRS, controlling for the aforementioned demographic covariates and PTSD symptom factor scores. This analysis yielded significant clusters in the left temporal pole and right middle temporal gyrus (i.e., overlapping with Wolf et al., 2016c) that survived multiple comparison correction such that increasing obesity polygenic risk was associated with reduced thickness in these regions (Table 3). However, when MetS factor scores were added as covariates in a second model, the effect of the polygenic score was reduced for the left temporal pole, such that the cluster associated with it was smaller compared to the first model (Table 3). This implies that some of the effects that appeared to be attributable to obesity PRS in the first analysis were better accounted for by MetS.2 In contrast, PRS associations with the right middle temporal gyrus in the first model were essentially unchanged in the subsequent model that controlled for MetS severity. Associations between obesity PRS and cortical thickness from the second model are shown in Figure S1. The third analysis examined the interaction of obesity PRS and MetS severity controlling for the aforementioned demographic covariates and the main effects of obesity PRS, MetS, and PTSD factor scores. This analysis revealed a significant cluster in the left rostral middle frontal gyrus that survived multiple comparison correction (Table 3 and Figure 2). Cortical thickness values were extracted for this region for each subject for subsequent analyses.
Table 3.
Reductions in Cortical Thickness Associated with Obesity PRS and with Moderation of MetS by Obesity PRS
| Model | Cluster | Peak F Value | Peak (x, y, z) | # Vertices | Cluster Size (mm2) | p |
|---|---|---|---|---|---|---|
| 1. Obesity PRSa | Left temporal pole | −4.175 | −30.6, 11.8, −35.4 | 3706 | 2157.66 | 0.0002 |
| Right middle temporal gyrus | −4.081 | 61.3, −8.1, −23.7 | 1685 | 1026.96 | 0.01216 | |
| 2. Obesity PRSb | Left temporal pole | −3.155 | −31.4, 12.2, −35.3 | 1479 | 1001.14 | 0.01336 |
| Right middle temporal gyrus | −4.081 | 61.3, −8.1, −23.7 | 1685 | 1026.96 | 0.01216 | |
| 3. Obesity PRS X MetSc | Left rostral middle frontal gyrus | −4.50 | −38.3, 40.3, −2.2 | 1814 | 1308.75 | 0.00160 |
Note. Coordinates are in Montreal Neurological Institute (MNI) space. MetS = metabolic syndrome; PRS = polygenic risk score.
Covariates included age, sex, PC1, PC2, and PTSD severity factor scores.
Covariates included age, sex, PC1, PC2, PTSD severity factor scores, and MetS factor scores.
Covariates included age, sex, PC1, PC2, PTSD severity factor scores, and main effects of Obesity PRS and MetS factor scores.
Figure 2.
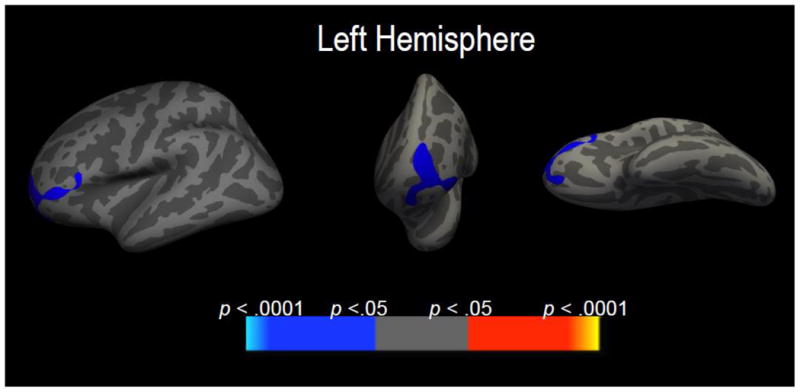
Figure 2 shows areas of decreased cortical thickness in left rostral middle frontal gyrus that emerged from the whole-brain analysis focused on the interaction between MetS factor scores and obesity polygenic risk, controlling for the main effects of these variables, PTSD, and demographic covariates. From left to right, the lateral, rostral, and ventral views of the left cortex are shown.
In order to quantify the contribution (with respect to % variance explained) of the MetS by obesity PRS interaction on cortical thickness values in the left rostral middle frontal gyrus, we ran a regression model predicting thickness values in this region as a function of the main and interactive effects of mean-centered MetS and obesity PRS, and controlling for the effects of the PCs, age, sex, and PTSD factor scores. Results suggested that only the second step of the model (i.e., the interaction of MetS by obesity PRS) was statistically significant, accounting for 15.5% of additional variance beyond step 1 (see Table 4).3 To visualize this effect, we plotted the association between latent MetS scores and thickness in this region as a function of each subject being below or at/above the full sample median on obesity PRS (Figure 3). This revealed that those with greater genetic risk showed a strong negative relationship between MetS and cortical thickness while those with less genetic risk showed a weaker and non-significant positive association between these variables. Evaluation of potential confounds of this association are detailed in the Supplementary Materials and did not alter the main pattern of results.
Table 4.
Regression Results: Obesity PRS, MetS, and their Interaction as Predictors of Cortical Thickness in the Left Rostral Middle Frontal Gyrus
| Step/Variable | R2 | B | SE | β | p |
|---|---|---|---|---|---|
| Step 1 | .038 | ||||
| PC1 | .03 | .19 | .01 | .87 | |
| PC2 | −.11 | .19 | −.05 | .56 | |
| Age | −.002 | .002 | −.10 | .28 | |
| Sex | −.03 | .06 | −.05 | .59 | |
| Latent PTSD sev | −.003 | .06 | −.004 | .96 | |
| MetS | −.30 | .39 | −.08 | .44 | |
| Obesity PRS | −.03 | .02 | −.13 | .11 | |
| Step 2 | .192 | ||||
| Latent MetS X Obesity PRS | −2.51 | .46 | −.40 | < .001 |
Note. Mean centered variables were examined for MetS, obesity PRS, and their interaction. MetS = metabolic syndrome; PC = principal component (for ancestry); PTSD = posttraumatic stress disorder; sev = severity; PRS = polygenic risk score.
Figure 3.

Figure 3 shows the scatter plot for the association between MetS factor scores and cortical thickness in the left rostral middle frontal gyrus as a function of high versus low levels of polygenic obesity risk. The solid line reflects the association between MetS severity and cortical thickness for individuals with greater polygenic obesity risk while the dotted line reflects that association for those with lower polygenic obesity risk. The figure does not account for the covariates that were included in the associated regression model. ***p < .001.
Discussion
Understanding the complexity of genetic and environmental contributions to metabolic disease and related effects on cortical thickness is of critical importance in identifying the biological mechanisms underlying health and neuronal decline, determining potential individual differences in pathways to such pathology, evaluating risk for disease, and developing interventions to treat symptoms. Our results suggest that the well-established association between PTSD and MetS (Rosenbaum et al., 2015b) varies as a function of genetic risk: greater genetic risk for obesity accentuated the association between PTSD severity and metabolic pathology. This gene X PTSD association was independent of the significant main effects of both genes and PTSD, suggesting that even within the PTSD population, there are multiple independent paths to MetS—any given individual might be at risk by virtue of genotype alone, PTSD alone, or the synergy between them. We found no evidence that genetic risk for obesity was associated with PTSD (see Supplementary Materials), suggesting that the association between PTSD and MetS was not simply a function of shared genetic effects (though see, Sumner et al., 2017).
Results also suggested that genetic risk is implicated in reduced cortical thickness in temporal regions that have previously been associated with obesity and MetS (Wolf et al., 2016c) and may further interact with the expression of MetS to predict decreased cortical thickness in the left rostral middle frontal gyrus. Neither Wolf et al. (2016c) nor Song et al. (2015) identified this brain region previously in association with MetS; thus these results raise the possibility that genetic variation modifies the regions of the brain that are vulnerable to MetS-related pathology. The left rostral middle frontal gyrus is part of the dorsolateral prefrontal cortex (DLPFC; Kikinis et al., 2010), which is critical to cognitive control (i.e., executive functions; Burzynska et al., 2012). There is evidence that functional activity in this region is implicated in the association between poor inhibitory control and obesity (Batterink et al., 2010) and prospectively predicts weight gain and dieting success (Lavagnino et al., 2016). Further, a meta-analysis found evidence of reduced activity in the left DLPFC among obese subjects relative to controls in response to food-related visual stimuli (Brooks et al., 2013). This further implicates the region in behavioral control of eating. This area is also critical for affect control and regulation which may have particular bearing on these results given the association between PTSD and MetS in this sample.
Chronic PTSD symptoms may initiate a chain reaction of stress-related cellular changes (e.g., increased autonomic reactivity and inflammation, and dysregulated hypothalamic-pituitary-adrenal [HPA] axis functioning) that increase the risk of metabolic pathology directly (Levine et al., 2014) and that also further tax a genetically vulnerable biological system. At the same time, the cumulative effects of psychotropic medication use (Vancampfort et al., 2015), poor sleep (Koren et al., 2016), and poor nutrition and exercise (Grundy et al., 2005), which are also associated with PTSD (Hall et al., 2015; Krystal et al., 2016), could be part of a behavioral pathway that sets metabolic pathology in motion in those most prone to it. Genetic vulnerability could reflect an increased propensity towards metabolic pathology (e.g., greater than normal blood pressure reactivity in response to stress) and/or a deficiency in compensatory processes that would otherwise preserve metabolic homeostasis under conditions of biological, psychological, or behavioral stress.
Many of the biological pathways that could help explain the relationship between genetics, PTSD, and MetS are also likely candidates for understanding the associations between genetics, MetS, and cortical thickness. For example, both PTSD (Passos et al., 2015) and metabolic pathology (Mirhafez et al., 2016) are associated with substantial peripheral inflammation which, over-time, can degrade vasculature structures that are important to the integrity of the blood-brain barrier (Man et al., 2007; Mauro et al., 2015). Increased blood-brain barrier permeability would allow for neuroinflammation (Man et al., 2007) and, in turn, neuroinflammation can promote neurodegeneration (Mauro et al., 2015), possibly by prompting neuronal shrinkage (Cardoso et al., 2015). Genetic risk for MetS could potentially play a role in this by causing regions of the brain to be more vulnerable to the effects of peripheral inflammation, and by directly contributing to the metabolic pathology that degrades blood-brain barrier integrity.
Findings of this study suggest transactional relationships between PTSD, genetic risk for obesity, and MetS wherein genetic risk for obesity increases PTSD-related metabolic pathology, and then further compounds the ill health effects of MetS on the brain. In this model, PTSD could promote excessive metabolic pathology among those genetically vulnerable to this physiological response. Additionally, metabolic pathology might degrade the integrity of the DLPFC only among those with a genetic vulnerability to neural degeneration in this region. However, other models are also possible; longitudinal studies are necessary to determine how genetic variability modifies risk for both MetS and neural integrity.
Clinical implications
The results of this study carry important clinical implications. For example, given that psychotropic medication use (especially anti-psychotic) is associated with substantial weight gain and associated metabolic disease (Azevedo Da Silva et al., 2016), results bear on the question of whom within the PTSD population should be prescribed these medications. Individuals with a genetic proclivity to weight gain may be poor candidates for these prescriptions. In contrast, given burgeoning data suggestive of possible therapeutic effects of exercise on PTSD symptoms and metabolic health (Rosenbaum et al., 2015a), those with high genetic risk for MetS may be good candidates for an exercise intervention to reduce both PTSD symptoms and metabolic disease. In the near future, assessing individual genetic risk for obesity and MetS could be part of a personalized medicine approach to identifying the ideal treatment and preventing further pathology.
Limitations
Results should be interpreted in light of study limitations. First, this was a cross-sectional study and thus we cannot infer causal associations among PTSD, MetS, and cortical thickness. This is important given that there is evidence both for metabolic traits, such as obesity, predicting subsequent neural degeneration (Gustafson et al., 2004) as well as evidence that neurocognitive deficits precede obesity (Belsky, et al., 2013). Second, there may be genetic markers that contribute to cortical thickness that we did not evaluate and that could account for the effects of MetS in these results. We are not aware of any polygenic cortical thickness scores that could be used to address this concern. PRSs also have several limitations including that heritability estimates based on polygenic methods only summarize the additive genetic contribution of common variants, and hence they tend to be lower than the heritability estimates from twin studies. Results were also limited by our focus on military veterans with a high prevalence of PTSD and by the emphasis on predominately male veterans of white, non-Hispanic ancestry. Related to this, due to the small number of women in the sample, we were unable to examine sex as a moderator of associations as this would amount to three-way interactions and we would be under-powered to observe such effects. Additional research in larger samples with a greater percentage of women is needed to address this concern. Finally, our sample was relatively small for genetic association studies, though quite sizable for neuroimaging genetics research, and did not include a replication sample. Additional research is needed to replicate and extend these associations in new samples.
Conclusions
Results contribute to a growing literature suggesting that PTSD is associated with substantial health decline and further indicate the independent and synergetic roles of genetic risk in association with metabolic pathology. This is consistent with the theory that PTSD may be related to an accelerated aging process (Miller & Sadeh, 2014) in which medical morbidities manifest prematurely—this type of accelerated aging may be accentuated as a function of genetic risk. In turn, metabolic pathology may be part of a pathway that further contributes to premature neuronal degradation (Wolf et al., 2016c), with the implicated brain regions partially dependent on underlying genetic vulnerability. Reduced cortical thickness may also be a sign of accelerated cellular aging, particularly among those with psychological and metabolic stress. Given this, it is important to develop behavioral and pharmacological interventions that are matched to the individual and that reduce PTSD symptoms and prevent premature health decline.
Supplementary Material
Acknowledgments
This research was supported in part by NIMH grant R21MH102834 “Neuroimaging Genetics of PTSD” to Mark Miller and the Translational Research Center for TBI and Stress Disorders (TRACTS), a VA Rehabilitation Research and Development Traumatic Brain Injury Center of Excellence (B9254-C), VA SPiRe award I21RX001594 to Jasmeet Hayes, and the Cooperative Studies Program, Department of Veterans Affairs, NINDS grant R01NS086882, and NIMH training grant (T32MH019836-01) awarded to Terence Keane, Ph.D., National Center for PTSD at VA Boston Healthcare System supporting DRM. Research reported in this publication was also supported by the National Institute On Aging of the National Institutes of Health under Award Number R03AG051877 to Erika Wolf, by a Presidential Early Career Award for Scientists and Engineers (PECASE) to Erika Wolf as administered by U.S. Department of Veterans Affairs (VA) Office of Research and Development (PECASE 2013A), and by a National Heart, Lung, and Blood Award (K01HL130650) to Jennifer Sumner. This research is the result of work supported with resources and the use of facilities at the Pharmacogenomics Analysis Laboratory, Research and Development Service, Central Arkansas Veterans Healthcare System, Little Rock, Arkansas and the Neuroimaging Research for Veterans Center, VA Boston Healthcare System. The views expressed in this article are those of the authors and do not necessarily reflect the position or policy of the Department of Veterans Affairs or the United States Government.
Footnotes
We re-ran this model controlling for all 10 PCs and found results to be essentially unchanged. The obesity PRS continued to exert a significant main effect on MetS factor scores (p = .02) and the interaction term added in step 2 explained an additional 1.4% of the variance (p = .03).
We did not conduct a whole brain analysis for MetS controlling for obesity PRS as that would substantially duplicate the analyses reported in Wolf et al. (2016c). However, we did confirm that MetS continued to evidence significant associations (all p ≤ .001) with each of the six cortical thickness clusters identified in our prior paper with obesity PRS included in the model.
We re-ran this model controlling for all 10 PCs and the results were essentially unchanged with the interaction term in step 2 explaining an additional 14.5% of the variance (p < .001) in thickness of this region.
Disclosures
All authors report no financial conflicts of interest.
References
- Avery CL, He G, North KE, Ambite JL, Boerwinkle E, Fornage M, Hindorff LA, Kooperberg C, Meigs JB, Pankow JS, Pendergrass SA, Psaty BM, Ritchie MD, Rotter JI, Taylor KD, Wilkens LR, Heiss G, Lin DY. A phenomics-based strategy identifies loci on APOC1, BRAP, and PLCG1 associated with metabolic syndrome phenotype domains. PLoS Genetics. 2011;7:e1002322. doi: 10.1371/journal.pgen.1002322. [DOI] [PMC free article] [PubMed] [Google Scholar]
- Azevedo Da Silva M, Balkau B, Roussel R, Tichet J, Fumeron F, Fagherazzi G, Nabi H D.E.S.I.R. Study Group. Longitudinal association of antidepressant medication use with metabolic syndrome: Results of a 9-year follow-up of the D.E.S.I.R. cohort study. Psychoneuroendocrinology. 2016;74:34–45. doi: 10.1016/j.psyneuen.2016.08.020. [DOI] [PubMed] [Google Scholar]
- Bartoli F, Carrà G, Crocamo C, Carretta D, Clerici M. Metabolic syndrome in people suffering from posttraumatic stress disorder: a systematic review and meta-analysis. Metabolic Syndrome and Related Disorders. 2013;11:301–308. doi: 10.1089/met.2013.0010. [DOI] [PubMed] [Google Scholar]
- Batterink L, Yokum S, Stice E. Body mass correlates inversely with inhibitory control in response to food among adolescent girls: an fMRI study. NeuroImage. 2010;52:1696–1703. doi: 10.1016/j.neuroimage.2010.05.059. [DOI] [PMC free article] [PubMed] [Google Scholar]
- Belsky DW, Caspi A, Goldman-Mellor S, Meier MH, Ramrakha S, Poulton R, Moffitt TE. Is obesity associated with a decline in intelligence quotient during the first half of the life course? American Journal of Epidemiology. 2013;178:1461–1468. doi: 10.1093/aje/kwt135. [DOI] [PMC free article] [PubMed] [Google Scholar]
- Blake DD, Weathers FW, Nagy LM, Kaloupek DG, Gusman FD, Charney DS, Keane TM. The development of a clinician-administered PTSD scale. Journal of Traumatic Stress. 1995;8:75–90. doi: 10.1007/BF02105408. [DOI] [PubMed] [Google Scholar]
- Brooks SJ, Cedernaes J, Schiöth HB. Increased prefrontal and parahippocampal activation with reduced dorsolateral prefrontal and insular cortex activation to food images in obesity: a meta-analysis of fMRI studies. PLoS One. 2013;8:e60393. doi: 10.1371/journal.pone.0060393. [DOI] [PMC free article] [PubMed] [Google Scholar]
- Burzynska AZ, Nagel IE, Preuschhof C, Gluth S, Bäckman L, Li SC, Lindenberger U, Heekeren HR. Cortical thickness is linked to executive functioning in adulthood and aging. Human Brain Mapping. 2012;33:1607–1620. doi: 10.1002/hbm.21311. [DOI] [PMC free article] [PubMed] [Google Scholar]
- Cardoso FL, Herz J, Fernandes A, Rocha J, Sepodes B, Brito MA, McGavern DB, Brites D. Systemic inflammation in early neonatal mice induces transient and lasting neurodegenerative effects. Journal of Neuroinflammation. 2015;12:82. doi: 10.1186/s12974-015-0299-3. [DOI] [PMC free article] [PubMed] [Google Scholar]
- Chuang YF, Tanaka T, Beason-Held LL, An Y, Terracciano A, Sutin AR, Kraut M, Singleton AB, Resnick SM, Thambisetty M. FTO genotype and aging: pleiotropic longitudinal effects on adiposity, brain function, impulsivity and diet. Molecular Psychiatry. 2015;20:133–139. doi: 10.1038/mp.2014.49. [DOI] [PMC free article] [PubMed] [Google Scholar]
- Clarke TK, Hall LS, Fernandez-Pujals AM, MacIntyre DJ, Thomson P, Hayward C, Smith BH, Padmanabhan S, Hocking LJ, Deary IJ, Porteous DJ, McIntosh AM. Major depressive disorder and current psychological distress moderate the effect of polygenic risk for obesity on body mass index. Translational Psychiatry. 2015;5:e592. doi: 10.1038/tp.2015.83. [DOI] [PMC free article] [PubMed] [Google Scholar]
- Curran JE, McKay DR, Winkler AM, Olvera RL, Carless MA, Dyer TD, Kent JW, Jr, Kochunov P, Sprooten E, Knowles EE, Comuzzie AG, Fox PT, Almasy L, Duggirala R, Blangero J, Glahn DC. Identification of pleiotropic genetic effects on obesity and brain anatomy. Human Heredity. 2013;75:136–143. doi: 10.1159/000353953. [DOI] [PMC free article] [PubMed] [Google Scholar]
- Dennis EL, Jahanshad N, Braskie MN, Warstadt NM, Hibar DP, Kohannim O, Nir TM, McMahon KL, de Zubicaray GI, Montgomery GW, Martin NG, Toga AW, Wright MJ, Thompson PM. Obesity gene NEGR1 associated with white matter integrity in healthy young adults. NeuroImage. 2014;102:548–557. doi: 10.1016/j.neuroimage.2014.07.041. [DOI] [PMC free article] [PubMed] [Google Scholar]
- Dudbridge F. Power and predictive accuracy of polygenic risk scores. PLoS Genetics. 2013;9:e1003348. doi: 10.1371/journal.pgen.1003348. [DOI] [PMC free article] [PubMed] [Google Scholar]
- Grundy SM, Cleeman JI, Daniels SR, Donato KA, Eckel RH, Franklin BA, Gordon DJ, Krauss RM, Savage PJ, Smith SC, Jr, Spertus JA, Costa F. Diagnosis and management of the metabolic syndrome: an American Heart Association/National Heart, Lung, and Blood Institute scientific statement: Executive Summary. Critical Pathways in Cardiology. 2005;4:198–203. doi: 10.1097/00132577-200512000-00018. [DOI] [PubMed] [Google Scholar]
- Gustafson D, Lissner L, Bengtsson C, Björkelund C, Skoog I. A 24-year follow-up of body mass index and cerebral atrophy. Neurology. 2004;63:1876–1881. doi: 10.1212/01.wnl.0000141850.47773.5f. [DOI] [PubMed] [Google Scholar]
- Hagler DJ, Jr, Saygin AP, Sereno MI. Smoothing and cluster thresholding for cortical surface-based group analysis of fMRI data. NeuroImage. 2006;33:1093–1103. doi: 10.1016/j.neuroimage.2006.07.036. [DOI] [PMC free article] [PubMed] [Google Scholar]
- Hall KS, Hoerster KD, Yancy WS., Jr Post-traumatic stress disorder, physical activity, and eating behaviors. Epidemiologic Reviews. 2015;37:103–115. doi: 10.1093/epirev/mxu011. [DOI] [PubMed] [Google Scholar]
- Howie B, Fuchsberger C, Stephens M, Marchini J, Abecasis GR. Fast and accurate genotype imputation in genome-wide association studies through pre-phasing. Nature Genetics. 2012;44:955–959. doi: 10.1038/ng.2354. [DOI] [PMC free article] [PubMed] [Google Scholar]
- Kikinis Z, Fallon JH, Niznikiewicz M, Nestor P, Davidson C, Bobrow L, Pelavin PE, Fischl B, Yendiki A, McCarley RW, Kikinis R, Kubicki M, Shenton ME. Gray matter volume reduction in rostral middle frontal gyrus in patient with chronic schizophrenia. Schizophrenia Research. 2010;123:153–159. doi: 10.1016/j.schres.2010.07.027. [DOI] [PMC free article] [PubMed] [Google Scholar]
- Koren D, Dumin M, Gozal D. Role of sleep quality in the metabolic syndrome. Diabetes, Metabolic Syndrome and Obesity: targets and Therapy. 2016;9:281–310. doi: 10.2147/DMSO.S95120. [DOI] [PMC free article] [PubMed] [Google Scholar]
- Kraja AT, Vaidya D, Pankow JS, Goodarzi MO, Assimes TL, Kullo IJ, Sovio U, Mathias RA, Sun YV, Franceschini N, Absher D, Li G, Zhang Q, Feitosa MF, Glazer NL, Haritunians T, Hartikainen AL, Knowles JW, North KE, Iribarren C, Kral B, Yanek L, O’Reilly PF, McCarthy MI, Jaquish C, Couper DJ, Chakravarti A, Psaty BM, Becker LC, Province MA, Boerwinkle E, Quertermous T, Palotie L, Jarvelin MR, Becker DM, Kardia SL, Rotter JI, Chen YD, Borecki IB. A bivariate genome-wide approach to metabolic syndrome: STAMPEED consortium. Diabetes. 2011;60:1329–1339. doi: 10.2337/db10-1011. [DOI] [PMC free article] [PubMed] [Google Scholar]
- Kraemer HC. Determining gene moderation of environmental risk factors for a mental disorder: a “perfect storm” of methodological problems. International Journal of Methods in Psychiatric Research. 2012;21:185–194. doi: 10.1002/mpr.1360. [DOI] [PMC free article] [PubMed] [Google Scholar]
- Krystal JH, Pietrzak RH, Rosenheck RA, Cramer JA, Vessicchio J, Jones KM, Huang GD, Vertrees JE, Collins J, Krystal AD Veterans Affairs Cooperative Study #504 Group. Sleep disturbance in chronic military-related PTSD: clinical impact and response to adjunctive risperidone in the Veterans Affairs cooperative study #504. Journal of Clinical Psychiatry. 2016;77:483–491. doi: 10.4088/JCP.14m09585. [DOI] [PubMed] [Google Scholar]
- Kubany ES, Haynes SN, Leisen MB, Owens JA, Kaplan AS, Watson SB, Burns K. Development and preliminary validation of a brief broad-spectrum measure of trauma exposure: the Traumatic Life Events Questionnaire. Psychological Assessment. 2000;12:210–224. doi: 10.1037//1040-3590.12.2.210. [DOI] [PubMed] [Google Scholar]
- Lango Allen H, Estrada K, Lettre G, Berndt SI, Weedon MN, Rivadeneira F, Willer CJ, Jackson AU, Vedantam S, Raychaudhuri S, Ferreira T, Wood AR, Weyant RJ, Segrè AV, Speliotes EK, Wheeler E, et al. Hundreds of variants clustered in genomic loci and biological pathways affect human height. Nature. 2010;467:832–838. doi: 10.1038/nature09410. [DOI] [PMC free article] [PubMed] [Google Scholar]
- Lavagnino L, Arnone D, Cao B, Soares JC, Selvaraj S. Inhibitory control in obesity and binge eating disorder: a systematic review and meta-analysis of neurocognitive and neuroimaging studies. Neuroscience and Biobehavioral Reviews. 2016;68:714–726. doi: 10.1016/j.neubiorev.2016.06.041. [DOI] [PubMed] [Google Scholar]
- Levine AB, Levine LM, Levine TB. Posttraumatic stress disorder and cardiometabolic disease. Cardiology. 2014;127:1–19. doi: 10.1159/000354910. [DOI] [PubMed] [Google Scholar]
- Man S, Ubogu EE, Ransohoff RM. Inflammatory cell migration into the central nervous system: a few new twists on an old tale. Brain Pathology (Zurich, Switzerland) 2007;17:243–250. doi: 10.1111/j.1750-3639.2007.00067.x. [DOI] [PMC free article] [PubMed] [Google Scholar]
- Maes HH, Neale MC, Eaves LJ. Genetic and environmental factors in relative body weight and human adiposity. Behavior Genetics. 1997;27:325–351. doi: 10.1023/a:1025635913927. [DOI] [PubMed] [Google Scholar]
- Marqués-Iturria I, Garolera M, Pueyo R, Segura B, Hernan I, García-García I, Sánchez-Garre C, Vernet-Vernet M, Sender-Palacios MJ, Narberhaus A, Ariza M, Junqué C, Jurado MÁ. The interaction effect between BDNF val66met polymorphism and obesity on executive functions and frontal structure. American Journal of Medical Genetics. 2014;165B:245–253. doi: 10.1002/ajmg.b.32229. [DOI] [PubMed] [Google Scholar]
- Mauro C, De Rosa V, Marelli-Berg F, Solito E. Metabolic syndrome and the immunological affair with the blood-brain barrier. Frontiers in Immunology. 2015;5:677. doi: 10.3389/fimmu.2014.00677. [DOI] [PMC free article] [PubMed] [Google Scholar]
- Miller MW, Sadeh N. Traumatic stress, oxidative stress and post-traumatic stress disorder: Neurodegeneration and the accelerated-aging hypothesis. Molecular Psychiatry. 2014;19:1156–1162. doi: 10.1038/mp.2014.111. [DOI] [PMC free article] [PubMed] [Google Scholar]
- Mirhafez SR, Ebrahimi M, Saberi Karimian M, Avan A, Tayefi M, Heidari-Bakavoli A, Parizadeh MR, Moohebati M, Azarpazhooh MR, Esmaily H, Nematy M, Safarian M, Ferns GA, Ghayour-Mobarhan M. Serum high-sensitivity C-reactive protein as a biomarker in patients with metabolic syndrome: evidence-based study with 7284 subjects. European Journal of Clinical Nutrition. 2016;70:1298–1304. doi: 10.1038/ejcn.2016.111. [DOI] [PubMed] [Google Scholar]
- National Cholesterol Education Program (NCEP) Executive summary of the third report of the National Cholesterol Education Program (NCEP) expert panel on detection, evaluation, and treatment of high blood cholesterol in adults (Adult Treatment Panel III) JAMA. 2001;285:2486–2497. doi: 10.1001/jama.285.19.2486. [DOI] [PubMed] [Google Scholar]
- Passos IC, Vasconcelos-Moreno MP, Costa LG, Kunz M, Brietzke E, Quevedo J, Salum G, Magalhães PV, Kapczinski F, Kauer-Sant’Anna M. Inflammatory markers in post-traumatic stress disorder: a systematic review, meta-analysis, and meta-regression. The Lancet Psychiatry. 2015;2:1002–1012. doi: 10.1016/S2215-0366(15)00309-0. [DOI] [PubMed] [Google Scholar]
- Price AL, Patterson NJ, Plenge RM, Weinblatt ME, Shadick NA, Reich D. Principal components analysis corrects for stratification in genome-wide association studies. Nature Genetics. 2006;38:904–909. doi: 10.1038/ng1847. [DOI] [PubMed] [Google Scholar]
- Purcell S, Neale B, Todd-Brown K, Thomas L, Ferreira MA, Bender D, Maller J, Sklar P, de Bakker PI, Daly MJ, Sham PC. PLINK: a tool set for whole-genome association and population-based linkage analyses. American Journal of Human Genetics. 2007;81:559–575. doi: 10.1086/519795. [DOI] [PMC free article] [PubMed] [Google Scholar]
- Purcell SM, Wray NR, Stone JL, Visscher PM, O’Donovan MC, Sullivan PF, Sklar P International Schizophrenia Consortium. Common polygenic variation contributes to risk of schizophrenia and bipolar disorder. Nature. 2009;460:748–752. doi: 10.1038/nature08185. [DOI] [PMC free article] [PubMed] [Google Scholar]
- Rosenbaum S, Sherrington C, Tiedemann A. Exercise augmentation compared with usual care for post-traumatic stress disorder: a randomized controlled trial. Acta Psychiatrica Scandinavica. 2015a;131:350–359. doi: 10.1111/acps.12371. [DOI] [PubMed] [Google Scholar]
- Rosenbaum S, Stubbs B, Ward PB, Steel Z, Lederman O, Vancampfort D. The prevalence and risk of metabolic syndrome and its components among people with posttraumatic stress disorder: a systematic review and meta-analysis. Metabolism. 2015b;64:926–933. doi: 10.1016/j.metabol.2015.04.009. [DOI] [PubMed] [Google Scholar]
- Sadeh N, Spielberg JM, Logue MW, Wolf EJ, Smith AK, Lusk J, Hayes JP, Sperbeck E, Milberg WP, McGlinchey RE, Salat DH, Carter WC, Stone A, Schichman SA, Humphries DE, Miller MW. SKA2 methylation is associated with decreased prefrontal cortical thickness and greater PTSD severity among trauma-exposed veterans. Molecular Psychiatry. 2016;21:357–363. doi: 10.1038/mp.2015.134. [DOI] [PMC free article] [PubMed] [Google Scholar]
- Ségonne F, Dale AM, Busa E, Glessner M, Salat D, Hahn HK, Fischl B. A hybrid approach to the skull stripping problem in MRI. Neuroimage. 2004;22:1060–1075. doi: 10.1016/j.neuroimage.2004.03.032. [DOI] [PubMed] [Google Scholar]
- Silventoinen K, Jelenkovic A, Sund R, Hur YM, Yokoyama Y, Honda C, Hjelmborg J, Möller S, Ooki S, Aaltonen S, Ji F. Genetics and environmental effects on body mass index from infancy to the onset of adulthood: An individual-based pooled analysis of 45 twin cohorts participating in the COllaborative project of Development of Anthropometrical measures in Twins (CODATwins) study. The American Journal of Clinical Nutrition. 2016;104:371–379. doi: 10.3945/ajcn.116.130252. [DOI] [PMC free article] [PubMed] [Google Scholar]
- Song SW, Chung JH, Rho JS, Lee YA, Lim HK, Kang SG, Kim HN, Kim JE, Kim SH. Regional cortical thickness and subcortical volume changes in patients with metabolic syndrome. Brain imaging and Behavior. 2015;9:588–596. doi: 10.1007/s11682-014-9311-2. [DOI] [PubMed] [Google Scholar]
- Speliotes EK, Willer CJ, Berndt SI, Monda KL, Thorleifsson G, Jackson AU, Lango Allen H, Lindgren CM, Luan J, Mägi R, Randall JC, Vedantam S, Winkler TW, Qi L, Workalemahu T, Heid IM, Steinthorsdottir V, et al. Association analyses of 249,796 individual reveal 18 new loci associated with body mass index. Nature Genetics. 2010;42:937–948. doi: 10.1038/ng.686. [DOI] [PMC free article] [PubMed] [Google Scholar]
- Spieker EA, Kochunov P, Rowland LM, Sprooten E, Winkler AM, Olvera RL, Almasy L, Duggirala R, Fox PT, Blangero J, Glahn DC, Curran JE. Shared genetic variance between obesity and white matter integrity in Mexican Americans. Frontiers in Genetics. 2015;6:26. doi: 10.3389/fgene.2015.00026. [DOI] [PMC free article] [PubMed] [Google Scholar]
- Sumner JA, Duncan LE, Wolf EJ, Amstadter AB, Baker DG, Beckham JC, Gelaye B, Hemmings S, Kimbrel NA, Logue MW, Michopoulos V, Mitchell KS, Nievergelt C, Rothbaum A, Seedat S, Shinozaki G, Vermetten E. Letter to the Editor: Posttraumatic stress disorder has genetic overlap with cardiometabolic traits. Psychological Medicine. 2017:1–4. doi: 10.1017/S0033291717000733. epub ahead of print. [DOI] [PMC free article] [PubMed] [Google Scholar]
- 1000 Genomes Project Consortium. Abecasis GR, Auton A, Brooks LD, DePristo MA, Durbin RM, Handsaker RE, Kang HM, Marth GT, McVean GA. An integrated map of genetic variation from 1,092 human genomes. Nature. 2012;491:56–65. doi: 10.1038/nature11632. [DOI] [PMC free article] [PubMed] [Google Scholar]
- Vancampfort D, Stubbs B, Mitchell AJ, De Hert M, Wampers M, Ward PB, Rosenbaum S, Correll CU. Risk of metabolic syndrome and its components in people with schizophrenia and related psychotic disorders, bipolar disorder and major depressive disorder: a systematic review and meta-analysis. World Psychiatry. 2015;14:339–347. doi: 10.1002/wps.20252. [DOI] [PMC free article] [PubMed] [Google Scholar]
- Williams VJ, Hayes JP, Forman DE, Salat DH, Sperling RA, Verfaellie M, Hayes SM. Cardiorespiratory fitness is differentially associated with cortical thickness in young and older adults. Neuroimage. 2017;146:1084–1092. doi: 10.1016/j.neuroimage.2016.10.033. [DOI] [PMC free article] [PubMed] [Google Scholar]
- Wilson PW, D’Agostino RB, Parise H, Sullivan L, Meigs JB. Metabolic syndrome as a precursor of cardiovascular disease and type 2 diabetes mellitus. Circulation. 2005;112:3066–3072. doi: 10.1161/CIRCULATIONAHA.105.539528. [DOI] [PubMed] [Google Scholar]
- Wolf EJ, Bovin MJ, Green JD, Mitchell KS, Stoop TB, Barretto KM, Jackson CE, Lee LO, Fang SC, Trachtenberg F, Rosen RC, Keane TM, Marx BP. Longitudinal associations between post-traumatic stress disorder and metabolic syndrome severity. Psychological Medicine. 2016a;46:2215–2226. doi: 10.1017/S0033291716000817. [DOI] [PMC free article] [PubMed] [Google Scholar]
- Wolf EJ, Logue MW, Hayes JP, Sadeh N, Schichman SA, Stone A, Salat DH, Milberg W, McGlinchey R, Miller MW. Accelerated DNA methylation age: associations with PTSD and neural integrity. Psychoneuroendocrinology. 2016b;63:155–162. doi: 10.1016/j.psyneuen.2015.09.020. [DOI] [PMC free article] [PubMed] [Google Scholar]
- Wolf EJ, Sadeh N, Leritz EC, Logue MW, Stoop TB, McGlinchey R, Milberg W, Miller MW. Posttraumatic stress disorder as a catalyst for the association between metabolic syndrome and reduced cortical thickness. Biological Psychiatry. 2016c;80:363–371. doi: 10.1016/j.biopsych.2015.11.023. [DOI] [PMC free article] [PubMed] [Google Scholar]
Associated Data
This section collects any data citations, data availability statements, or supplementary materials included in this article.