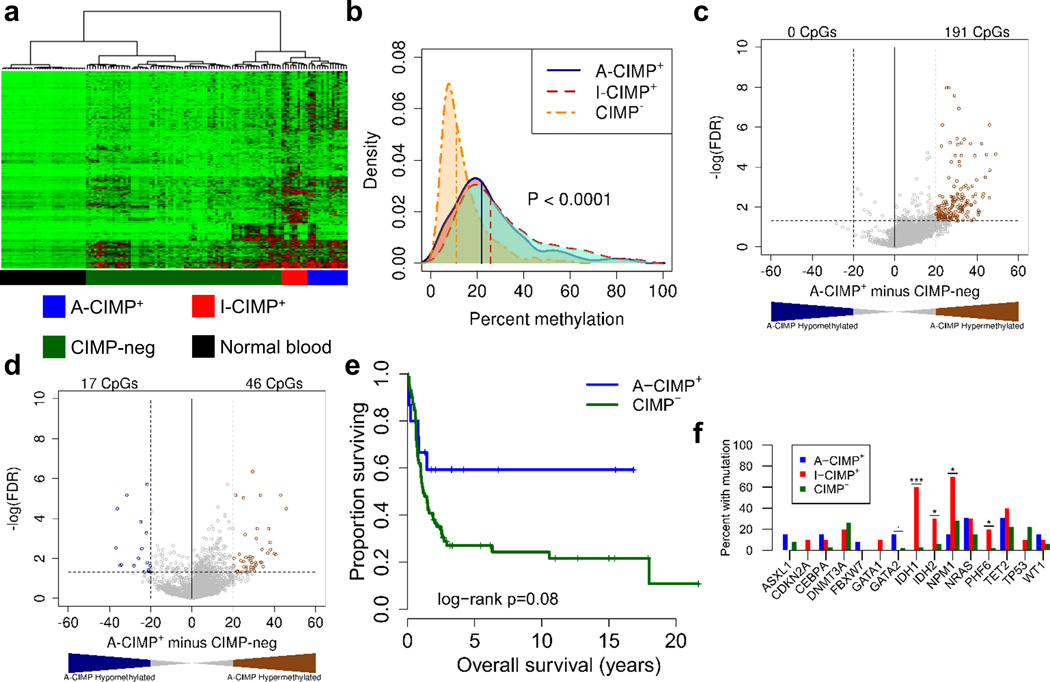
Figure 2. DREAM analysis identifies A-CIMP in AML.
a) Hierarchical clustering of 96 AML patient samples and 32 normal blood controls on quantitative DNA methylation levels. b) The distribution of methylation values across all 1,210 selected CpG sites from Figure 2a were stratified by cluster. Vertical lines correspond to the median of average methylation values across all CpG sites for each respective cluster. P-value was computed using the non-parametric Kruskal-Wallis test. c, d) Volcano plot differential methylation analysis comparing A-CIMP+ to CIMP− AML for CGI sites (c), and non-CGI sites (d). e) Kaplan-Meier survival analysis of A-CIMP+ compared to CIMP− AML. f) Genetic mutations associated with A-CIMP, and I-CIMP. * P < 0.05, ** P < 0.01, *** P < 0.001.

