

Abstract
AIM
To investigate the relationship between non-alcoholic fatty liver disease (NAFLD) and colorectal adenomatous and hyperplastic polyps.
METHODS
A retrospective cross-sectional study was conducted on 3686 individuals undergoing health checkups (2430 males and 1256 females). All subjects underwent laboratory testing, abdominal ultrasonography, colonoscopy, and an interview to ascertain the baseline characteristics and general state of health. Multinomial logistic regression analysis was performed to examine the association between NAFLD and the prevalence of colorectal adenomatous and hyperplastic polyps. Furthermore, the relationship was analyzed in different sex groups. Subgroup analysis was performed based on number, size, and location of colorectal polyps.
RESULTS
The prevalence of colorectal polyps was 38.8% in males (16.2% for adenomatous polyps and 9.8% for hyperplastic polyps) and 19.3% in females (8.4% for adenomatous polyps and 3.9% for hyperplastic polyps). When adjusting for confounding variables, NAFLD was significantly associated with the prevalence of adenomatous polyps (OR = 1.28, 95%CI: 1.05-1.51, P < 0.05) and hyperplastic polyps (OR = 1.35, 95%CI: 1.01-1.82, P < 0.05). However, upon analyzing adenomatous and hyperplastic polyps in different sex groups, the significant association remained in males (OR = 1.53, 95%CI: 1.18-2.00, P < 0.05; OR = 1.42, 95%CI: 1.04-1.95, P < 0.05) but not in females (OR = 0.44, 95%CI: 0.18-1.04, P > 0.05; OR = 1.18, 95%CI: 0.50-2.78, P > 0.05).
CONCLUSION
NAFLD is specifically associated with an increased risk of colorectal adenomatous and hyperplastic polyps in men. However, NAFLD may not be a significant factor in the prevalence of colorectal polyps in women.
Keywords: Non-alcoholic fatty liver disease, Health-check, Adenomatous polyps, Hyperplastic polyps
Core tip: Non-alcoholic fatty liver disease (NAFLD) is associated with an increased risk of colorectal adenoma. The association of NAFLD and hyperplastic polyps remains unclear. We utilized 3686 individuals undergoing health checkups to analyze the relationship between NAFLD and colorectal adenomatous and hyperplastic polyps. NAFLD is associated with colorectal adenomatous and hyperplastic polyps in men but not in women.
INTRODUCTION
Colorectal adenomatous polyps and some subsets of hyperplastic polyps have been considered precursors of hereditary and sporadic colorectal cancer[1-5]. Currently, the incidence of colorectal polyps and colorectal cancer has been increasing over recent decades worldwide[6]. Identifying risk factors for colorectal cancer and performing colonoscopy and polypectomy are considered efficient surveillance programs to detect colorectal polyps and reduce malignant progression and mortality among the general population[7]. In a cross-sectional study of 343 patients who underwent colonoscopy, serum insulin levels as a metabolic factor were correlated with the prevalence of adenomatous (OR = 1.5, 95%CI: 1.1-2.0, P = 0.005) and hyperplastic polyps (OR = 1.3, 95%CI: 1.0-1.7, P = 0.075). In addition, some suggested that hyperplastic polyps could act as a marker for the future development of adenomas in the general population[8-11].
Non-alcoholic fatty liver disease (NAFLD), a metabolic disease of the liver, is well recognized as the most prevalent chronic liver disease worldwide, and its prevalence is dramatically increasing both in Asian and Western countries[12]. Patients with NAFLD present higher levels of insulin, insulin resistance status and chronic inflammation conditions[13-15]. Insulin and the insulin-like growth factor (IGF) axis play an important role in cell metabolism and growth. Insulin stimulates colorectal cell proliferation and increases bioactive IGF-1, which promotes cell cycle progression through mitogenic and antiapoptotic effects[16].
Recent studies suggested that NAFLD was associated with an increased risk for colorectal adenomas and advanced neoplasms[17-19]. Hwang et al[19] conducted an investigation of 2917 subjects divided into two groups (556 adenomatous polyps and 2361 polyp-free). They found that NAFLD was an independent risk factor for colorectal adenoma (OR = 1.28, 95%CI: 1.03-1.60, P = 0.029)[19]. However, this study ignored non-adenomas, such as hyperplastic polyps and inflammatory polyps, and investigated the association between NAFLD and non-adenomatous polyps. Limited data are available in the literature regarding the relationship between NAFLD and hyperplastic polyps. Given that insulin level was specifically associated with adenomatous and hyperplastic polyps and related to NAFLD, our aim was to explore the relationship between NAFLD and colorectal adenomatous and hyperplastic polyps.
In addition, Touzin et al[20] conducted a retrospective observational study to explore the relationship between biopsy-proven NAFLD and colorectal adenoma but failed to demonstrate that patients with biopsy-proven NAFLD had an increased incidence of colorectal adenoma. The association between NAFLD and colorectal polyps may be controversial. Furthermore, the prevalence of NAFLD (60.8% in males and 43.5% in females) and colorectal polyps (35.5% in males and 20.9% in females) was not consistent in different sex groups, and the prevalence is higher in males[21]. Several studies demonstrated a significant association between dyslipidemia and colon adenoma in men but not in women[22,23]. Therefore, our study further explored the link between NAFLD and colorectal adenomatous and hyperplastic polyps in different sex groups.
MATERIALS AND METHODS
Subjects
Study participants consisted of individuals who had a routine health checkup and colonoscopy at the Medical and Health Care Center of the First Affiliated Hospital of Wenzhou Medical University from September 2014 to November 2016. A standard questionnaire was administered to obtain relevant information from each participant, including smoking status (yes or no), alcohol consumption and medical history.
A total of 6035 participants were screened (Figure 1). In total, 2349 subjects were excluded based on the following reasons: incomplete colonoscopy, polypectomy, inflammatory bowel disease, carcinoma, liver cirrhosis, viral hepatitis, toxic and autoimmune liver diseases and excess alcohol consumption moderately (> 140 g/wk for men or > 70 g/wk for women). Thus, the final study population consisted of 3686 subjects (2430 males and 1256 females). Physical examination data were collected as part of a study, and formal ethical approval was not required[24].
Figure 1.
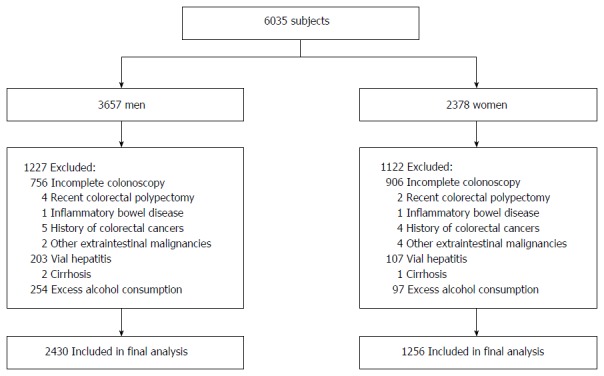
Inclusion and exclusion of study participants.
Anthrometric index and laboratory tests
Well-trained examiners measured the body weight (measured to the nearest 0.1 kg) with a balance scale and the height (measured to the nearest 0.1 cm) with a portable stadiometer of every individual dressed in light clothes and without shoes in the morning. Body mass index (BMI) was calculated by dividing weight in kilograms by the height squared. Blood pressure was measured in the right arm in a seated state after they had at least 15 min of rest with a standard automatic instrument (Omron, model 705 cp, Kyoto, Japan) and recorded as systolic blood pressure (SBP) and diastolic blood pressure (DBP).
Following an 8-h fast, blood samples were collected and analyzed from antecubital vein sampling. Biochemical markers, such as fasting plasma glucose (FPG), triglyceride (TG), total cholesterol (TC), high density lipoprotein-cholesterol (HDL-C), low density lipoprotein-cholesterol (LDL-C), alanine aminotransferase and aspartate aminotransferase, were subsequently analyzed with an automated analyzer (Abbott AxSYM, Park, IL).
Colonoscopy
Following full bowel preparation, colonoscopy (OLYMPUS, Tokyo, Japan) was performed in all participants by experienced gastroenterologists using a standard protocol identical for diagnostic colonoscopy[25]. Colonoscopic findings, including the type, location, size and number of polyps, were recorded. All polypectomy specimens were classified by experienced histopathologists. Based on the results of colorectal biopsies, individuals were divided into four groups: polyp-free group, adenomatous polyps group, hyperplastic polyps group and inflammatory polyps group. The location was stratified as following: (1) proximal lesions (polyps located in the cecum, ascending and transverse colon); (2) distal lesions (polyps located in the splenic flexure, descending sigmoid colon and rectum); and (3) bilateral lesions (polyps locating on both sides). The size of polyps was divided into two groups. Less than 10 mm was defined as small, whereas 10 mm or greater was defined as large. The number of polyps was also divided into two groups: single and multiple.
Diagnostic criteria
Abdominal ultrasonography was performed by professional radiologists to diagnose fatty liver. According to the four knowledgeable ultrasound criteria (liver brightness, deep attenuation, hepatorenal echo contrast and vascular blurring), subjects who met hepatorenal contrast and liver brightness were diagnosed with fatty liver disease[26]. NAFLD was diagnosed based on the guidelines for assessment and management of NAFLD in the Asia-Pacific region when fatty liver was present in the absence of the following: (1) viral hepatitis (hepatitis B or hepatitis C); (2) hepatic cirrhosis and liver carcinoma; (3) autoimmune liver disease or other liver disease; and (4) excess alcohol consumption (> 140 g/wk for men or > 70 g/wk for women)[27].
The definition of metabolic syndrome (MS) was based on the presence of three or more of the following China Diabetes Federation MS criteria: (1) central obesity: BMI ≥ 25 in both genders; (2) hypertension: SBP ≥ 140 mmHg or DBP ≥ 90 mmHg or previously diagnosed; (3) dyslipidemia: TG ≥ 1.7 mmol/L and/or HDL-C < 0.9 mmol/L in males and < 1.0 mmol/L in females; and (4) hyperglycemia: FPG ≥ 6.1 mmol/L or hyperglycemia previously diagnosed[28].
Statistical analysis
Statistical analyses were conducted using SPSS software (SPSS version 23.0 for Windows). Demographic data and other risk factors for colorectal polyps, adenomatous polyps and hyperplastic polyps are presented as the mean ± SD or percentages. One-way analysis of variance (ANOVA) or Kruskal-Wallis test for continuous variables and Pearson χ2 tests for categorical variables were used to compare the baseline of the study population according to the groups that had been classified as being polyp-free or having colorectal polyps, adenomatous polyps, and hyperplastic polyps. The associations between NAFLD and the prevalence of colorectal polyps, adenomatous polyps and hyperplastic polyps were analyzed by multinomial logistic regression after adjustment for independent variables, including NAFLD, age, smoking, alcohol and MS. In addition, polytomous logistic models were used for associations between NAFLD and multiple outcomes, such as number of polyps (single or multiple), size of polyps (small: < 1 cm or large: ≥ 1 cm) and location of polyps (proximal lesions, distal lesions and bilateral lesions), in the groups of adenomatous polyps and hyperplastic polyps. All models were adjusted for age, smoking, alcohol and MS as confounding variables. A two-side P value less than 0.05 was considered statistically significant, and each OR is presented together with its 95%CI.
RESULTS
Subject characteristics
The demographic and clinical characteristics of eligible subjects according to colonoscopic findings are presented in Table 1. Among 3686 subjects in our study, 1185 (32.1%) were diagnosed with colorectal polyps, including 498 (13.5%) with adenomatous polyps, 288 (7.8%) with hyperplastic polyps, and 399 (10.8%) with inflammatory polyps. Of the 2430 male subjects, 1487 (61.2%) were in the normal group, and 943 (38.8%) were in the colorectal polyps group, including 393 (16.2%) with adenomatous polyps and 239 (9.8%) with hyperplastic polyps (Table 2). Of the female subjects, 1014 (80.7%) were in the normal group, and 242 (19.3%) were in the colorectal polyps group, including 105 (8.4%) with adenomatous polyps and 49 (3.9%) with hyperplastic polyps. The prevalence of NAFLD in the colorectal polyps group, adenomatous polyps group, and hyperplastic polyps group were 268 (28.4%), 116 (29.5%), and 72 (30.1%) in males and 23 (9.5%), 6 (5.7%), and 7 (14.3%) in females, respectively. Overall, subjects without colorectal polyps had younger age, higher HDL-C, and reduced weight, BMI values, SBP, DBP, FPG, TG, TC, LDL-C, MS prevalence, smoking and alcohol use.
Table 1.
Demographic and clinical characteristics of the subjects according to colonoscopic findings n (%)
|
Colonoscopic findings of 3686 subjects |
|||||||
| Characteristic | Polyp-free | Colorectal polyps | P value vs Polyp-free | Adenomatous polyps | P value vs Polyp-free | Hyperplastic polyps | P value vs Polyp-free |
| 2501 (67.9) | 1185 (32.1) | 498 (13.5) | 288 (7.8) | ||||
| Male | 1487 (59.5) | 943 (79.6) | < 0.001 | 393 (83.0) | < 0.001 | 239 (77.9) | < 0.001 |
| Age (yr) | 45.47 ± 9.99 | 50.48 ± 9.96 | < 0.001 | 51.77 ± 9.78 | < 0.001 | 48.16 ± 9.09 | < 0.001 |
| Weight (kg) | 64.27 ± 11.29 | 68.33 ± 11.04 | < 0.001 | 67.58 ± 11.13 | < 0.001 | 69.57 ± 11.01 | < 0.001 |
| Height (cm) | 164.64 ± 7.71 | 166.59 ± 7.26 | < 0.001 | 165.95 ± 7.47 | 0.001 | 167.46 ± 7.01 | < 0.001 |
| BMI (kg/m2) | 23.62 ± 3.22 | 24.54 ± 3.10 | < 0.001 | 24.45 ± 3.10 | < 0.001 | 24.75 ± 3.13 | < 0.001 |
| SBP (mmHg) | 124.43 ± 17.78 | 129.99 ± 18.34 | < 0.001 | 130.57 ± 18.75 | < 0.001 | 127.72 ± 17.94 | 0.003 |
| DBP (mmHg) | 73.48 ± 12.27 | 76.96 ± 12.11 | < 0.001 | 77.19 ± 12.13 | < 0.001 | 76.72 ± 12.26 | < 0.001 |
| FPG (mmol/L) | 4.78 ± 1.13 | 5.01 ± 1.41 | < 0.001 | 4.99 ± 1.39 | 0.001 | 4.93 ± 1.36 | 0.032 |
| TG (mmol/L) | 1.79 ± 1.71 | 2.01 ± 1.81 | < 0.001 | 1.98 ± 2.04 | 0.032 | 2.05 ± 1.23 | 0.013 |
| TC (mmol/L) | 5.35 ± 1.12 | 5.44 ± 1.12 | 0.020 | 5.44 ± 1.21 | 0.093 | 5.53 ± 1.10 | 0.009 |
| HDL-C (mmol/L) | 1.32 ± 0.33 | 1.26 ± 0.30 | < 0.001 | 1.28 ± 0.31 | 0.003 | 1.24 ± 0.28 | < 0.001 |
| LDL-C (mmol/L) | 3.19 ± 0.86 | 3.27 ± 0.86 | 0.011 | 3.25 ± 0.84 | 0.154 | 3.36 ± 0.92 | 0.002 |
| ALT (IU/L) | 29.25 ± 29.65 | 32.23 ± 27.51 | 0.004 | 31.86 ± 22.61 | 0.065 | 32.85 ± 25.87 | 0.051 |
| AST (IU/L) | 27.24 ± 16.19 | 28.89 ± 17.63 | 0.007 | 28.75 ± 11.80 | 0.049 | 28.57 ± 13.43 | 0.184 |
| NAFLD | 488 (17.9) | 291 (24.6) | < 0.001 | 122 (27.4) | 0.002 | 79 (22.6) | 0.001 |
| MS | 246 (10.1) | 180 (15.6) | < 0.001 | 73 (15.5) | 0.005 | 44 (16.4) | 0.016 |
| Smoking | 662 (26.6) | 373 (31.7) | 0.002 | 151 (30.5) | 0.087 | 101 (35.2) | 0.004 |
| Alcohol | 854 (34.4) | 445 (37.8) | 0.042 | 191 (38.6) | 0.078 | 118 (41.1) | 0.028 |
BMI: Body mass index; SBP: Systolic blood pressure; DBP: Diastolic blood pressure; FPG: Fasting plasma glucose; TG: Triglyceride; TC: Total cholesterol; HDL-C: High density lipoprotein-cholesterol; LDL-C: Low density lipoprotein-cholesterol; ALT: Alanine aminotransferase; AST: Aspartate aminotransferase; NAFLD: Non-alcoholic fatty liver disease; MS: Metabolic syndrome.
Table 2.
Demographic and clinical characteristics of 2430 males and 1256 females according to colonoscopic findings n (%)
| Characteristic of males | Polyp-free | Colorectal polyps | P value vs Polyp-free | Adenomatous polyps | P value vs Polyp-free | Hyperplastic polyps | P value vs Polyp-free |
| Colonoscopic findings of 2430 males | |||||||
| 1487 (61.2) | 943 (38.8) | 393 (16.2) | 239 (9.8) | ||||
| Age (yr) | 44.61 ± 9.91 | 50.18 ± 9.67 | < 0.001 | 51.71 ± 9.54 | < 0.001 | 47.56 ± 8.90 | < 0.001 |
| Weight (kg) | 69.46 ± 10.18 | 70.88 ± 10.20 | 0.001 | 70.27 ± 10.12 | 0.164 | 71.47 ± 10.74 | 0.005 |
| Height (cm) | 169.13 ± 5.56 | 168.88 ± 5.80 | 0.305 | 168.28 ± 6.04 | 0.012 | 169.44 ± 5.72 | 0.427 |
| BMI (kg/m2) | 24.28 ± 3.22 | 24.81 ± 3.06 | < 0.001 | 24.77 ± 3.03 | 0.006 | 24.85 ± 3.22 | 0.011 |
| SBP (mmHg) | 127.29 ± 16.24 | 130.47 ± 17.83 | < 0.001 | 131.97 ± 18.29 | < 0.001 | 127.82 ± 16.88 | 0.639 |
| DBP (mmHg) | 76.44 ± 11.75 | 78.14 ± 12.03 | 0.001 | 78.77 ± 11.93 | 0.001 | 77.57 ± 12.11 | 0.173 |
| FPG (mmol/L) | 4.86 ± 1.26 | 5.06 ± 1.49 | 0.001 | 5.04 ± 1.46 | 0.012 | 4.96 ± 1.42 | 0.233 |
| TG (mmol/L) | 2.14 ± 2.04 | 2.15 ± 1.95 | 0.920 | 2.16 ± 2.24 | 0.878 | 2.14 ± 1.24 | 0.987 |
| TC (mmol/L) | 5.42 ± 1.16 | 5.42 ± 1.12 | 0.954 | 5.45 ± 1.24 | 0.686 | 5.49 ± 1.08 | 0.374 |
| HDL-C (mmol/L) | 1.22 ± 0.28 | 1.22 ± 0.29 | 0.892 | 1.24 ± 0.30 | 0.244 | 1.21 ± 0.27 | 0.597 |
| LDL-C (mmol/L) | 3.26 ± 0.86 | 3.26 ± 0.84 | 0.829 | 3.24 ± 0.83 | 0.632 | 3.34 ± 0.90 | 0.221 |
| ALT (IU/L) | 34.71 ± 33.63 | 35.31 ± 29.49 | 0.657 | 35.54 ± 23.59 | 0.649 | 35.2 ± 27.26 | 0.834 |
| AST (IU/L) | 29.00 ± 17.83 | 30.22 ± 19.06 | 0.115 | 30.37 ± 12.31 | 0.155 | 29.32 ± 13.41 | 0.796 |
| NAFLD | 355 (23.9) | 268 (28.4) | 0.014 | 116 (29.5) | 0.028 | 72 (30.1) | 0.038 |
| MS | 194 (13.3) | 156 (17.0) | 0.018 | 64 (15.8) | 0.123 | 37 (18.3) | 0.334 |
| Smoking | 465 (31.4) | 327 (34.9) | 0.076 | 127 (32.4) | 0.717 | 91 (38.2) | 0.045 |
| Alcohol | 577 (39.0) | 377 (40.3) | 0.536 | 153 (39.0) | 0.995 | 100 (42.0) | 0.379 |
| Colonoscopic findings of 1256 females | |||||||
| 1014 (80.7) | 242 (19.3) | 105 (8.4) | 49 (3.9) | ||||
| Age (yr) | 46.73 ± 9.97 | 51.68 ± 10.96 | < 0.001 | 51.99 ± 10.68 | < 0.001 | 51.10 ± 9.50 | 0.003 |
| Weight (kg) | 56.62 ± 8.03 | 58.41 ± 8.27 | 0.002 | 57.34 ± 8.61 | 0.385 | 60.42 ± 7.01 | 0.001 |
| Height (cm) | 158.04 ± 5.32 | 157.62 ± 5.16 | 0.268 | 157.08 ± 5.46 | 0.080 | 157.89 ± 4.21 | 0.840 |
| BMI (kg/m2) | 22.66 ± 2.96 | 23.50 ± 3.05 | < 0.001 | 23.21 ± 3.06 | 0.073 | 24.24 ± 2.66 | < 0.001 |
| SBP (mmHg) | 120.23 ± 19.07 | 128.13 ± 20.13 | < 0.001 | 125.21 ± 19.59 | 0.012 | 127.25 ± 22.56 | 0.013 |
| DBP (mmHg) | 69.12 ± 11.70 | 72.40 ± 11.31 | < 0.001 | 71.19 ± 11.03 | 0.086 | 72.63 ± 12.27 | 0.041 |
| FPG (mmol/L) | 4.66 ± 0.90 | 4.80 ± 0.99 | 0.037 | 4.80 ± 1.07 | 0.147 | 4.80 ± 1.06 | 0.318 |
| TG (mmol/L) | 1.27 ± 0.80 | 1.46 ± 0.92 | 0.002 | 1.30 ± 0.66 | 0.716 | 1.65 ± 1.11 | 0.002 |
| TC (mmol/L) | 5.25 ± 1.05 | 5.52 ± 1.10 | < 0.001 | 5.43 ± 1.09 | 0.088 | 5.72 ± 1.17 | 0.002 |
| HDL-C (mmol/L) | 1.48 ± 0.33 | 1.42 ± 0.31 | 0.008 | 1.43 ± 0.31 | 0.114 | 1.41 ± 0.28 | 0.123 |
| LDL-C (mmol/L) | 3.09 ± 0.85 | 3.33 ± 0.91 | < 0.001 | 3.30 ± 0.87 | 0.017 | 3.45 ± 1.00 | 0.004 |
| ALT (IU/L) | 21.15 ± 19.93 | 20.13 ± 11.46 | 0.451 | 17.74 ± 9.29 | 3.000 | 21.76 ± 13.28 | 0.835 |
| AST (IU/L) | 24.64 ± 12.98 | 23.71 ± 8.56 | 0.286 | 22.62 ± 6.73 | 0.121 | 25.00 ± 13.10 | 0.848 |
| NAFLD | 93 (9.2) | 23 (9.5) | 0.873 | 6 (5.7) | 0.160 | 7 (14.3) | 0.324 |
| MS | 52 (5.3) | 24 (10.2) | 0.021 | 9 (8.8) | 0.227 | 7 (14.3) | 0.084 |
| Smoking | 197 (19.6) | 46 (19.2) | 0.884 | 24 (23.3) | 0.369 | 10 (20.4) | 0.887 |
| Alcohol | 277 (27.5) | 68 (28.3) | 0.804 | 38 (36.9) | 0.063 | 18 (36.7) | 0.201 |
BMI: Body mass index; SBP: Systolic blood pressure; DBP: Diastolic blood pressure; FPG: Fasting plasma glucose; TG: Triglyceride; TC: Total cholesterol; HDL-C: High density lipoprotein-cholesterol; LDL-C: Low density lipoprotein-cholesterol; ALT: Alanine aminotransferase; AST: Aspartate aminotransferase; NAFLD: Non-alcoholic fatty liver disease; MS: Metabolic syndrome.
NAFLD is related to the prevalence of adenomatous polyps and hyperplastic polyps
The results of the multinomial logistic regression of risk factors for colorectal polyps, adenomatous polyps and hyperplastic polyps are presented in Table 3. In model A, compared with the polyp-free group, multinomial logistic regression demonstrated that subjects with NAFLD exhibited an increased prevalence of colorectal polyps (OR = 1.49, 95%CI: 1.26-1.76, P < 0.001), adenomatous polyps (OR = 1.49, 95%CI: 1.18-1.87, P < 0.05) and hyperplastic polyps (OR = 1.73, 95%CI: 1.31-2.29, P < 0.001) compared with subjects without NAFLD. In model C, the adjusted ORs for colorectal polyps (OR = 1.26, 95%CI: 1.05-1.51, P < 0.05), adenomatous polyps (OR = 1.28, 95%CI: 1.01-1.64, P < 0.05) and hyperplastic polyps (OR = 1.35, 95%CI: 1.01-1.82, P < 0.05) remained significantly increased in subjects with NAFLD.
Table 3.
Adjusted ORs and 95%CIs of clinical variables on the risk of colorectal polyps, adenomatous polyps and hyperplastic polyps based on multinomial logistic regression
| Polyps | Model A | Model B | Model C |
| OR (95%CI) | OR (95%CI) | OR (95%CI) | |
| Colorectal polyps | |||
| NAFLD | 1.49 (1.26-1.76)b | 1.28 (1.07-1.52)a | 1.26 (1.05-1.51)a |
| Gender | 2.81 (2.37-3.34)b | 2.76 (2.32-3.29)b | |
| Age | 1.06 (1.05-1.06)b | 1.06 (1.05-1.06)b | |
| Smoking | 1.15 (0.98-1.35) | 1.15 (0.97-1.38) | |
| Alcohol | 1.01 (0.86-1.20) | ||
| MS | 1.12 (0.90-1.40) | ||
| Adenomatous polyps | |||
| NAFLD | 1.49 (1.18-1.87)a | 1.29 (1.02-1.64)a | 1.28 (1.01-1.64)a |
| Gender | 2.83 (2.22-3.61)b | 2.78 (2.18-3.55)b | |
| Age | 1.07 (1.06-1.08)b | 1.07 (1.06-1.08)b | |
| Smoking | 1.09 (0.88-1.36) | 1.06 (0.84-1.35) | |
| Alcohol | 1.09 (0.87-1.37) | ||
| MS | 1.02 (0.76-1.38) | ||
| Hyperplastic polyps | |||
| NAFLD | 1.73 (1.31-2.29)b | 1.40 (1.05-1.86)a | 1.35 (1.01-1.82)a |
| Gender | 3.23 (2.33-4.47)b | 3.12 (2.25-4.33)b | |
| Age | 1.03 (1.02-1.05)b | 1.03 (1.02-1.05)b | |
| Smoking | 1.30 (1.00-1.70)a | 1.27 (0.95-1.70) | |
| Alcohol | 1.09 (0.82-1.44) | ||
| MS | 1.13 (0.79-1.63) | ||
Model A is univariate analysis; Model B is adjusted for gender, age and smoking; Model C is adjusted for gender, age, smoking, alcohol and MS.
P < 0.05;
P < 0.001. NAFLD: Non-alcoholic fatty liver disease; MS: Metabolic syndrome.
Does the association between NAFLD and colorectal polyps persist after sex analysis?
Multinomial logistic regression was performed to obtain a deeper understanding of the relationship between NAFLD and the prevalence of adenomatous polyps and hyperplastic polyps in males and females (Table 4). In model A, NAFLD was independently related to both adenomatous polyps (OR = 1.34, 95%CI: 1.04-1.71, P < 0.05) and hyperplastic polyps (OR = 1.38, 95%CI: 1.02-1.86, P < 0.05) in males, whereas no significant relationship was noted between NAFLD and colorectal polyps in females. After adjustment for age and smoking (model B), associations between NAFLD and adenomatous polyps (OR = 1.53, 95%CI: 1.19-1.98, P < 0.05) and hyperplastic polyps (OR = 1.44, 95%CI: 1.06-1.95, P < 0.05) were noted in males. In model C, after controlling for confounding factors, such as age, smoking, alcohol and MS, the associations between NAFLD and adenomatous polyps and hyperplastic polyps remained (OR = 1.53, 95%CI: 1.18-2.00, P < 0.05; OR = 1.42, 95%CI: 1.04-1.95, P < 0.05) statistically significant in males.
Table 4.
Adjusted odds ratios and 95%CIs of clinical variables on the risk of colorectal polyps, adenomatous polyps and hyperplastic polyps according to different-sex groups based on multinomial logistic regression
| Polyps |
Model A |
Model B |
Model C |
|||
| Male | Female | Male | Female | Male | Female | |
| OR (95%CI) | OR (95%CI) | OR (95%CI) | OR (95%CI) | OR (95%CI) | OR (95%CI) | |
| Colorectal polyps | ||||||
| NAFLD | 1.27 (1.05-1.52)a | 1.04 (0.64-1.68) | 1.41 (1.16-1.71)a | 0.80 (0.49-1.32) | 1.40 (1.14-1.71)a | 0.78 (0.47-1.28) |
| Age | 1.06 (1.05-1.07)b | 1.05 (1.03-1.06)b | 1.06 (1.05-1.07)b | 1.05 (1.03-1.06)b | ||
| Smoking | 1.22 (1.02-1.46)a | 0.95 (0.66-1.36) | 1.23 (1.02-1.50)a | 0.88 (0.57-1.36) | ||
| Alcohol | 0.98 (0.81-1.19) | 1.19 (0.81-1.74) | ||||
| MS | 1.07 (0.84-1.37) | 1.37 (0.80-2.34) | ||||
| Adenomatous polyps | ||||||
| NAFLD | 1.34 (1.04-1.71)a | 0.60 (0.26-1.41) | 1.53 (1.19-1.98)a | 0.45 (0.19-1.07) | 1.53 (1.18-2.00)a | 0.44 (0.18-1.04) |
| Age | 1.08 (1.06-1.09)b | 1.05 (1.03-1.07)b | 1.08 (1.06-1.09)b | 1.05 (1.03-1.07)b | ||
| Smoking | 1.10 (0.86-1.40) | 1.24 (0.76-2.02) | 1.12 (0.85-1.46) | 0.90 (0.50-1.61) | ||
| Alcohol | 0.97 (0.75-1.25) | 1.77 (1.06-2.96)a | ||||
| MS | 0.98 (0.71-1.36) | 1.17 (0.53-2.56) | ||||
| Hyperplastic polyps | ||||||
| NAFLD | 1.38 (1.02-1.86)a | 1.65 (0.72-3.78) | 1.44 (1.06-1.95)a | 1.30 (0.56-3.03) | 1.42 (1.04-1.95)a | 1.18 (0.50-2.78) |
| Age | 1.04 (1.02-1.05)b | 1.04 (1.01-1.07)a | 1.04 (1.02-1.05)b | 1.04 (1.01-1.07)a | ||
| Smoking | 1.38 (1.03-1.83)a | 1.01 (0.49-2.06) | 1.38 (1.01-1.88)a | 0.71 (0.31-1.65) | ||
| Alcohol | 1.01 (0.74-1.36) | 1.85 (0.92-3.72) | ||||
| MS | 1.02 (0.69-1.52) | 2.01 (0.81-4.94) | ||||
Model A is univariate analysis; Model B is adjusted for age and smoking; Model C is adjusted for age, smoking, alcohol and MS.
P < 0.05,
P < 0.001. NAFLD: Non-alcoholic fatty liver disease; MS: Metabolic syndrome.
Stratified analysis
The stratified analysis performed according to the number, size and location of adenomatous polyps and hyperplastic polyps is presented in Table 5. In the adenomatous polyps group, compared with non-NAFLD and adjusted for age, smoking, alcohol and MS, NAFLD was associated with multiple adenomas (OR = 1.82, 95%CI: 1.29-2.55, P = 0.001), distal adenoma (OR = 1.63, 95%CI: 1.11-2.39, P = 0.013), and bilateral adenoma (OR = 1.89, 95%CI: 1.23-2.91, P = 0.004). The OR for large adenoma (OR = 2.13, 95%CI: 1.21-3.76, P = 0.009) increased by approximately 1.5-fold compared with small adenoma (OR = 1.44, 95%CI: 1.08-1.91, P = 0.013). In addition, the associations between NAFLD and the prevalence of single (OR = 1.81, 95%CI: 1.19-2.74, P = 0.005), small (OR = 1.45, 95%CI: 1.05-2.00, P = 0.023) and proximal (OR = 2.62, 95%CI: 1.32-5.17, P = 0.006) hyperplastic polyps were noticeably stronger.
Table 5.
Adjusted odds ratios and 95%CIs of non-alcoholic fatty liver disease for adenomatous polyps and hyperplastic polyps of the colon and rectum by morphological characteristics in males
|
Adenomatous polyps |
P value |
Hyperplastic polyps |
P value | |||
| Cases | OR (95%CI) | Cases | OR (95%CI) | |||
| Number | ||||||
| Single | 186 | 1.27 (0.88-1.82) | 0.205 | 117 | 1.81 (1.19-2.74) | 0.005 |
| Multiple | 207 | 1.82 (1.29-2.55) | 0.001 | 121 | 1.13 (0.73-1.76) | 0.583 |
| Size | ||||||
| Small (< 1 cm) | 332 | 1.44 (1.08-1.91) | 0.013 | 229 | 1.45 (1.05-2.00) | 0.023 |
| Large (≥ 1 cm) | 61 | 2.13 (1.21-3.76) | 0.009 | 9 | 1.00 (0.20-5.07) | 0.999 |
| Location | ||||||
| Proximal lesions | 129 | 1.15 (0.73-1.80) | 0.539 | 38 | 2.62 (1.32-5.17) | 0.006 |
| Distal lesions | 146 | 1.63 (1.11-2.39) | 0.013 | 156 | 1.33 (0.91-1.95) | 0.146 |
| Bilateral lesions | 118 | 1.89 (1.23-2.91) | 0.004 | 44 | 1.05 (0.51-2.17) | 0.894 |
ORs compared with non-alcoholic fatty liver disease and adjusted for age, smoking, alcohol and metabolic syndrome.
DISCUSSION
Our study presented that individuals with NAFLD exhibited an increased prevalence of colorectal adenomatous polyps compared with individuals without NAFLD, which is consistent with previous reports[19,21]. This study also showed that NAFLD is a risk factor for the increased prevalence of hyperplastic polyps. Therefore, this is the first study performed to explore an association between ultrasound-diagnosed NAFLD and colorectal adenomatous and hyperplastic polyps.
In our study, for the entire enrolled population, NAFLD is a risk factor for the prevalence of adenomatous polyps (OR = 1.28) and hyperplastic polyps (OR = 1.35). To analyze whether sex influences the association of NAFLD with adenomatous and hyperplastic polyps, we presented data classified according to sex and demonstrated that NAFLD is a risk factor for adenomatous (OR = 1.53) and hyperplastic polyps (OR = 1.42) in males after considering confounding variables, such as age, smoking, alcohol and MS. In contrast, no association was noted between NAFLD and adenomatous and hyperplastic polyps in females. In the adenomatous polyps group, individuals with NAFLD had an increased risk of multiple, including small and large, distal and bilateral polyps. Furthermore, the association between NAFLD and hyperplastic polyps was more prominent for the risk of single, small and proximal hyperplastic polyps. Our results may explain why Touzin et al[20] failed to demonstrate that patients with biopsy-proven NAFLD had an increased incidence of colorectal adenoma, with only 233 (48% in females) patients enrolled.
The significant association between NAFLD and colorectal adenomatous polyps has been recognized by several researchers. Hwang et al[19] conducted a cross-sectional study and demonstrated that NAFLD is an independent risk factor for the prevalence of colorectal adenoma and particularly associated with an increased risk for multiple adenomas. Furthermore, Stadlmayr et al[21] examined 1200 patients via screening colonoscopy and identified an increased prevalence of colorectal adenomas and early colorectal cancer in patients with NAFLD compared with those without NAFLD. This study also reported that the prevalence rate of colorectal adenomas was obviously increased in males with NAFLD compared with females with NAFLD. In addition, Wong et al[29] conducted a cross-sectional study of 433 subjects, including 135 with biopsy-proven NAFLD, and demonstrated that patients with NAFLD exhibited an increased prevalence of adenomas (34.7% vs 21.5%, P = 0.043). Among biopsy-proven NAFLD patients, patients with non-alcoholic steatohepatitis exhibited an increased prevalence of adenomas (51.0% vs 25.6%, P = 0.005).
Currently, the mechanisms responsible for the relationship between NAFLD and colorectal adenomas have not been clearly understood. The potential mechanisms for how NAFLD promotes the development of colorectal adenomas include insulin resistance and chronic inflammation[30,31]. Insulin and IGF may facilitate the development of colorectal adenoma through their antiapoptotic and proliferative effects[31]. It is generally accepted that adipocytokine metabolism disorders, which influence the development of colorectal neoplasms, exist in NAFLD individuals[32,33]. In addition, as an adipocyte-secreted factor, monocyte chemotactic protein-1 attracts macrophages and causes local inflammatory response and the release of other cytokines[34]. Furthermore, inflammatory cytokines, such as interleukin-6, tumor necrosis factor-alpha and adiponectin, play an important role in the development of colorectal adenomas in NAFLD patients. The levels of interleukin-6 and tumor necrosis factor-alpha, as carcinogens and growth-promoting factors, are increasing. In contrast, the levels of adiponectin, a protective factor, are reduced with NAFLD[35].
Although hyperplastic polyps have been regarded as non-neoplastic polyps lacking malignant potential, recent studies provided some evidence of the presence of molecular changes consistent with neoplasia, including ras mutations, hypomethylation of the c-myc gene and high levels of microsatellite instability[36-41]. Furthermore, Huang et al[11] conducted a retrospective cohort study using the records of a single surgeon’s colonoscopic experience over a 20-year period and found that patients with hyperplastic polyps on initial colonoscopic examination may have twice the risk of adenomas on follow-up colonoscopy compared with those with clean initial examination. Hyman et al[42] found that 7 (54%) of 13 patients with hyperplastic polyposis developed colorectal cancer during their study period and suggested that patients with hyperplastic polyposis are at high risk for colorectal cancer. A cross-sectional study suggested that higher serum insulin levels were associated with an increased risk of proximal colon adenomatous and hyperplastic polyps[8]. An experimental study reported that hyperinsulinemia was associated with high susceptibility to colonic carcinogenesis induced by DNA methylation in animals[43]. Furthermore, the roles of insulin resistance and hyperinsulinemia in NAFLD are well recognized[44,45]. Given the link between NAFLD and hyperinsulinemia and the link between hyperinsulinemia and hyperplastic polyps, our study clearly demonstrated that NAFLD was associated with hyperplastic polyps.
Some studies demonstrated that the association of dyslipidemia and colon adenoma existed in different sex groups. Kim et al[23] supported that the risk of adenoma increased significantly by 2-fold when TC ≥ 150 mg/dL or HDL-C < 40 mg/dL in males. In contrast, no association was noted between adenoma prevalence and dyslipidemia in females. In addition, Liu et al[22] declared that dyslipidemia and large waist, as a component of MS, exhibited an association with colon adenoma in males but not in females. As a metabolic disease, NAFLD is closely correlated with dyslipidemia. The relationship between NAFLD and colorectal polyps may not be consistent in different sex groups.
Our study had several limitations that should be acknowledged. First, potential selection bias might exist based on general health check-ups, and data, such as visceral fat, fat intake and intestinal flora, are insufficient. Second, the causality between NAFLD and the risk for colorectal adenomatous and hyperplastic polyps is difficult to infer through a cross-sectional study. Third, our study subjects were derived from a single center, and multi-centered research should be performed to further confirm the association in the next step. Fourth, although liver biopsy is a standard criterion for NAFLD diagnosis, the diagnosis of fatty liver was based on ultrasound imaging with a 94% sensitivity and 84% specificity[46].
In conclusion, our study clearly demonstrated that NAFLD is specifically associated with an increased risk of colorectal adenomatous and hyperplastic polyps in men. However, NAFLD is not a significant factor in the prevalence of colorectal polyps in women.
COMMENTS
Background
Colorectal adenomatous polyps and some subsets of hyperplastic polyps have been considered precursors of hereditary and sporadic colorectal cancer. Previous studies demonstrated that non-alcoholic fatty liver disease (NAFLD) is associated with an increased risk of colorectal adenoma. However, the association of NAFLD and hyperplastic polyps remains unclear.
Research frontiers
Colorectal cancer arises from colorectal adenomas and some subsets of hyperplastic polyps. Early diagnosis of colorectal adenomatous and hyperplastic polyps is very important to reduce mortality. It is necessary for males with NAFLD to undergo colonoscopy screening and surveillance.
Innovations and breakthroughs
This study identified NAFLD as an independent risk factor for colorectal adenomatous and hyperplastic polyps in males, and NAFLD may be not a significant factor in the prevalence of colorectal polyps in women.
Applications
This research demonstrated that males who have NAFLD exhibit an increased risk of colorectal adenomatous and hyperplastic polyps. The prevalence of colorectal adenocarcinoma is high in men. Therefore, it is necessary for males with NAFLD to undergo colonoscopy screening and surveillance.
Peer-review
The current manuscript investigated features of the metabolic syndrome (presence of NAFLD) and incidence of adenomatous and hyperplastic polyps.
Footnotes
Manuscript source: Unsolicited manuscript
Specialty type: Gastroenterology and hepatology
Country of origin: China
Peer-review report classification
Grade A (Excellent): 0
Grade B (Very good): 0
Grade C (Good): C, C
Grade D (Fair): 0
Grade E (Poor): 0
Institutional review board statement: This article does not contain any studies with human participants or animals performed by either of the authors. No ethics statement is needed.
Informed consent statement: The requirement for informed consent was waived because we retrospectively accessed de-identified data only.
Conflict-of-interest statement: The authors declare that there is no conflict of interest with the paper presented.
Data sharing statement: No additional data are available.
Peer-review started: April 25, 2017
First decision: May 16, 2017
Article in press: July 4, 2017
P- Reviewer: Kahraman A, Rocha R S- Editor: Ma YJ L- Editor: Wang TQ E- Editor: Zhang FF
References
- 1.Leslie A, Carey FA, Pratt NR, Steele RJ. The colorectal adenoma-carcinoma sequence. Br J Surg. 2002;89:845–860. doi: 10.1046/j.1365-2168.2002.02120.x. [DOI] [PubMed] [Google Scholar]
- 2.Jass JR. Hyperplastic polyps of the colorectum-innocent or guilty? Dis Colon Rectum. 2001;44:163–166. doi: 10.1007/BF02234287. [DOI] [PubMed] [Google Scholar]
- 3.Provenzale D, Garrett JW, Condon SE, Sandler RS. Risk for colon adenomas in patients with rectosigmoid hyperplastic polyps. Ann Intern Med. 1990;113:760–763. doi: 10.7326/0003-4819-113-10-760. [DOI] [PubMed] [Google Scholar]
- 4.Sciallero S, Costantini M, Bertinelli E, Castiglione G, Onofri P, Aste H, Casetti T, Mantellini P, Bucchi L, Parri R, et al. Distal hyperplastic polyps do not predict proximal adenomas: results from a multicentric study of colorectal adenomas. Gastrointest Endosc. 1997;46:124–130. doi: 10.1016/s0016-5107(97)70059-2. [DOI] [PubMed] [Google Scholar]
- 5.Croizet O, Moreau J, Arany Y, Delvaux M, Rumeau JL, Escourrou J. Follow-up of patients with hyperplastic polyps of the large bowel. Gastrointest Endosc. 1997;46:119–123. doi: 10.1016/s0016-5107(97)70058-0. [DOI] [PubMed] [Google Scholar]
- 6.Arnold M, Sierra MS, Laversanne M, Soerjomataram I, Jemal A, Bray F. Global patterns and trends in colorectal cancer incidence and mortality. Gut. 2017;66:683–691. doi: 10.1136/gutjnl-2015-310912. [DOI] [PubMed] [Google Scholar]
- 7.Liljegren A, Lindblom A, Rotstein S, Nilsson B, Rubio C, Jaramillo E. Prevalence and incidence of hyperplastic polyps and adenomas in familial colorectal cancer: correlation between the two types of colon polyps. Gut. 2003;52:1140–1147. doi: 10.1136/gut.52.8.1140. [DOI] [PMC free article] [PubMed] [Google Scholar]
- 8.Yoshida I, Suzuki A, Vallée M, Matano Y, Masunaga T, Zenda T, Shinozaki K, Okada T. Serum insulin levels and the prevalence of adenomatous and hyperplastic polyps in the proximal colon. Clin Gastroenterol Hepatol. 2006;4:1225–1231. doi: 10.1016/j.cgh.2006.07.002. [DOI] [PubMed] [Google Scholar]
- 9.Morimoto LM, Newcomb PA, Ulrich CM, Bostick RM, Lais CJ, Potter JD. Risk factors for hyperplastic and adenomatous polyps: evidence for malignant potential? Cancer Epidemiol Biomarkers Prev. 2002;11:1012–1018. [PubMed] [Google Scholar]
- 10.Ji BT, Weissfeld JL, Chow WH, Huang WY, Schoen RE, Hayes RB. Tobacco smoking and colorectal hyperplastic and adenomatous polyps. Cancer Epidemiol Biomarkers Prev. 2006;15:897–901. doi: 10.1158/1055-9965.EPI-05-0883. [DOI] [PubMed] [Google Scholar]
- 11.Huang EH, Whelan RL, Gleason NR, Maeda JS, Terry MB, Lee SW, Neugut AI, Forde KA. Increased incidence of colorectal adenomas in follow-up evaluation of patients with newly diagnosed hyperplastic polyps. Surg Endosc. 2001;15:646–648. doi: 10.1007/s004640000389. [DOI] [PubMed] [Google Scholar]
- 12.Loomba R, Sanyal AJ. The global NAFLD epidemic. Nat Rev Gastroenterol Hepatol. 2013;10:686–690. doi: 10.1038/nrgastro.2013.171. [DOI] [PubMed] [Google Scholar]
- 13.Liu Y, Dai M, Bi Y, Xu M, Xu Y, Li M, Wang T, Huang F, Xu B, Zhang J, et al. Active smoking, passive smoking, and risk of nonalcoholic fatty liver disease (NAFLD): a population-based study in China. J Epidemiol. 2013;23:115–121. doi: 10.2188/jea.JE20120067. [DOI] [PMC free article] [PubMed] [Google Scholar]
- 14.Gaggini M, Morelli M, Buzzigoli E, DeFronzo RA, Bugianesi E, Gastaldelli A. Non-alcoholic fatty liver disease (NAFLD) and its connection with insulin resistance, dyslipidemia, atherosclerosis and coronary heart disease. Nutrients. 2013;5:1544–1560. doi: 10.3390/nu5051544. [DOI] [PMC free article] [PubMed] [Google Scholar]
- 15.Bugianesi E, Gastaldelli A, Vanni E, Gambino R, Cassader M, Baldi S, Ponti V, Pagano G, Ferrannini E, Rizzetto M. Insulin resistance in non-diabetic patients with non-alcoholic fatty liver disease: sites and mechanisms. Diabetologia. 2005;48:634–642. doi: 10.1007/s00125-005-1682-x. [DOI] [PubMed] [Google Scholar]
- 16.Probst-Hensch NM, Yuan JM, Stanczyk FZ, Gao YT, Ross RK, Yu MC. IGF-1, IGF-2 and IGFBP-3 in prediagnostic serum: association with colorectal cancer in a cohort of Chinese men in Shanghai. Br J Cancer. 2001;85:1695–1699. doi: 10.1054/bjoc.2001.2172. [DOI] [PMC free article] [PubMed] [Google Scholar]
- 17.Muhidin SO, Magan AA, Osman KA, Syed S, Ahmed MH. The relationship between nonalcoholic fatty liver disease and colorectal cancer: the future challenges and outcomes of the metabolic syndrome. J Obes. 2012;2012:637538. doi: 10.1155/2012/637538. [DOI] [PMC free article] [PubMed] [Google Scholar]
- 18.Lee YI, Lim YS, Park HS. Colorectal neoplasms in relation to non-alcoholic fatty liver disease in Korean women: a retrospective cohort study. J Gastroenterol Hepatol. 2012;27:91–95. doi: 10.1111/j.1440-1746.2011.06816.x. [DOI] [PubMed] [Google Scholar]
- 19.Hwang ST, Cho YK, Park JH, Kim HJ, Park DI, Sohn CI, Jeon WK, Kim BI, Won KH, Jin W. Relationship of non-alcoholic fatty liver disease to colorectal adenomatous polyps. J Gastroenterol Hepatol. 2010;25:562–567. doi: 10.1111/j.1440-1746.2009.06117.x. [DOI] [PubMed] [Google Scholar]
- 20.Touzin NT, Bush KN, Williams CD, Harrison SA. Prevalence of colonic adenomas in patients with nonalcoholic fatty liver disease. Therap Adv Gastroenterol. 2011;4:169–176. doi: 10.1177/1756283X11402118. [DOI] [PMC free article] [PubMed] [Google Scholar]
- 21.Stadlmayr A, Aigner E, Steger B, Scharinger L, Lederer D, Mayr A, Strasser M, Brunner E, Heuberger A, Hohla F, et al. Nonalcoholic fatty liver disease: an independent risk factor for colorectal neoplasia. J Intern Med. 2011;270:41–49. doi: 10.1111/j.1365-2796.2011.02377.x. [DOI] [PubMed] [Google Scholar]
- 22.Liu CS, Hsu HS, Li CI, Jan CI, Li TC, Lin WY, Lin T, Chen YC, Lee CC, Lin CC. Central obesity and atherogenic dyslipidemia in metabolic syndrome are associated with increased risk for colorectal adenoma in a Chinese population. BMC Gastroenterol. 2010;10:51. doi: 10.1186/1471-230X-10-51. [DOI] [PMC free article] [PubMed] [Google Scholar]
- 23.Kim YJ, Lee KJ, Park SY, Han JH, Kwon KY, Kim JH. Association between Dyslipidemia and the Prevalence of Colon Polyps Based on a Health Evaluation of Subjects at a Hospital. Korean J Fam Med. 2014;35:143–151. doi: 10.4082/kjfm.2014.35.3.143. [DOI] [PMC free article] [PubMed] [Google Scholar]
- 24.Horne R, Hankins M, Jenkins R. The Satisfaction with Information about Medicines Scale (SIMS): a new measurement tool for audit and research. Qual Health Care. 2001;10:135–140. doi: 10.1136/qhc.0100135... [DOI] [PMC free article] [PubMed] [Google Scholar]
- 25.Soon MS, Kozarek RA, Ayub K, Soon A, Lin TY, Lin OS. Screening colonoscopy in Chinese and Western patients: a comparative study. Am J Gastroenterol. 2005;100:2749–2755. doi: 10.1111/j.1572-0241.2005.00355.x. [DOI] [PubMed] [Google Scholar]
- 26.Hamaguchi M, Kojima T, Takeda N, Nakagawa T, Taniguchi H, Fujii K, Omatsu T, Nakajima T, Sarui H, Shimazaki M, et al. The metabolic syndrome as a predictor of nonalcoholic fatty liver disease. Ann Intern Med. 2005;143:722–728. doi: 10.7326/0003-4819-143-10-200511150-00009. [DOI] [PubMed] [Google Scholar]
- 27.Chitturi S, Farrell GC, Hashimoto E, Saibara T, Lau GK, Sollano JD; Asia-Pacific Working Party on NAFLD. Non-alcoholic fatty liver disease in the Asia-Pacific region: definitions and overview of proposed guidelines. J Gastroenterol Hepatol. 2007;22:778–787. doi: 10.1111/j.1440-1746.2007.05001.x. [DOI] [PubMed] [Google Scholar]
- 28.Zhou XD, Wu SJ, Wang LR, Liu WY, Zheng JN, Shi KQ, Poucke SV, Zhang DC, Huang WJ, Zheng MH. Is an elevated hemoglobin concentration a novel risk factor for metabolic syndrome in the Chinese population? a large-scale study. Oncotarget. 2016 Epub ahead of print. [Google Scholar]
- 29.Wong VW, Wong GL, Tsang SW, Fan T, Chu WC, Woo J, Chan AW, Choi PC, Chim AM, Lau JY, et al. High prevalence of colorectal neoplasm in patients with non-alcoholic steatohepatitis. Gut. 2011;60:829–836. doi: 10.1136/gut.2011.237974. [DOI] [PubMed] [Google Scholar]
- 30.Sanyal AJ, Campbell-Sargent C, Mirshahi F, Rizzo WB, Contos MJ, Sterling RK, Luketic VA, Shiffman ML, Clore JN. Nonalcoholic steatohepatitis: association of insulin resistance and mitochondrial abnormalities. Gastroenterology. 2001;120:1183–1192. doi: 10.1053/gast.2001.23256. [DOI] [PubMed] [Google Scholar]
- 31.Wong VW, Hui AY, Tsang SW, Chan JL, Tse AM, Chan KF, So WY, Cheng AY, Ng WF, Wong GL, et al. Metabolic and adipokine profile of Chinese patients with nonalcoholic fatty liver disease. Clin Gastroenterol Hepatol. 2006;4:1154–1161. doi: 10.1016/j.cgh.2006.06.011. [DOI] [PubMed] [Google Scholar]
- 32.Wong VW, Wong GL, Tsang SW, Hui AY, Chan AW, Choi PC, So WY, Tse AM, Chan FK, Sung JJ, et al. Genetic polymorphisms of adiponectin and tumor necrosis factor-alpha and nonalcoholic fatty liver disease in Chinese people. J Gastroenterol Hepatol. 2008;23:914–921. doi: 10.1111/j.1440-1746.2008.05344.x. [DOI] [PubMed] [Google Scholar]
- 33.Saxena A, Chumanevich A, Fletcher E, Larsen B, Lattwein K, Kaur K, Fayad R. Adiponectin deficiency: role in chronic inflammation induced colon cancer. Biochim Biophys Acta. 2012;1822:527–536. doi: 10.1016/j.bbadis.2011.12.006. [DOI] [PMC free article] [PubMed] [Google Scholar]
- 34.Welty FK, Alfaddagh A, Elajami TK. Targeting inflammation in metabolic syndrome. Transl Res. 2016;167:257–280. doi: 10.1016/j.trsl.2015.06.017. [DOI] [PMC free article] [PubMed] [Google Scholar]
- 35.Hickman IJ, Sullivan CM, Flight S, Campbell C, Crawford DH, Masci PP, O’Moore-Sullivan TM, Prins JB, Macdonald GA. Altered clot kinetics in patients with non-alcoholic fatty liver disease. Ann Hepatol. 2009;8:331–338. [PubMed] [Google Scholar]
- 36.Jass JR, Whitehall VL, Young J, Leggett BA. Emerging concepts in colorectal neoplasia. Gastroenterology. 2002;123:862–876. doi: 10.1053/gast.2002.35392. [DOI] [PubMed] [Google Scholar]
- 37.Hamilton SR. Origin of colorectal cancers in hyperplastic polyps and serrated adenomas: another truism bites the dust. J Natl Cancer Inst. 2001;93:1282–1283. doi: 10.1093/jnci/93.17.1282. [DOI] [PubMed] [Google Scholar]
- 38.Hawkins NJ, Ward RL. Sporadic colorectal cancers with microsatellite instability and their possible origin in hyperplastic polyps and serrated adenomas. J Natl Cancer Inst. 2001;93:1307–1313. doi: 10.1093/jnci/93.17.1307. [DOI] [PubMed] [Google Scholar]
- 39.Bosari S, Moneghini L, Graziani D, Lee AK, Murray JJ, Coggi G, Viale G. bcl-2 oncoprotein in colorectal hyperplastic polyps, adenomas, and adenocarcinomas. Hum Pathol. 1995;26:534–540. doi: 10.1016/0046-8177(95)90250-3. [DOI] [PubMed] [Google Scholar]
- 40.Otori K, Oda Y, Sugiyama K, Hasebe T, Mukai K, Fujii T, Tajiri H, Yoshida S, Fukushima S, Esumi H. High frequency of K-ras mutations in human colorectal hyperplastic polyps. Gut. 1997;40:660–663. doi: 10.1136/gut.40.5.660. [DOI] [PMC free article] [PubMed] [Google Scholar]
- 41.Sinicrope FA, Ruan SB, Cleary KR, Stephens LC, Lee JJ, Levin B. bcl-2 and p53 oncoprotein expression during colorectal tumorigenesis. Cancer Res. 1995;55:237–241. [PubMed] [Google Scholar]
- 42.Hyman NH, Anderson P, Blasyk H. Hyperplastic polyposis and the risk of colorectal cancer. Dis Colon Rectum. 2004;47:2101–2104. doi: 10.1007/s10350-004-0709-6. [DOI] [PubMed] [Google Scholar]
- 43.Lee WM, Lu S, Medline A, Archer MC. Susceptibility of lean and obese Zucker rats to tumorigenesis induced by N-methyl-N-nitrosourea. Cancer Lett. 2001;162:155–160. doi: 10.1016/s0304-3835(00)00635-2. [DOI] [PubMed] [Google Scholar]
- 44.Vanni E, Bugianesi E, Kotronen A, De Minicis S, Yki-Järvinen H, Svegliati-Baroni G. From the metabolic syndrome to NAFLD or vice versa? Dig Liver Dis. 2010;42:320–330. doi: 10.1016/j.dld.2010.01.016. [DOI] [PubMed] [Google Scholar]
- 45.Luef G, Rauchenzauner M, Waldmann M, Sturm W, Sandhofer A, Seppi K, Trinka E, Unterberger I, Ebenbichler CF, Joannidis M, et al. Non-alcoholic fatty liver disease (NAFLD), insulin resistance and lipid profile in antiepileptic drug treatment. Epilepsy Res. 2009;86:42–47. doi: 10.1016/j.eplepsyres.2009.04.004. [DOI] [PubMed] [Google Scholar]
- 46.Mendler MH, Bouillet P, Le Sidaner A, Lavoine E, Labrousse F, Sautereau D, Pillegand B. Dual-energy CT in the diagnosis and quantification of fatty liver: limited clinical value in comparison to ultrasound scan and single-energy CT, with special reference to iron overload. J Hepatol. 1998;28:785–794. doi: 10.1016/s0168-8278(98)80228-6. [DOI] [PubMed] [Google Scholar]