

Abstract
In subjects with multiple sclerosis (MS), pathology is more frequent near the inner and outer surfaces of the brain. Here, we sought to explore if in subjects with primary progressive MS (PPMS) cortical lesion load is selectively associated with the severity of periventricular normal appearing white matter (NAWM) damage, as assessed with diffusion weighted imaging.
To this aim, twenty-four subjects with PPMS and twenty healthy controls were included in the study. Using diffusion data, skeletonized mean diffusivity (MD) NAWM maps were computed excluding WM lesions and a 2 mm-thick peri-lesional rim. The supra-tentorial voxels between 2 and 6 mm of distance from the lateral ventricles were included in the periventricular NAWM mask while the voxels between 6 and 10 mm from the lateral ventricles were included in the deep NAWM mask; mean MD values were then computed separately for these two masks. Lastly, cortical lesions were assessed on phase-sensitive inversion recovery (PSIR) images and cortical thickness was quantified on volumetric T1 images.
Our main result was the observation in the PPMS group of a significant correlation between periventricular NAWM MD values and cortical lesion load, with a greater cortical lesion burden being associated with more abnormal periventricular NAWM MD. Conversely, there was no correlation between cortical lesion load and deep NAWM MD values or periventricular WM lesions.
Our data thus suggest that a common – and relatively selective - factor plays a role in the development of both cortical lesion and periventricular NAWM abnormalities in PPMS.
Keywords: Multiple sclerosis, MRI
Highlights
-
•
In PPMS, pathology is more frequent near the inner and outer brain surfaces.
-
•
We evaluated the association between cortical lesions and periventricular damage.
-
•
Cortical lesion load directly correlated with periventricular NAWM damage severity.
-
•
Cortical lesion load did not correlate with periventricular lesions.
-
•
A common factor seems to modulate cortical lesions and periventricular NAWM damage.
1. Introduction
Although multiple sclerosis (MS) affects the entire brain, lesions are more extensive and extra-lesional pathology more intense in the white matter (WM) and grey matter (GM) adjacent to the outer (i.e. subpial) and inner (i.e. ventricular) surfaces of the brain (Brownell and Hughes, 1962, Pardini et al., 2016).
Cortical lesions, for example, are frequently found near the subpial brain surface and are reported to be present in > 80% of subjects with primary progressive MS (PPMS) (Choi et al., 2012). In all MS subtypes, the presence of subpial cortical lesions has been linked with meningeal inflammation, hinting a role for soluble inflammatory factors in modulating the spatial distribution of tissue damage. Moreover, while a periventricular predilection for lesion formation has been recognised for some time, (Adams et al., 1987) it has recently been shown in subjects with relapse-onset MS that extra-lesional WM abnormalities are also greater with proximity to the ventricles, even if the pathological bases of the latter observation are presently unknown (Brown et al., 2017, Liu et al., 2015, Pardini et al., 2016).
Previous studies in subjects with relapse-onset MS have shown that periventricular WM lesions are associated with the extent of cortical atrophy (Jehna et al., 2015) and that a declining gradient of damage severity from the brain surface inwards is present both in deep and in cortical GM, (Pardini et al., 2016) thus suggesting that a common factor is involved in modulating cortical and periventricular pathology. Conversely, the association between tissue damage in these different tissue compartments in PPMS remains not characterized.
Here, given the wealth of information regarding cortical lesions pathophysiology (Calabrese et al., 2010, Choi et al., 2012, Sethi et al., 2013), we sought to explore the association, if any, between cortical lesions and periventricular normal appearing (NA) WM abnormalities as measured by (i) diffusion tensor imaging and (ii) periventricular WM lesion volume in subjects with PPMS. Moreover, to better characterise the relationship between cortical pathology and structural damage, we also computed thickness of the cortical mantle.
2. Methods
2.1. Subject selection
Twenty-four subjects who met the modified McDonald diagnostic criteria and were running a PPMS course were prospectively enrolled as described elsewhere (Petracca et al., 2017). Twenty sex- and age-matched healthy subjects served as controls. Inclusion criteria for PPMS patients were (i) age between 25 and 65 years, (ii) an Expanded Disability Status Scale (EDSS) equal or lower than 6.5 at screening visit, and (iii) disease duration lower than 15 years. The use of immuno-modulatory drugs was allowed but, if treated, patients had to be on current treatment for at least 1 year. In the US it is not uncommon for patients with PPMS to be tried on one of the approved immunomodulatory treatments despite the lack of Phase III clinical trials evidence. Therefore, although our sample is not universally representative, it is representative of the US practice. Exclusion criteria were (i) neuropsychiatric disorders other than MS, (ii) history of alcohol or drug abuse, and (iii) contraindications to MRI. Clinical and demographical information are reported in Table 1.
Table 1.
Clinical, demographic and conventional MRI data for the primary progressive multiple sclerosis (PPMS) and healthy controls (HC) groups.
| PPMS | HC | |
|---|---|---|
| Age (range, years) | 50.8 (32–65) | 51.1 (34–63) |
| Gender (M/F) | 12/12 | 9/11 |
| Disease duration (years) | 9 ± 4.8 | – |
| Median EDSS (range) | 4 (1.5–6) | – |
| Normalized brain volume (mL) | 1368.5 ± 59.1 | 1434.1 ± 53.6 |
| Normalized grey matter volume (mL) | 721.8 ± 37.5 | 757.3 ± 39.0 |
| White matter T2 lesion volume (mL) | 5.9 ± 7.7 | – |
2.2. MRI acquisition
MRI was performed using a 3.0 T scanner (Philips Achieva, The Netherlands) with an 8-channel SENSE phased-array head coil (Philips Achieva, The Netherlands) as previously described (Petracca et al., 2017). The MRI protocol included the following sequences: (i) axial dual echo/turbo spin echo sequence: repetition time (TR) = 2500 ms, echo time (TE1) = 10 ms, TE2 = 80 ms, field of view, FoV) = 230 mm × 230 mm, matrix size = 512 × 512, 46 contiguous 3-mm-thick slices; (ii) sagittal 3D T1-weighted turbo field echo sequence: TR/TE = 7.5/3.5 ms, inversion time (TI) = 900 ms, flip angle = 8°,voxel-size = 1 × 1 × 1 mm3, 172 contiguous slices; (iii) axial double inversion recovery (DIR) sequence: TR/TE = 11,000/25 ms, TI = 3400 ms; (iv) phase-sensitive inversion recovery (PSIR) sequence: TR/TE/TI = 4500/8/400 ms and (v) single-shot EPI for diffusion weighted imaging: TR/TE = 8550/89.5 ms b-values: 0,1000,2000 s/mm2 32 non-collinear directions; voxel size 2 × 2 × 2 mm3. Both DIR and PSIR were acquired with 46 contiguous 3-mm-thick slices with in-plane reconstructed resolution of 0.5 mm × 0.5 mm.
2.3. MRI analysis
Cortical lesions were identified according to published criteria, on PSIR images using DIR and T1 images as reference (Sethi et al., 2013). A single observer blinded to clinical information and subject's identity, under the supervision of a senior investigator performed all the lesion loads. Intracortical (IC) lesions were defined as lesions that were confined to the cortex, while lesions that involved both cortex and juxtacortical white matter (WM) were identified as leucocortical lesions (LC). Juxtacortical lesions (JC) were differentiated from LC lesions based on preservation of normal cortical contour and absence of cortical involvement. Particular care was paid to exclude cortical vessels, Virchow Robin spaces and artefacts. JC lesions, involving only WM, were not included in further analysis, while LC and IC lesion volumes were summed to quantify total cortical lesion volume. WM lesions were identified on PD/T2 sequences and were then co-registered to diffusion data using a linear transformation. All lesions were marked using Jim version 6 (Xinapse Systems, Northants, England), using a semi-automated edge-finding tool based on local thresholding technique. FDT, included in the FSL toolbox, was used to perform eddy-current correction on diffusion data and to fit the diffusion tensor (Smith et al., 2004). Mean diffusivity (MD) NAWM maps were created excluding WM lesions and a 2 mm-thick peri-lesional rim as previously described (Liu et al., 2015). Mean diffusivity (MD) NAWM maps were created excluding WM lesions ). Skeletonized NAWM MD maps, normalized to a common space, were then computed using the TBSS pipeline (Smith et al., 2006). In each skeletonized NAWM MD map, those supra-tentorial voxels with a distance from the lateral ventricles between 2 and 6 mm were included in the periventricular NAWM mask while those voxels of skeletonized WM with a distance from the lateral ventricles between 6 and 10 mm were included in the deep NAWM mask. Thus all NAWM voxels with a distance from the ventricles > 10 mm were not included neither in the periventricular NAWM mask nor in the deep NAWM mask (Fig. 1). For these two regions, both mean MD and percentage of lesioned WM were computed. Moreover, whole brain normalized grey matter (nGMV) volume and normalized brain volume (nBV), were computed using Sienax (Smith et al., 2002) on lesion-filled volumetric T1 images.
Fig. 1.
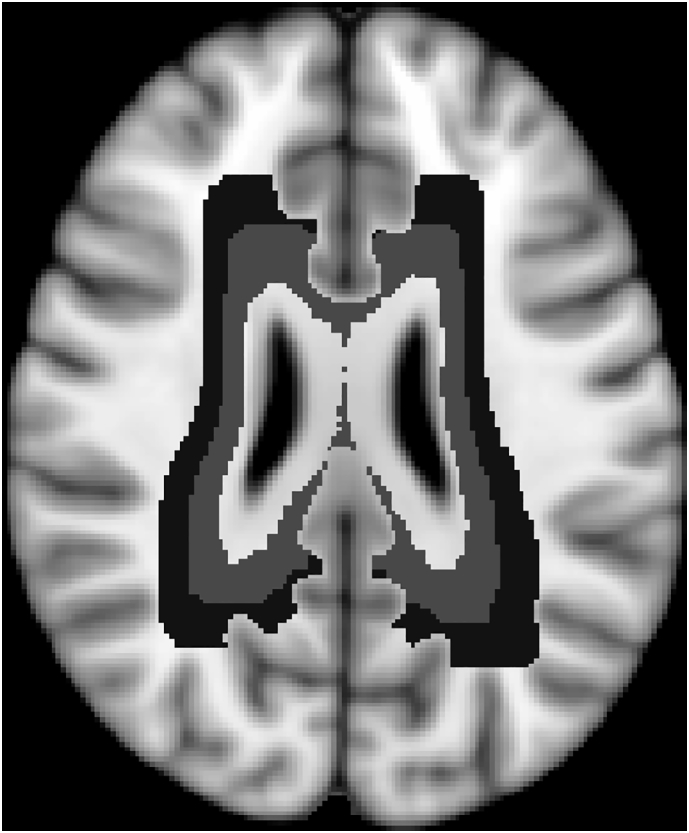
Periventricular (represented in light grey) and deep (represented in dark grey) WM masks.
Lastly, cortical thickness was measured with the Freesurfer (version v5.3.0) pipeline using lesion-filled volumetric T1 images. After Freesurfer analysis, all images were reviewed by two experienced operators.
2.4. Confirmatory analysis: FA data
Using the same pipeline described above, we also computed mean FA both in the skeletonized periventricular NAWM mask and the skeletonized periventricular NAWM mask. To take into account the regional differences in WM architecture, which could impact on FA values, we used control data to convert raw FA values to z scores using the following formula (FA_patient – mean_FA_control_group)/standard_deviation_FA_control_group.
2.5. Confirmatory analysis: Deep NAWM parcellation from the cortical ribbon inward
Lastly, we decided to confirm our findings using an alternative approach to create the deep NAWM mask, to try to accommodate for the convoluted architecture of the cortex. Firstly, we computed the distance from the cortical grey matter of all supratentorial voxels not previously included in the periventricular mask, and then included in the deep NAWM mask those voxels included in the farthest 4 mm from the cortex (in line with the previous parcellation in 4 mm-wide regions).
2.6. Statistical analysis
Independent-samples t-tests and paired-sample t-tests were used to compare NAWM MD values between PPMS subjects and controls and, in the PPMS group, between periventricular and deep NAWM.
Associations between cortical lesion load and tissue abnormalities were assessed with Pearson's correlations. Three subjects, for whom no cortical lesions were reliably identified, were excluded from the main correlation analyses only, however their inclusion in confirmatory analyses did not lead to significant changes in the results. Confirmatory analyses correcting for whole brain WM lesion load, nBV and nGMV were also performed using a partial correlations approach. Statistical significance was set at p < 0.05, uncorrected. However for all non-confirmatory analyses, we also computed pFDR-corrected values based on the Benjamini–Hochberg methods. Statistical analysis was run with SPSS software version 20.0 (SPSS Inc., Chicago, IL, USA).
2.7. Ethics
Written informed consent was obtained from all participants according to the Declaration of Helsinki. The protocol was approved by the Institutional Review Board of the Icahn School of Medicine at Mount Sinai.
3. Results
3.1. Evaluation of periventricular NAWM abnormalities
Compared to controls, PPMS subjects had higher MD values in periventricular (0.75 ± 0.06 mm3 / 10− 3 vs 0.83 ± 0.09 mm3 / 10− 3, p = 0.01, pFDR (corrected multiple comparisons) = 0.03) and deep NAWM regions (0.73 ± 0.05 mm3 / 10− 3 vs 0.77 ± 0.06 mm3 / 10− 3, p = 0.01, pFDR (corrected multiple comparisons) = 0.03)). Moreover, in the PPMS group, MD values were significantly higher in periventricular than deep NAWM (t = 3.43, p = 0.002, pFDR (corrected multiple comparisons) = 0.01)).
3.2. Association between periventricular abnormalities and cortical lesion volume
A significant, direct correlation was observed between periventricular NAWM MD values and cortical lesion volume in the PPMS group (r = 0.65 p = 0.001, pFDR (corrected multiple comparisons) < 0.01); Fig. 2-A), conversely there was no association between periventricular WM lesion load (percentage of lesioned WM: 5.3% ± 5.9) and cortical lesion volume (r = − 0.18, p = 0.43). Correction with whole brain WM lesion load, nBV or nGMV did not significantly alter the results.
Fig. 2.
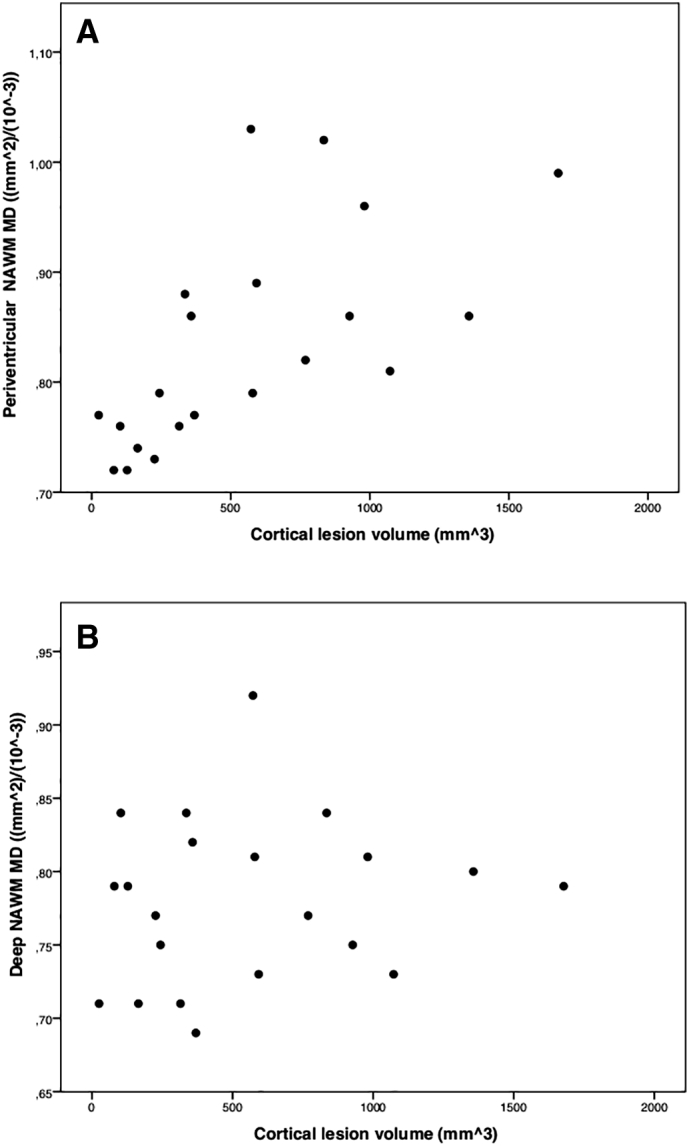
Correlations between cortical lesion load and periventricular NAWM MD values (panel A), and deep NAWM MD values (panel B). All data refer to primary progressive multiple sclerosis (PPMS) subjects. PPMS subjects (n = 3) without clearly evident cortical lesions were not included in these graphs.
3.3. Association between deep white matter abnormalities and cortical lesion volume
There was no association between deep NAWM MD values and cortical lesion volume in the PPMS group (r = 0.14, p = 0.54, Fig. 2-B), nor between deep WM lesion load and cortical lesion volume (r = − 0.11, p = 0.59).
3.4. Association between periventricular and deep WM measures and cortical thickness
There was no association between cortical thickness (mean thickness 2,5 ± 0,3 mm) and periventricular or deep NAWM MD values in the PPMS group (r = − 0.17, p = 0.473, r = − 0.04, p = 0.875). Cortical thickness did not correlate with periventricular and deep WM lesion load (r = − 0.20, p = 0.320, r = − 0.18, p = 0.379), or with whole brain WM lesion load (r = − 0.19, p = 0.363). Whole brain WM lesion load correlated with cortical lesions (r = 0.52, p = 0.02, pFDR (corrected multiple comparisons) = 0.06)), this correlation, however, did not survive an FDR-correction for multiple comparison.
3.5. Confirmatory analysis: FA
In the PPMS group z-scores converted FA data were significantly lower in the periventricular than deep NAWM (− 0.97 ± 0.3 vs. -0.79 ± 0.4, p = 0.003). The correlation between z-converted FA values and cortical lesion load was significant taking into account periventricular NAWM (r = − 0.56 p = 0.003), but not deep NAWM (p = 0.43).
3.6. Confirmatory analysis: Deep NAWM parcellation from the cortical ribbon inward
Using the confirmatory parcellation of deep NAWM, there was no association between deep NAWM MD values and cortical lesion volume (r = 0.16, p = 0.50), nor between deep WM lesion load and cortical lesion volume (r = − 0.14, p = 0.48).
4. Discussion
In this work, we showed that cortical lesions load was positively associated with periventricular NAWM abnormalities, but not with deep NAWM alterations nor with periventricular WM lesion load. These findings suggest that, at least in PPMS, cortical lesions accrual could share a common pathophysiological mechanism with periventricular NAWM abnormalities development but not with WM lesion formation or with deep NAWM alterations.
WM lesions nearly always form around veins and while some GM lesions also appear to do so, subpial cortical GM lesions (the most abundant type of GM lesion in progressive MS) do not follow the same pattern (Bo et al., 2003), and have instead been linked with overlying meningeal inflammation (Choi et al., 2012). The absence of a clear association between cortical and WM lesion loads could be due to the different roles played by veins in cortical and WM lesions formation and by the high density of veins in the periventricular region. This finding is in line with previous work on relapse-onset MS (Pardini et al., 2016), where it was showed that NAWM alterations, but not WM lesion density, were consistently inversely proportional to the distance from the tissue/CSF boundary.
The pathological bases of gradients in periventricular NAWM abnormalities, observed in people with relapse-onset MS (Liu et al., 2015, Pardini et al., 2016) and with clinically isolated syndrome (Brown et al., 2017) is unknown, and speculation on possible mechanisms that may link NAWM abnormalities and cortical lesions is therefore difficult. From an anatomical point of view, proximity of cortical lesions and periventricular NAWM abnormalities to the surface of the brain raises the possibility of a common factor surrounding the brain being relevant. While meningeal inflammatory changes have been observed in MS, and linked with demyelination and neuronal loss in underlying cortical GM, (Bo et al., 2003, Choi et al., 2012) ependymal abnormalities described as ‘granular ependymitis’ have only been seen in one study (Adams et al., 1987). Proximity to CSF could also offer a possible explanation for our findings, as there is in vitro evidence that CSF in MS is neurotoxic (Vidaurre et al., 2014).
The lack of correlation between periventricular damage and cortical thickness, on the other hand, is not in line with a previous study on RRMS and CIS subjects, where an association between cortical thickness and periventricular lesions was observed (Jehna et al., 2015). Compared to the RRMS/CIS subjects, however, our patients probably present with more marked structural alterations, together with a longer disease duration. Moreover our patient group was smaller when compared to the aforementioned RRMS/CIS study, even if probably less heterogeneous. Future studies are needed to shed more light on the possible differences in the association between cortical thickness and white matter lesions across the different disease subtypes.
To try to reduce partial volume effects from CSF and WM lesions, we excluded all WM voxels within 2 mm of the ventricles or WM lesions. However, as periventricular NAWM abnormalities are more marked close to the ventricles, it is likely that this will have reduced sensitivity to periventricular NAWM abnormalities and lead us to underestimate the strength of associations with cortical lesions. Moreover, to control for a possible confounding effect due to inter-subject differences in ventricular volume, we used a non-linear registration to a common space, included in the TBSS pipeline, and we verified that correcting for nBV did not significantly change the results.
Multiple correlations have been undertaken, and so it is possible that some of the associations found may be spurious, however the correlation between periventricular NAWM abnormalities and cortical lesion load would survive a Bonferroni correction, if applied, and all key results survive a FDR-correction for multiple comparisons. In addition, the moderate sample size counsels caution when seeking to generalise the present findings, which however, are consistent with recent observations in relapse onset MS.
In conclusion, our findings suggest that there is an association between cortical lesion load and periventricular NAWM abnormalities, and so potentially a shared factor contributes to these two facets of MS pathology in PPMS.
Disclosures
Dr. Pardini received research support from Novartis. Drs Petracca, Harel, Fleysher, Oesingmann, Bommarito and Fabian have nothing to disclose. Dr. Chard has received honoraria (paid to his employer) from Ismar Healthcare NV, Swiss MS Society, Excemed (previously Serono Symposia International Foundation), Merck, Bayer and Teva for faculty-led education work; Teva for advisory board work; meeting expenses from Merck, Teva, Novartis, the MS Trust and National MS Society; and has previously held stock in GlaxoSmithKline. Dr. Lublin sources of funding for research include: Acorda Therapeutics, Inc.; Biogen Idec; Novartis Pharmaceuticals Corp; Teva Neuroscience, Inc.; Genzyme; Sanofi; Celgene; NIH; NMSS; Consulting Agreements/Advisory Boards/DSMB: Bayer HealthCare Pharmaceuticals; Biogen Idec; EMD Serono, Inc.; Novartis; Teva Neuroscience; Actelion; Sanofi-Aventis; Acorda; Questcor; Roche, Genentech; Celgene; Johnson & Johnson; Revalesio; Coronado Bioscience, Genzyme, MedImmune; Bristol-Myers Squibb, Xenoport, Receptos; Forward Pharma; Co-Chief Editor: Multiple Sclerosis and Related Diseases; Stock Ownership: Cognition Pharmaceuticals, Inc. Dr. Inglese has received research grants from NIH, NMSS, Novartis Pharmaceuticals Corp., and Teva Neuroscience and is a consultant to Vaccinex Inc.
Contributorship statement
M. Pa. and M.I. designed the study. M.Pe, A.H., L.F., N.O.,M.F., contributed to data acquisition. M.Pa. ran the statistical analysis and takes full responsibility for the results. All authors contributed to the planning of the statistical analysis, the interpretation of the results, the preparation and the critical revision of the manuscript. All authors approved the manuscript. M.I. coordinated the study.
Acknowledgments
This study was supported in part by Novartis Pharmaceuticals (CFTY20DUSNC15T), National Multiple Sclerosis Society (NMSS RG 5120A3/1) and the Noto Foundation to MI and by a research fellowship from Fondazione Italiana Sclerosi Multipla (2013/B/7) to Dr. Petracca.
References
- Adams C.W., Abdulla Y.H., Torres E.M. Periventricular lesions in multiple sclerosis: their perivenous origin and relationship to granular ependymitis. Neuropathol. Appl. Neurobiol. 1987;13(2):141–152. doi: 10.1111/j.1365-2990.1987.tb00177.x. [DOI] [PubMed] [Google Scholar]
- Bo L., Vedeler C.A., Nyland H.I. Subpial demyelination in the cerebral cortex of multiple sclerosis patients. J. Neuropathol. Exp. Neurol. 2003;62(7):723–732. doi: 10.1093/jnen/62.7.723. [DOI] [PubMed] [Google Scholar]
- Brown J.W., Pardini M., Brownlee W.J. An abnormal periventricular magnetization transfer ratio gradient occurs early in multiple sclerosis. Brain. 2017;140(Pt 2):387–398. doi: 10.1093/brain/aww296. [DOI] [PMC free article] [PubMed] [Google Scholar]
- Brownell B., Hughes J.T. The distribution of plaques in the cerebrum in multiple sclerosis. J. Neurol. Neurosurg. Psychiatry. 1962;25:315–320. doi: 10.1136/jnnp.25.4.315. [DOI] [PMC free article] [PubMed] [Google Scholar]
- Calabrese M., Rocca M.A., Atzori M. A 3-year magnetic resonance imaging study of cortical lesions in relapse-onset multiple sclerosis. Ann. Neurol. 2010;67(3):376–383. doi: 10.1002/ana.21906. [DOI] [PubMed] [Google Scholar]
- Choi S.R., Howell O.W., Carassiti D. Meningeal inflammation plays a role in the pathology of primary progressive multiple sclerosis. Brain. 2012;135(Pt 10):2925–2937. doi: 10.1093/brain/aws189. [DOI] [PubMed] [Google Scholar]
- Jehna M., Pirpamer L., Khalil M. Periventricular lesions correlate with cortical thinning in multiple sclerosis. Ann. Neurol. 2015;78(4):530–539. doi: 10.1002/ana.24461. [DOI] [PubMed] [Google Scholar]
- Liu Z., Pardini M., Yaldizli O. Magnetization transfer ratio measures in normal-appearing white matter show periventricular gradient abnormalities in multiple sclerosis. Brain. 2015;138(Pt 5):1239–1246. doi: 10.1093/brain/awv065. [DOI] [PMC free article] [PubMed] [Google Scholar]
- Pardini M., Sudre C.H., Prados F. Relationship of grey and white matter abnormalities with distance from the surface of the brain in multiple sclerosis. J. Neurol. Neurosurg. Psychiatry. 2016;87(11):1212–1217. doi: 10.1136/jnnp-2016-313979. [DOI] [PubMed] [Google Scholar]
- Petracca M., Cordano C., Cellerino M. Retinal degeneration in primary-progressive multiple sclerosis: a role for cortical lesions? Mult. Scler. 2017;23(1):43–50. doi: 10.1177/1352458516637679. [DOI] [PubMed] [Google Scholar]
- Sethi V., Muhlert N., Ron M. MS cortical lesions on DIR: not quite what they seem? PLoS One. 2013;8(11) doi: 10.1371/journal.pone.0078879. [DOI] [PMC free article] [PubMed] [Google Scholar]
- Smith S.M., Zhang Y., Jenkinson M. Accurate, robust, and automated longitudinal and cross-sectional brain change analysis. NeuroImage. 2002;17(1):479–489. doi: 10.1006/nimg.2002.1040. [DOI] [PubMed] [Google Scholar]
- Smith S.M., Jenkinson M., Woolrich M.W. Advances in functional and structural MR image analysis and implementation as FSL. NeuroImage. 2004;23(Suppl. 1):S208–S219. doi: 10.1016/j.neuroimage.2004.07.051. [DOI] [PubMed] [Google Scholar]
- Smith S.M., Jenkinson M., Johansen-Berg H. Tract-based spatial statistics: voxelwise analysis of multi-subject diffusion data. NeuroImage. 2006;31(4):1487–1505. doi: 10.1016/j.neuroimage.2006.02.024. [DOI] [PubMed] [Google Scholar]
- Vidaurre O.G., Haines J.D., Katz Sand I. Cerebrospinal fluid ceramides from patients with multiple sclerosis impair neuronal bioenergetics. Brain. 2014;137(Pt 8):2271–2286. doi: 10.1093/brain/awu139. [DOI] [PMC free article] [PubMed] [Google Scholar]