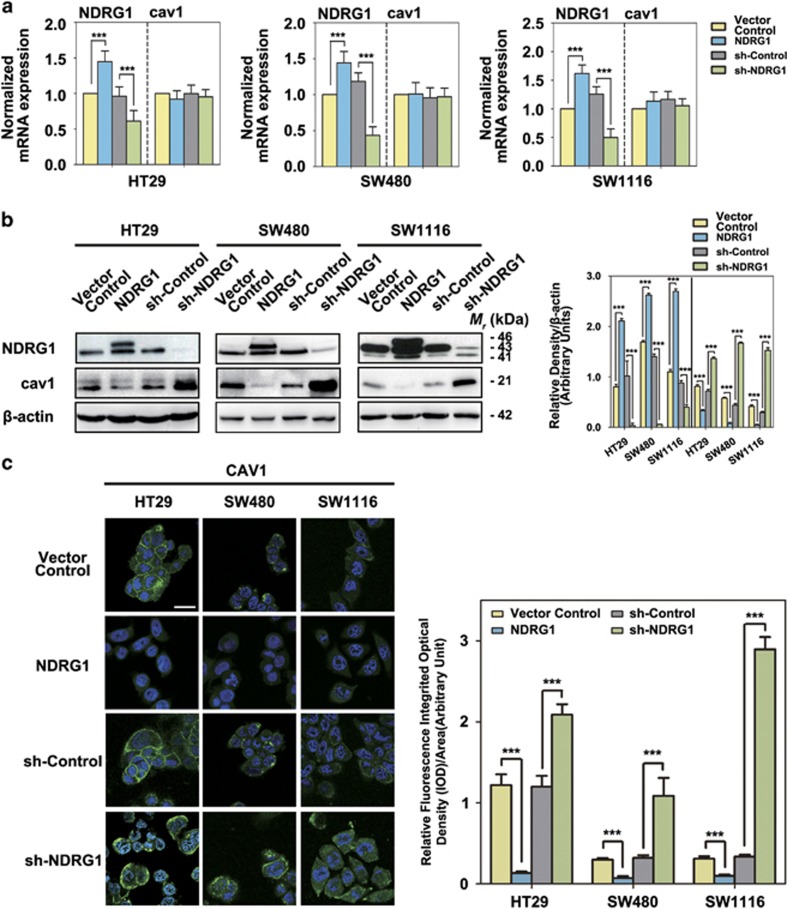
Figure 1.
Regulation of caveolin-1 expression by NDRG1 in CRC cells. (a) RT-qPCR results of the NDRG1 and caveolin-1 mRNA expressions in NDRG1 overexpression and NDRG1 knockdown HT29, SW480 and SW1116 cells compared with their relative control cells (that is, Vector Control and sh-Control, respectively). The values in histograms is represented by mean±s.d. (three experiments). ***P<0.001, relative to the respective control cells. (b) Western blots for the indicated proteins in NDRG1 overexpression and NDRG1 knockdown HT29, SW480 and SW1116 cells compared with their relative control cells (that is, Vector Control and sh-Control, respectively). Densitometry analyses for NDRG1 and cav1 are expressed relative to the loading control, β-actin. Results are typical of three to five experiments and the values in histograms is represented by mean±s.d. (three to five experiments). ***P<0.001, relative to the respective control cells. (c) Merged images were taken to show immunofluorescence staining of caveolin-1 (green) accompanied by the cell nucleus (blue) stained by DAPI in NDRG1 overexpression and NDRG1 knockdown HT29, SW480 and SW1116 cells relative to the Vector Control and sh-Control cells, respectively. Scale bars, 20 μm. Fluorescence quantification was performed by comparing the integrated optical density (IOD)/area value of cav1 to the IOD/area value of the nucleus (DAPI) in the same image. Results are typical of three to five images from different visual fields and the histogram values are mean±s.d. (three to five images). ***P<0.001, relative to the respective control cells.

