Figure 4.
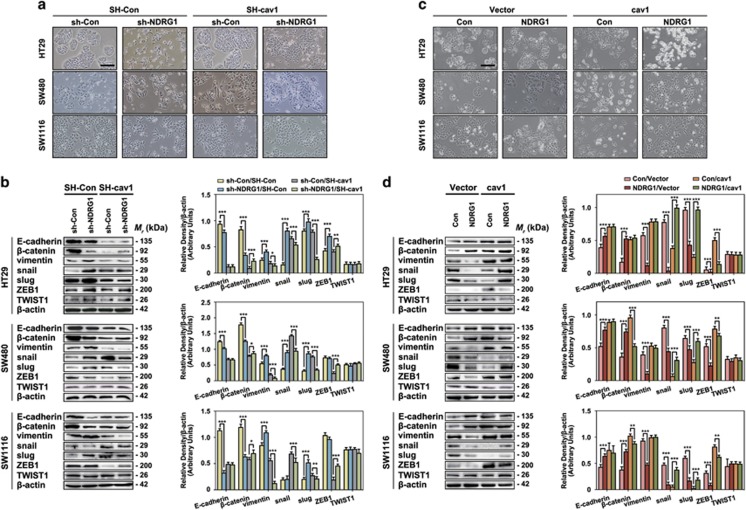
NDRG1 regulates EMT through modulating caveolin-1 expression. (a) Bright-field images were taken to show cell morphological changes after sh-NDRG1 and/or SH-caveolin-1 treatment. Scale bar, 100 μm. (b) Immunoblot results of molecular markers of EMT after sh-NDRG1 and/or SH-caveolin-1 treatment. Densitometry analysis is expressed relative to the loading control, β-actin. Results are typical of three to five experiments and the histograms represent mean±s.d. (three to five experiments). *P<0.05; **P<0.01; ***P<0.001, relative to the respective control cells. (c) Bright-field images were taken to show cell morphological changes after NDRG1 and/or caveolin-1 overexpression treatment. Scale bar, 100 μm. (d) Immunoblot results of molecular markers of EMT after NDRG1 and/or caveolin-1 overexpression treatment. Densitometry analysis is expressed relative to the loading control, β-actin. Results are typical of three to five experiments and the histograms represent mean±s.d. (three to five experiments). **P<0.01, ***P<0.001, relative to the respective control cells.

