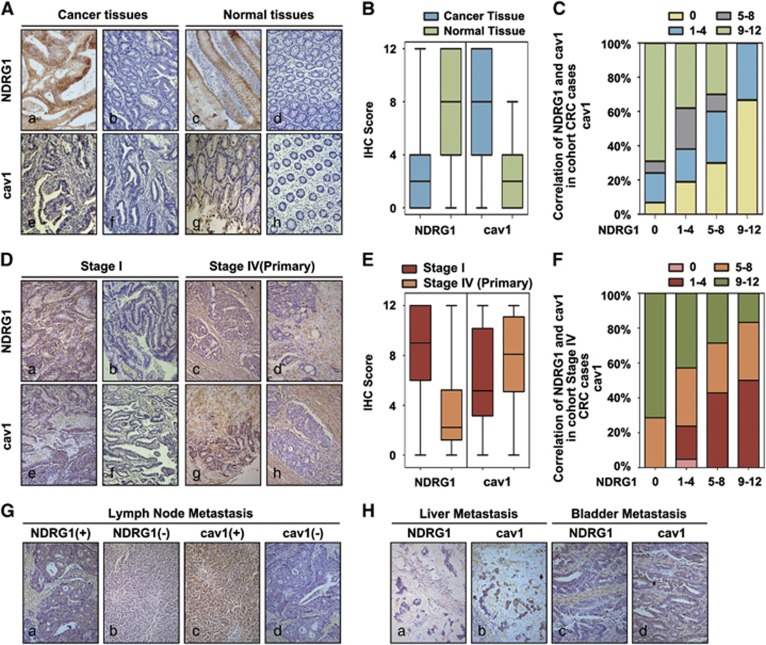
Figure 5.
Negative correlation of NDRG1 with caveolin-1 expression in human CRC tissues. (A) Representative IHC images of CRC samples and adjacent normal tissues for the low and high expressions of NDRG1 and caveolin-1; magnification: × 100. (B) Scores for NDRG1 and caveolin-1 expression are shown as box plots, with the horizontal lines representing the median; the bottom and top of the boxes representing the 25th and 75th percentiles, respectively; and the vertical bars representing the range of data. We compared CRC tissues with matched adjacent normal tissues. (C) Box plot of NDRG1 and caveolin-1 expression in the CRC samples. The subjects were divided into two groups based on NDRG1 expression scores in the tumors, representing negative (score 0), low (scores 1–4), high (scores 5–8) and strong (score 9–12) expression of NDRG1. Data were analyzed by one-way ANOVA with Games–Howell’s correction. (D) Representative IHC images of stage I and stage IV CRC samples for the low and high expressions of NDRG1 and caveolin-1; magnification: × 100. (E) Scores for NDRG1 and caveolin-1 expression are shown as box plots in stage I and stage IV CRC samples, with the horizontal lines representing the median; the bottom and top of the boxes representing the 25th and 75th percentiles, respectively; and the vertical bars representing the range of data. We compared CRC tissues with matched adjacent normal tissues. (F) Box plot of NDRG1 and caveolin-1 expression in stage IV CRC samples. The subjects were divided into two groups based on NDRG1 expression scores in the tumors, representing negative (score 0), low (scores 1–4), high (scores 5–8) and strong (score 9–12) expression of NDRG1. Data were analyzed by one-way ANOVA with Games–Howell’s correction. (G) Representative IHC images of metastatic lymph node samples for the low and high expressions of NDRG1 and caveolin-1; magnification: × 100. (H) Representative IHC images of liver and bladder metastasis for the classical expressions of NDRG1 and caveolin-1; magnification: × 100.

