

Abstract
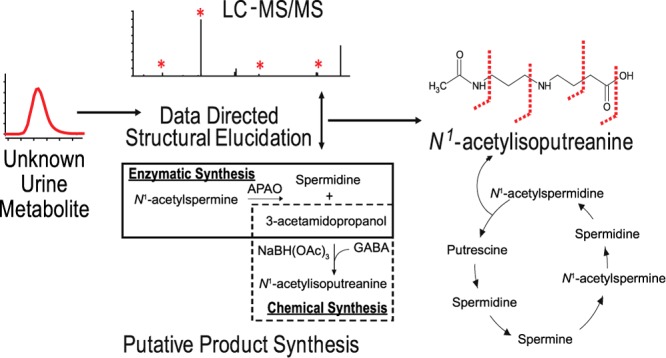
An untargeted metabolomics approach was utilized to determine urinary metabolites that could serve as small-molecule biomarkers for treatment response to standard tuberculosis treatment. However, the majority of metabolites that most accurately distinguished patient samples at the time of diagnosis from those at 1 month after the start of therapy lacked structural identification. The detection of unknown metabolite structures is a well-known limitation of untargeted metabolomics and underscores a need for continued elucidation of novel metabolite structures. In this study, we sought to define the structure of a urine metabolite with an experimentally determined mass of 202.1326 Da, classified as molecular feature (MF) 202.1326. A hypothesized structure of N1-acetylisoputreanine was developed for MF 202.1326 using in silico tools and liquid chromatography–tandem mass spectrometry (LC–MS/MS). In the absence of a commercial standard, synthetic N1-acetylisoputreanine was generated using enzymatic and chemical syntheses, and LC–MS/MS was used to confirm the structure of MF 202.1326 as N1-acetylisoputreanine, a proposed terminal polyamine catabolite that had not been previously detected in biological samples. Further analysis demonstrated that N1-acetylisoputreanine and an alternative form of this metabolite, N1-acetylisoputreanine-γ-lactam, are both present in human urine and are likely end-products of polyamine metabolism.
Introduction
Metabolomics is a growing field that has yielded numerous metabolites with abundant changes correlating to a variety of diseases and phenotypes.1,2 However, a major challenge in mass spectrometry (MS)-based metabolomics research has been the structural confirmation of individual metabolites, including differentiation of targeted metabolites from those compounds that share an identical monoisotopic mass and are of the same chemical class, as well as identification of metabolites that are not currently listed in available metabolite databases.1,3,4 The structural elucidation of a small-molecule metabolite can be a complex and time-consuming process.3,5 This is particularly true when de novo characterization is required (Figure 1) and even automated methods used to search tandem-MS (MS/MS) data against established metabolite databases only predict the metabolite’s structure.6 A putative chemical identification can be achieved by interrogating available metabolite databases with an experimentally derived accurate mass, m/z, or a molecular formula.3,7,8 Further confidence in the putative identification can be obtained by in silico database analyses using the targeted analyte’s experimental fragmentation pattern (MS/MS or MSn spectra).3,7,8 However, a confirmed structural identification is only achieved by demonstrating that the targeted metabolite has the same properties (accurate mass, MS/MS spectra, and retention time (RT)) as an authentic chemical standard under identical analytical conditions.3,7,8 Owing to the complexity of metabolic processes, a large number of small molecules observed in biological samples are not annotated in the available metabolite databases, nor do they have authentic chemical standards. In fact, more than 50% of the small molecules observed in four recent metabolomics studies were labeled as unidentified.9−12 This limitation in untargeted metabolomics studies results in an underestimation of the chemical diversity and biological importance of small molecules present in biological samples and underscores the need for continued elucidation of novel metabolite structures.
Figure 1.

Processes required for structural identification of molecular features (MFs) detected via untargeted LC–MS-based metabolomics and the different levels of identification based on guidelines provided by the Metabolomics Standards Initiatives.3,8 The accurate mass of an MF of interest is interrogated against existing databases, a match to one or more annotated metabolites provides a putative identification, level 3. MS/MS spectrum of a level 3 metabolite or MF with no matches to annotated metabolites still provides increased structural information. A direct match of the experimental MS/MS spectrum to that of an annotated metabolite provides a level 2 putative structural identification. A partial match of the experimental MS/MS spectrum to that associated with one or more annotated metabolites can be used to derive a hypothesis for the metabolite structure, and experimental approaches can be undertaken to further elucidate or confirm the structure. This can be an iterative approach. A direct match of the metabolite’s mass, MS/MS spectra, and RT to that of an authentic standard under identical analytical conditions provides for full confirmation of structural identification, level 1 identity. The inability to use experimental mass or MS/MS data to identify or elucidate a structure results in the MF being designated as an unknown compound, level 4.
Previously, application of untargeted liquid chromatography (LC)–MS-based metabolomics to select small-molecule biomarkers of treatment response in tuberculosis (TB) patients identified 12 candidate biomarkers.10 Seven of these small molecules, also referred to as MFs, were matched via their accurate masses to compounds in the METLIN metabolite database or Human Metabolome Database (HMDB), giving them putative identifications; however, none of the identifications was confirmed. One of these MFs (MF 202.1326), defined by an accurate mass of 202.1326 Da and an RT of 3.89 min, was given a putative identification of a dipeptide containing isoleucine/leucine and alanine.10 In this current study, efforts to fully elucidate the structure of this MF revealed that it was not a dipeptide, but a product with a previously unrecognized structure. MS/MS along with chemical and enzymatic synthesis provided a confirmed identity for the MF as N1-acetylisoputreanine, a catabolite of polyamine metabolism that had been predicted13,14 but had not been detected in human biological fluids before this study.
Results and Discussion
LC–MS/MS Investigation of a Structurally Undefined MF
MF 202.1326, a putative metabolite of urine with an experimentally determined accurate mass of 202.1326 Da and a predicted formula of C9H18N2O3, displayed relative shifts in abundance correlating with anti-TB therapy and was given a putative structural identification of a dipeptide containing isoleucine/leucine and alanine.10 An evaluation of a leucyl-alanine standard revealed an 11.097 min RT using reverse-phase chromatography, and this was significantly different from the 3.707 min RT of endogenous MF 202.1326 (Figure 2A). This not only established that MF 202.1326 was not leucyl-alanine, but that MF 202.1326 was unlikely to contain a nonpolar side chain like that of leucine and isoleucine.
Figure 2.

LC–MS and LC–MS/MS of MF 202.1326 to provide structural information. (A) Extracted ion chromatogram (EIC) of m/z 203.1390 from LC–MS data of human urine spiked with leucyl-alanine standard. The peak at 3.7 min is MF 202.1326. The peak at 11.1 min is leucyl–alanine. (B) LC–MS/MS spectra of MF 202.1326 at three collision energies; 10 V (top), 20 V (middle), and 40 V (bottom). (C) LC–MS/MS spectrum of MF 202.1326 (top) compared to that of N1-acetylspermine (middle) and N1,N12-diacetylspermine (bottom). All spectra were obtained with a collision energy of 20 V. The fragment ions m/z 100.076, 72.045, and 58.066 are present in the spectra of all three compounds.
To gain insight into the structure of MF 202.1326, we applied LC–MS/MS (Figure 2B). The fragment ions m/z 185.128, 126.091, 100.076, 72.045, and 58.066 were recurrent regardless of the collision energy applied, indicating that they were specific fragments originating from the intact molecule. The fragment ion m/z 100.076 was highly abundant even at lower collision energies. This was representative of fragmentation occurring at a highly labile bond such as a C–N bond.
Molecules with similar structures or of the same class can share identical fragment ions.15,16 To assess this possibility for MF 202.1326, we queried the National Institute of Standards and Technology (NIST) MS/MS spectral database to determine whether partial matches occurred between the MS/MS spectrum of MF 202.1326 and the annotated spectra of known compounds. A partial match to the MS/MS spectrum of N1-acetylspermine with fragment ions m/z 100.076, 72.045, and 58.066 was obtained. These common fragment ions are also present in the available METLIN and HMDB MS/MS spectra for two other acetylated polyamines, N1-acetylspermidine and N1,N12-diacetylspermine. Using authentic standards for N1-acetylspermine and N1,N12-diacetylspermine, we confirmed that these annotated fragment ions were replicated in MS/MS experiments with our instrument (Figure 2C). Interestingly, all three compounds shared the dominant m/z 100.076 fragment ion.
Establishing the Hypothesis for N1-Acetylisoputreanine as the Structure of MF 202.1326
Theoretical fragmentation of N1-acetylspermine indicated that the m/z 100.076 fragment ion originated from fragmentation of the C–N bond that separates the acetamidopropyl group and spermidine (Figure 3A). To demonstrate that the m/z 100.076 fragment ion of MF 202.1326 also represents an acetamidopropyl group, we targeted this product ion for further fragmentation using an improvised MS3 approach. Specifically, increased fragmentor voltage was applied to induce in-source fragmentation and generate the m/z 100.076 fragment ion for subsequent MS3 fragmentation in the collision cell.17,18 Throughout this article, MS3 refers to results obtained using this improvised MS3 approach. The MS3 fragmentation spectra of m/z 100.076 derived from MF 202.1326 and N1-acetylspermine were nearly identical (Figure 3B). This signified that both molecules possessed an acetamidopropyl group. Theoretical fragmentation of the acetamidopropyl group provided additional support for the structural identity of the m/z 100.076 fragment ion (Figure 3C). Specifically, the MS3 fragments m/z 58.066 and 43.018 would have resulted from fragmentation of the labile C–N separating the acetyl group and propylamine (Figure 3B,C). N1-Acetylspermine is a monoacetyl conjugate produced during polyamine metabolism. Acetylation of polyamines reduces the charge of these molecules and facilitates their export from the cell, as well as increases metabolic flux through the polyamine pathway.19,20 The presence of an acetamidopropyl group in MF 202.1326 led us to infer that it might also be involved in polyamine metabolism.
Figure 3.

MS3 analysis of the m/z 100.076 fragment ion of MF 202.1326 and N1-acetylspermine. (A) Structure of N1-acetylspermine and the predicted origin of the m/z 100.076 fragment ion based on theoretical fragmentation. (B) MS3 fragmentation of m/z 100.076 from MF 202.1326 (top) and N1-acetylspermine (bottom). (C) Theoretical fragmentation tree used to derive the structure of the m/z 100.076 fragment ion.
Typical fragmentation of a parent ion can generate a charged fragment and a corresponding neutral fragment, the latter of which is not detected in the MS/MS spectra. Thus, having determined that one portion of MF 202.1326 contained an acetamidopropyl group, a neutral loss fragment of 103.063 Da was hypothesized (Figure 4). The 103.063 Da neutral loss fragment was interrogated against the ChemSpider database, and 150 potential structures were matched to this mass, with γ-aminobutyric acid (GABA) being the highest ranked. GABA is also produced during polyamine metabolism13 leading us to hypothesize that C-3 of the acetamidopropyl group was linked to the sole nitrogen of GABA, creating a C–N bond in MF 202.1326 similar to that of N1-acetylspermine (compare Figures 3A and 4). Additional support for the predicted structure of MF 202.1326 was the m/z 185.128 fragment ion (Figure 2B) that was indicative of a neutral loss of water via fragmentation of the −OH group in GABA. This structure matched with a predicted, but never detected, catabolite of polyamine metabolism, N1-acetylisoputreanine13 (Figure 4).
Figure 4.
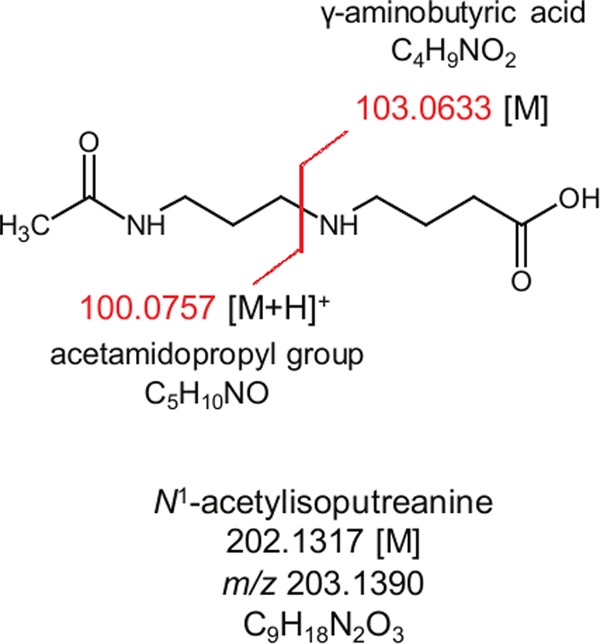
Hypothesized structure of MF 202.1326, N1-acetylisoputreanine. Fragmentation at the proximal C–N bond would yield an m/z 100.076 fragment ion [M + H]+ attributed to an acetamidopropyl group, and a neutral loss of 103.0633 Da [M] can be attributed to a hypothesized GABA constituent.
Confirmation of MF 202.1326 as N1-Acetylisoputreanine
Confirmation of the structural identity of MF 202.1326 as N1-acetylisoputreanine required an authentic chemical standard, but one was not commercially available. Thus, a combined enzymatic and chemical synthesis approach was employed to generate a standard compound (Figure 5A). This approach exploited a previously purified and enzymatically characterized amine oxidase, N1-acetylpolyamine oxidase (PAOX), which produces the reactive aldehyde, 3-acetamidopropanol, upon catabolism of N1-acetylspermine and N1-acetylspermidine.13,21 The addition of PAOX to N1-acetylspermine (Figure 5B) resulted in the formation of 3-acetamidopropanol and spermidine (Figure 5C), and the addition of excess GABA in the presence of the reducing agent allowed the formation of N1-acetylisoputreanine (Figure 5D). In the absence of PAOX, GABA, or a reducing agent, there was no formation of N1-acetylisoputreanine in the positive mode (data not shown). The MS/MS spectra for the synthetic compound and the endogenous MF 202.1326 were identical, confirming that the unknown metabolite is N1-acetylisoputreanine (Figure 6B). Further confirmation was achieved by spiking the synthetic compound into urine, which yielded an increase in the endogenous MF 202.1326 peak (Figure 6A).
Figure 5.

Enzymatic and chemical synthesis of N1-acetylisoputreanine. (A) Diagram of the method used for enzymatic formation of 3-acetamidopropanol (box, solid line) and the subsequent generation of N1-acetylisoputreanine by the addition of GABA (box, dotted line). Reactions were performed in a single tube with sequential addition of reagents. (B–D) EICs from LC–MS analyses at different stages of the reaction. The m/z values of 245.234, 146.166, 116.071, and 203.139 were used in the EIC to monitor for N1-acetylspermine, spermidine, 3-acetamidopropanol, and N1-acetylisoputreanine, respectively. (B) N1-acetylspermine before the addition of PAOX. (C) Analysis of products after incubation with PAOX. (D) Analysis of products after reaction with GABA.
Figure 6.

LC–MS and MS/MS confirmation of MF 202.1326 as N1-acetylisoputreanine. (A) EIC for m/z 203.1390 from patient urine, synthetic standard reaction mixture, and patient urine spiked with synthetic standard reaction mixture. (B) MS/MS spectra for MF 202.1326 and synthetic standard at collision energies of 10 V (top two panels) and 20 V (bottom two panels).
Both N1-Acetylisoputreanine and N1-Acetylisoputreanine-γ-lactam Are Endogenous Components of Human Urine
There has been no previous report of N1-acetylisoputreanine in biological samples; however, the γ-lactam form of N1-acetylisoputreanine, N-(3-acetamidopropyl)pyrrolidin-2-one, was previously described and quantified in urine.22,23 One possibility for N1-acetylisoputreanine not being detected in the previous studies was the use of gas chromatography (GC)–MS to detect metabolites extracted from urine without prior derivatization. Owing to the polarity of the carboxylic acid, N1-acetylisoputreanine would have lacked the proper volatility for GC–MS or failed to be extracted with dichloromethane. It is also noted that other studies describe the detection of nonconjugated isoputreanine in the urine of animals following their exposure to spermidine.24−26 However, the urine was subjected to acid hydrolysis before detection, and this would have hydrolyzed the γ-lactam ring and removed acetyl groups; thus, it was concluded that isoputreanine-γ-lactam and N1-acetylisoputreanine-γ-lactam were the natural excretory products following oxidative deamination of spermidine and N1-acetylspermidine, respectively.14
We wanted to confirm the presence of N1-acetylisoputreanine-γ-lactam in human urine using our analytical methods. A peak with the m/z value of 185.129 corresponding to N1-acetylisoputreanine-γ-lactam was present in the urine (Figure 7A). This m/z 185.129 peak had the same RT and MS/MS fragmentation as those of a synthetic standard and addition of the standard compound to the urine resulted in an increase in the endogenous peak (Figure 7A,B). Because N1-acetylisoputreanine-γ-lactam is presumed to be the natural excretory product, we assessed whether N1-acetylisoputreanine was a potential artifact of the analytical method we applied. Analysis of synthetic N1-acetylisoputreanine-γ-lactam on its own using our analytical method did not result in an additional peak for N1-acetylisoputreanine (Figure 7A). This provided evidence that hydrolysis of the γ-lactam ring was not occurring during the assay. There are also enzymes present in the urine that could lead to enzymatic interconversion between N1-acetylisoputreanine and N1-acetylisoputreanine-γ-lactam.27 Thus, fresh human urine was evaluated for enzymatic interconversion. The addition of N1-acetylisoputreanine-γ-lactam to fresh urine followed by incubation at room temperature for 24 h did not alter the abundance of N1-acetylisoputreanine (Figure 7A), and the levels of endogenous N1-acetylisoputreanine and N1-acetylisoputreanine-γ-lactam did not noticeably change over 24 h (Table 1). If enzymatic interconversion between the two compounds had occurred, a decrease in the peak area of one compound and a corresponding increase in the peak area of the other would have been observed. This did not occur (Table 1). These evaluations provide strong evidence that N1-acetylisoputreanine and N1-acetylisoputreanine-γ-lactam are endogenous components of human urine; there is no enzymatic interconversion; and N1-acetylisoputreanine does not result from spontaneous hydrolysis of the ring structure of N1-acetylisoputreanine-γ-lactam.
Figure 7.

LC–MS and MS/MS analysis of N1-acetylisoputreanine-γ-lactam in patient urine. (A) EIC for m/z 185.1285 and m/z 203.1390 (inset) from N1-acetylisoputreanine-γ-lactam synthetic standard, patient urine spiked with N1-acetylisoputreanine-γ-lactam synthetic standard, and patient urine. (B) MS/MS spectrum comparison for N1-acetylisoputreanine-γ-lactam from urine and synthetic standard.
Table 1. Stability (24 h) of Endogenous N1-Acetylisoputreanine and N1-Acetylisoputreanine-γ-lactam in Fresh Urine at Room Temperature.
|
N1-acetylisoputreanine |
N1-acetylisoputreanine-γ-lactam |
|||||
|---|---|---|---|---|---|---|
| peak
area |
peak
area |
|||||
| 0 h | 24 h | RPDa | 0 h | 24 h | RPDa | |
| sample 1 | 8 502 132 | 7 852 119 | 7.95 | 17 655 963 | 17 096 067 | 3.22 |
| sample 2 | 6 413 762 | 6 056 531 | 5.73 | 13 723 175 | 13 838 616 | –0.84 |
| sample 3 | 10 029 551 | 9 573 870 | 4.65 | 17 114 405 | 16 497 977 | 3.67 |
| sample 4 | 2 053 592 | 1 954 062 | 4.97 | 4 566 251 | 4 488 474 | 1.72 |
Relative percent difference.
Origin of N1-Acetylisoputreanine
The origin of N1-acetylisoputreanine has not been determined due to its unconfirmed existence before this study. However, the origin of N1-acetylisoputreanine-γ-lactam has been investigated. Aminoguanidine treatment of rats greatly diminished the urinary levels of N1-acetylisoputreanine-γ-lactam.22,28 Because aminoguanidine is an inhibitor of copper-dependent amino oxidases (CuAO), it was concluded that N1-acetylisoputreanine-γ-lactam is formed due to amine oxidation of N1-acetylspermidine by CuAO, followed by aldehyde dehydrogenase (ALDH) activity (Figure 8).13,22,28 On the basis of this, we hypothesize that N1-acetylisoputreanine is also formed due to the action of CuAO and that a separate ALDH enzyme results in N1-acetylisoputreanine rather than the γ-lactam form (Figure 8).29 Further studies are required to confirm the enzymes involved in the formation of N1-acetylisoputreanine and to determine the mechanisms underlying its association with TB treatment.
Figure 8.

Polyamine interconversion cycle including proposed pathways for the formation of N1-acetylisoputreanine and N1-acetylisoputreanine-γ-lactam. Adapted from ref (13).
Polyamine metabolism, a metabolic pathway with increasing interest, has been examined in relation to cancer and other diseases using metabolomics-based techniques.30−35 The polycationic property of polyamines enables these metabolites to regulate biological processes through reversible ionic interactions with negatively charged molecules such as nucleic acids, proteins, and phospholipids.36−41 Thus, polyamines act as important factors in cell growth and differentiation, requiring their levels to be tightly regulated via the polyamine interconversion cycle and cellular transport (Figure 8).13,42 Therefore, a flux in polyamine levels during a disease state likely reflects a perturbation of these homeostasis mechanisms. Elucidation of all products of polyamine metabolism will allow for a better understanding of their biological roles and how they are regulated during disease.
Conclusions
A combination of LC–MS fragmentation along with enzymatic and chemical approaches was utilized to confirm the structure of a significant but previously unidentified metabolite, N1-acetylisoputreanine. The presented data established that both N1-acetylisoputreanine and the previously described N1-acetylisoputreanine-γ-lactam are endogenous products detectable in human urine. In addition, the results from this study demonstrated that metabolite identification based on database interrogation of MS data alone has significant limitations and that novel metabolites belonging to established pathways are present in biological fluid and should not be presumed as an artifact of sample analyses. Furthermore, this work underscores the importance of confirming metabolite structural identities.
Experimental Section
Materials
Glycine, N1-acetylspermine, GABA, N-(3-aminopropyl)pyrrolidin-2-one, acetyl chloride, and sodium triacetoxyborohydride were obtained from Sigma Aldrich (St. Louis, MO). LC–MS grade water, methanol, and acetonitrile were from Honeywell Burdick & Jackson (Muskegon, MI). Formic acid was obtained from Fischer Scientific (Pittsburgh, PA). Bulk human urine was obtained from Gemini Bio-Products (West Sacramento, CA). Fresh human urine was obtained from healthy donors at Colorado State University. Patient urine for metabolite identification was from a subset of the samples used for metabolite discovery in the previously published study.10
LC and MS Analysis
Chromatography was based on the previously described method using an Agilent 1200 series high-performance LC system (Agilent Technologies; Palo Alto, CA) coupled with an Atlantis T3 reverse-phase C18 3.5 μm column (2.1 mm × 150 mm; Waters Corp., Milford, MA).10 MS was performed using an Agilent 6520 quadrupole time of flight LC–MS instrument equipped with an Agilent electrospray ionization source that was operated in the positive ionization mode. The operating conditions for the mass spectrometer were: gas temperature, 300 °C; drying gas, 8 L/min; nebulizer, 45 lb/in.2; capillary voltage, 2000 V; fragmentation energy for MS and MS/MS, 120 V; fragmentation energy to generate the m/z 100.0757 product ion, 200 V; skimmer voltage, 60 V; and octapole RF setting, 750 V. Specified ions were subjected to MS/MS fragmentation (isolation width of 1.3 Da) by collision-induced dissociation at set collision energies (5–40 V). Data were collected in the profile and centroid modes at a scan rate of 2.0 spectra/s and a scan range of m/z 50–1700 using the Agilent MassHunter Data Acquisition software.
Purification of PAOX
A plasmid construct (pET15b/hPAO-1) was transformed into Escherichia coli BL21(DE3) STAR. The expression of hPAO-1 and purification of recombinant PAOX was performed as previously described.21 Nickel-nitrilotriacetic acid (Ni-NTA) resin (Qiagen; Valencia, CA) was used for immobilized metal ion affinity chromatography. Purified protein was dialyzed in 50 mM Tris–HCl (pH 8.0), 250 mM NaCl, 0.1 mM ethylenediaminetetraacetic acid, 1 mM dithiothreitol, and 0.2 μM flavin adenine dinucleotide, and stored at 4 °C.
Synthesis of N1-Acetylisoputreanine and N1-Acetylisoputreanine-γ-lactam
A modification of the previously described enzyme assay was applied in the synthesis of N1-acetylisoputreanine.21N1-acetylspermine at 0.25 mM was combined with purified recombinant PAOX (0.6 mg/mL) in 88 mM glycine buffer (pH 8.0) for 30 min at room temperature. GABA (final concentration of 10 mM) was subsequently added. An aliquot (500 μL) of this mixture was added to 4.5 mL of 90% ethanol containing 1% (w/v) sodium triacetoxyborohydride and incubated at RT for 4 h. The reaction was dried in a Savant SpeedVac and resuspended in 500 μL of water and stored at 4 °C until LC–MS analysis. Before LC–MS analysis, the synthetic compound was diluted 1:10 in water or human urine.
N1-Acetylisoputreanine-γ-lactam was synthesized as previously described.23 Acetylation was performed with N-(3-aminopropyl)pyrrolidin-2-one (0.75 M) and acetyl chloride (0.75 M) in methanol and 0.5 M PBS (1:1) adjusted to pH 7.0 with sodium hydroxide. The reaction products were extracted with dichloromethane, dried, suspended in 2 mL of LC–MS grade water and stored at 4 °C before LC–MS analyses, the synthetic compound was diluted 1:100 in water or human urine.
Evaluation of N1-Acetylisoputreanine and N1-Acetylisoputreanine-γ-lactam in Fresh Urine
Fresh urine obtained from healthy donors was stored at 4 °C and processed within 4 h of collection. An initial aliquot of fresh urine was stored at −20 °C as the 0 h time point sample. To a 90 μL aliquot of urine, either 10 μL of water or N1-acetylisoputreanine-γ-lactam was added, and the sample was kept at room temperature for 24 h. The 0 and 24 h time point samples were analyzed by LC–MS. The relative abundance for N1-acetylisoputreanine and N1-acetylisoputreanine-γ-lactam was determined as the peak area on the basis of an EIC of their respective [M + H]+m/z values. The peak areas for the 24 h time point sample were corrected by dividing the peak area by 0.9. The relative percent difference between the 0 (x1) and the 24 h (x2) time points was calculated for each molecule using the following equation
Data Analyses
The LC–MS/MS spectra were manually interrogated against available MS/MS spectra in the METLIN metabolite database, HMDB, and NIST.43−45 Theoretical fragment ions for individual structures were obtained using ACD/MS Fragmenter (Advanced Chemistry Development, Inc.; Toronto, ON, Canada).
The MS/MS spectra for N1-acetylisoputreanine and N1-acetylisoputreanine-γ-lactam have been submitted to Metabolomics Workbench and will be submitted to METLIN and HMDB.
Acknowledgments
This work was funded by the National Institute of Allergy and Infectious Diseases contract HHSN266200700022C (NO1AI70022) and grant U01 AI115619, and National Cancer Institute grant R01 CA204345. We thank Dr. Kristofor Webb for discussions and technical assistance regarding LC–MS.
Author Contributions
B.L.F., S.M., M.R.M., and J.T.B. designed the experiments. B.L.F. performed the experiments. B.L.F., D.K.F., R.A.C., and J.T.B. analyzed and interpreted the results of the experiments. B.L.F. prepared the figures. B.L.F. drafted the manuscript. B.L.F., S.M., D.K.F., M.R.M., R.A.C., and J.T.B. edited and revised the manuscript. B.L.F., S.M., D.K.F., M.R.M., R.A.C., and J.T.B. approved the final version of the manuscript.
The authors declare no competing financial interest.
References
- Patti G. J.; Yanes O.; Siuzdak G. Metabolomics: the apogee of the omics trilogy. Nat. Rev. Mol. Cell Biol. 2012, 13, 263. 10.1038/nrm3314. [DOI] [PMC free article] [PubMed] [Google Scholar]
- Dunn W. B.; Broadhurst D. I.; Atherton H. J.; Goodacre R.; Griffin J. L. Systems level studies of mammalian metabolomes: the roles of mass spectrometry and nuclear magnetic resonance spectroscopy. Chem. Soc. Rev. 2011, 40, 387. 10.1039/B906712B. [DOI] [PubMed] [Google Scholar]
- Dunn W. B.; Erban A.; Weber R. J. M.; Creek D. J.; Brown M.; Breitling R.; Hankemeier T.; Goodacre R.; Neumann S.; Kopka J.; et al. Mass appeal: metabolite identification in mass spectrometry-focused untargeted metabolomics. Metabolomics 2013, 9, S44. 10.1007/s11306-012-0434-4. [DOI] [Google Scholar]
- Wishart D. S. Advances in metabolite identification. Bioanalysis 2011, 3, 1769. 10.4155/bio.11.155. [DOI] [PubMed] [Google Scholar]
- Bowen B. P.; Northen T. R. Dealing with the Unknown: Metabolomics and Metabolite Atlases. J. Am. Soc. Mass Spectrom. 2010, 21, 1471. 10.1016/j.jasms.2010.04.003. [DOI] [PubMed] [Google Scholar]
- Dührkop K.; Shen H. B.; Meusel M.; Rousu J.; Bocker S. Searching molecular structure databases with tandem mass spectra using CSI:FingerID. Proc. Natl. Acad. Sci. U.S.A. 2015, 112, 12580. 10.1073/pnas.1509788112. [DOI] [PMC free article] [PubMed] [Google Scholar]
- Brown M.; Wedge D. C.; Goodacre R.; Kell D. B.; Baker P. N.; Kenny L. C.; Mamas M. A.; Neyses L.; Dunn W. B. Automated workflows for accurate mass-based putative metabolite identification in LC/MS-derived metabolomic datasets. Bioinformatics 2011, 27, 1108. 10.1093/bioinformatics/btr079. [DOI] [PMC free article] [PubMed] [Google Scholar]
- Sumner L. W.; Amberg A.; Barrett D.; Beale M. H.; Beger R.; Daykin C. A.; Fan T. W. M.; Fiehn O.; Goodacre R.; Griffin J. L.; et al. Proposed minimum reporting standards for chemical analysis. Metabolomics 2007, 3, 211. 10.1007/s11306-007-0082-2. [DOI] [PMC free article] [PubMed] [Google Scholar]
- Das M. K.; Bishwal S. C.; Das A.; Dabral D.; Badireddy V. K.; Pandit B.; Varghese G. M.; Nanda R. K. Deregulated tyrosine-phenylalanine metabolism in pulmonary tuberculosis patients. J. Proteome Res. 2015, 14, 1947. 10.1021/acs.jproteome.5b00016. [DOI] [PubMed] [Google Scholar]
- Mahapatra S.; Hess A. M.; Johnson J. L.; Eisenach K. D.; DeGroote M. A.; Gitta P.; Joloba M. L.; Kaplan G.; Walzl G.; Boom W. H.; et al. A metabolic biosignature of early response to anti-tuberculosis treatment. BMC Infect. Dis. 2014, 14, 53. 10.1186/1471-2334-14-53. [DOI] [PMC free article] [PubMed] [Google Scholar]
- Kind T.; Cho E.; Park T. D.; Deng N.; Liu Z. Q.; Lee T.; Fiehn O.; Kim J. Interstitial Cystitis-Associated Urinary Metabolites Identified by Mass-Spectrometry Based Metabolomics Analysis. Sci. Rep. 2016, 6, 39227 10.1038/srep39227. [DOI] [PMC free article] [PubMed] [Google Scholar]
- Boelaert J.; Lynen F.; Glorieux G.; Schepers E.; Neirynck N.; Vanholder R. Metabolic profiling of human plasma and urine in chronic kidney disease by hydrophilic interaction liquid chromatography coupled with time-of-flight mass spectrometry: a pilot study. Anal. Bioanal. Chem. 2017, 409, 2201. 10.1007/s00216-016-0165-x. [DOI] [PubMed] [Google Scholar]
- Seiler N. Catabolism of polyamines. Amino Acids 2004, 26, 217. 10.1007/s00726-004-0070-z. [DOI] [PubMed] [Google Scholar]
- Seiler N.; Knödgen B.; Haegele K. N-(3-aminopropyl)pyrrolidin-2-one, a product of spermidine catabolism in vivo. Biochem. J. 1982, 208, 189. 10.1042/bj2080189. [DOI] [PMC free article] [PubMed] [Google Scholar]
- Scheubert K.; Hufsky F.; Bocker S. Computational mass spectrometry for small molecules. J. Cheminf. 2013, 5, 12. 10.1186/1758-2946-5-12. [DOI] [PMC free article] [PubMed] [Google Scholar]
- McLafferty F. W.Interpretation of Mass Spectra, 4th ed.; University Science Books: Mill Valley, CA, 1993. [Google Scholar]
- Abdelhameed A. S.; Attwa M. W.; Abdel-Aziz H. A.; Kadi A. A. Induced in-source fragmentation pattern of certain novel (1Z,2E)-N-(aryl)propanehydrazonoyl chlorides by electrospray mass spectrometry (ESI-MS/MS). Chem. Cent. J. 2013, 7, 16. 10.1186/1752-153X-7-16. [DOI] [PMC free article] [PubMed] [Google Scholar]
- Putschew A.; Jekel M. Induced in-source fragmentation for the selective detection of organic bound iodine by liquid chromatography/electrospray mass spectrometry. Rapid Commun. Mass Spectrom. 2003, 17, 2279. 10.1002/rcm.1180. [DOI] [PubMed] [Google Scholar]
- Seiler N. Functions of polyamine acetylation. Can. J. Physiol. Pharmacol. 1987, 65, 2024. 10.1139/y87-317. [DOI] [PubMed] [Google Scholar]
- Kramer D. L.; Diegelman P.; Jell J.; Vujcic S.; Merali S.; Porter C. W. Polyamine acetylation modulates polyamine metabolic flux, a prelude to broader metabolic consequences. J. Biol. Chem. 2008, 283, 4241. 10.1074/jbc.M706806200. [DOI] [PubMed] [Google Scholar]
- Wang Y.; Hacker A.; Murray-Stewart T.; Frydman B.; Valasinas A.; Fraser A. V.; Woster P. M.; Casero R. A. Properties of recombinant human N-1-acetylpolyamine oxidase (hPAO): potential role in determining drug sensitivity. Cancer Chemother. Pharmacol. 2005, 56, 83. 10.1007/s00280-004-0936-5. [DOI] [PubMed] [Google Scholar]
- Hessels J.; Kingma A. W.; Sturkenboom M. C.; Elzinga H.; van den Berg G. A.; Muskiet F. A. Gas chromatographic determination of N-acetylisoputreanine-gamma-lactam, a unique catabolite of N1-acetylspermidine. J. Chromatogr. 1991, 563, 1. 10.1016/0378-4347(91)80272-E. [DOI] [PubMed] [Google Scholar]
- van den Berg G. A.; Kingma A. W.; Elzinga H.; Muskiet F. A. Determination of N-(3-acetamidopropyl)pyrrolidin-2-one, a metabolite of spermidine, in urine by isotope dilution mass fragmentography. J. Chromatogr. 1986, 383, 251. 10.1016/S0378-4347(00)83471-4. [DOI] [PubMed] [Google Scholar]
- Noto T.; Tanaka T.; Nakajima T. Urinary metabolites of polyamines in rats. J. Biochem. 1978, 83, 543. 10.1093/oxfordjournals.jbchem.a131942. [DOI] [PubMed] [Google Scholar]
- Nakajima T.; Noto T.; Kato N. Isolation and identification of polyamine metabolites in urine of animals. Physiol. Chem. Phys. 1980, 12, 401. [PubMed] [Google Scholar]
- Asatoor A. M. Isolation and characterization of a new urinary metabolite derived from spermidine. Biochim. Biophys. Acta 1979, 586, 55. 10.1016/0304-4165(79)90404-5. [DOI] [Google Scholar]
- Mattenheimer H.; Burchardt U. In Urinary Enzymes: in Clinical and Experimental Medicine; Jung K., Mattenheimer H., Burchardt U., Eds.; Springer: Berlin, 1992. [Google Scholar]
- Hessels J.; Ferwerda H.; Kingma A. W.; Muskiet F. A. J. Inhibition of polyamine oxidase in rats improves the sensitivity of urinary polyamines as markers for cell-death. Biochem. J. 1990, 266, 843. [PMC free article] [PubMed] [Google Scholar]
- Vasiliou V.; Nebert D. W. Analysis and update of the human aldehyde dehydrogenase (ALDH) gene family. Hum. Genomics 2005, 2, 138. 10.1186/1479-7364-2-2-138. [DOI] [PMC free article] [PubMed] [Google Scholar]
- Byun J. A.; Lee S. H.; Jung B. H.; Choi M. H.; Moon M. H.; Chung B. C. Analysis of polyamines as carbamoyl derivatives in urine and serum by liquid chromatography-tandem mass spectrometry. Biomed. Chromatogr. 2008, 22, 73. 10.1002/bmc.898. [DOI] [PubMed] [Google Scholar]
- Liu R.; Li Q.; Ma R.; Lin X. H.; Xu H. R.; Bi K. S. Determination of polyamine metabolome in plasma and urine by ultrahigh performance liquid chromatography-tandem mass spectrometry method: Application to identify potential markers for human hepatic cancer. Anal. Chim. Acta 2013, 791, 36. 10.1016/j.aca.2013.06.044. [DOI] [PubMed] [Google Scholar]
- Johnson C. H.; Dejea C. M.; Edler D.; Hoang L. T.; Santidrian A. F.; Felding B. H.; Ivanisevic J.; Cho K.; Wick E. C.; Hechenbleikner E. M.; et al. Metabolism links bacterial biofilms and colon carcinogenesis. Cell Metab. 2015, 21, 891. 10.1016/j.cmet.2015.04.011. [DOI] [PMC free article] [PubMed] [Google Scholar]
- Nelson T. M.; Borgogna J. L. C.; Brotman R. M.; Ravel J.; Walk S. T.; Yeoman C. J. Vaginal biogenic amines: biomarkers of bacterial vaginosis or precursors to vaginal dysbiosis?. Front. Physiol. 2015, 6, 253. 10.3389/fphys.2015.00253. [DOI] [PMC free article] [PubMed] [Google Scholar]
- Graham S. F.; Chevallier O. P.; Elliott C. T.; Holscher C.; Johnston J.; McGuinness B.; Kehoe P. G.; Passmore A. P.; Green B. D. Untargeted Metabolomic Analysis of Human Plasma Indicates Differentially Affected Polyamine and L-Arginine Metabolism in Mild Cognitive Impairment Subjects Converting to Alzheimer’s Disease. PLoS One 2015, 10, e0119452 10.1371/journal.pone.0119452. [DOI] [PMC free article] [PubMed] [Google Scholar]
- Grasemann H.; Shehnaz D.; Enomoto M.; Leadley M.; Belik J.; Ratjen F. L-Ornithine Derived Polyamines in Cystic Fibrosis Airways. PLoS One 2012, 7, e46618 10.1371/journal.pone.0046618. [DOI] [PMC free article] [PubMed] [Google Scholar]
- Wallace H. M.; Fraser A. V.; Hughes A. A perspective of polyamine metabolism. Biochem. J. 2003, 376, 1. 10.1042/bj20031327. [DOI] [PMC free article] [PubMed] [Google Scholar]
- Kurata H. T.; Marton L. J.; Nichols C. G. The polyamine binding site in inward rectifier K+ channels. J. Gen. Physiol. 2006, 127, 467. 10.1085/jgp.200509467. [DOI] [PMC free article] [PubMed] [Google Scholar]
- Ha H. C.; Sirisoma N. S.; Kuppusamy P.; Zweier J. L.; Woster P. M.; Casero R. A. The natural polyamine spermine functions directly as a free radical scavenger. Proc. Natl. Acad. Sci. U.S.A. 1998, 95, 11140. 10.1073/pnas.95.19.11140. [DOI] [PMC free article] [PubMed] [Google Scholar]
- Celano P.; Baylin S. B.; Casero R. A. Polyamines differentially modulate the transcription of growth-associated genes in human colon carcinoma cells. J. Biol. Chem. 1989, 264, 8922. [PubMed] [Google Scholar]
- Zhang M.; Caragine T.; Wang H.; Cohen P. S.; Botchkina G.; Soda K.; Bianchi M.; Ulrich P.; Cerami A.; Sherry B.; et al. Spermine inhibits proinflammatory cytokine synthesis in human mononuclear cells: a counterregulatory mechanism that restrains the immune response. J. Exp. Med. 1997, 185, 1759. 10.1084/jem.185.10.1759. [DOI] [PMC free article] [PubMed] [Google Scholar]
- Schuber F. Influence of polyamines on membrane functions. Biochem. J. 1989, 260, 1. 10.1042/bj2600001. [DOI] [PMC free article] [PubMed] [Google Scholar]
- Murray-Stewart T. R.; Woster P. M.; Casero R. A. Targeting polyamine metabolism for cancer therapy and prevention. Biochem. J. 2016, 473, 2937. 10.1042/BCJ20160383. [DOI] [PMC free article] [PubMed] [Google Scholar]
- Smith C. A.; O’Maille G.; Want E. J.; Qin C.; Trauger S. A.; Brandon T. R.; Custodio D. E.; Abagyan R.; Siuzdak G. METLIN: a metabolite mass spectral database. Ther. Drug Monit. 2005, 27, 747. 10.1097/01.ftd.0000179845.53213.39. [DOI] [PubMed] [Google Scholar]
- Wishart D. S.; Jewison T.; Guo A. C.; Wilson M.; Knox C.; Liu Y.; Djoumbou Y.; Mandal R.; Aziat F.; Dong E.; et al. HMDB 3.0--The Human Metabolome Database in 2013. Nucleic Acids Res. 2013, 41, D801. 10.1093/nar/gks1065. [DOI] [PMC free article] [PubMed] [Google Scholar]
- Simón-Manso Y.; Lowenthal M. S.; Kilpatrick L. E.; Sampson M. L.; Telu K. H.; Rudnick P. A.; Mallard W. G.; Bearden D. W.; Schock T. B.; Tchekhovskoi D. V.; et al. Metabolite profiling of a NIST Standard Reference Material for human plasma (SRM 1950): GC-MS, LC-MS, NMR, and clinical laboratory analyses, libraries, and web-based resources. Anal. Chem. 2013, 85, 11725. 10.1021/ac402503m. [DOI] [PubMed] [Google Scholar]