Abstract
Accurate and fast extraction of lung volumes from computed tomography (CT) scans remains in a great demand in the clinical environment because the available methods fail to provide a generic solution due to wide anatomical variations of lungs and existence of pathologies. Manual annotation, current gold standard, is time consuming and often subject to human bias. On the other hand, current state-of-the-art fully automated lung segmentation methods fail to make their way into the clinical practice due to their inability to efficiently incorporate human input for handling misclassifications and praxis. This paper presents a lung annotation tool for CT images that is interactive, efficient, and robust. The proposed annotation tool produces an ”‘as accurate as possible” initial annotation based on the fuzzy-connectedness image segmentation, followed by efficient manual fixation of the initial extraction if deemed necessary by the practitioner. To provide maximum flexibility to the users, our annotation tool is supported in three major operating systems (Windows, Linux, and the Mac OS X). The quantitative results comparing our free software with commercially available lung segmentation tools show higher degree of consistency and precision of our software with a considerable potential to enhance the performance of routine clinical tasks.
I. INTRODUCTION
Lung related diseases are one of the leading causes of death worldwide. The American Lung Association estimated over 400,000 deaths per year in the United States alone linked to lung diseases [1]. For non-invasive diagnosis of lung diseases, computed tomography (CT) is the current standard in routine clinical environment. With the increased exposure of computer-assisted diagnosis methods, automated analysis tools are often sought for quick and accurate diagnosis and quantification [2], [3]. Specific to pulmonary diseases, robust and accurate tools are needed to extract information pertaining to the lungs. The delineation of lungs from a CT scan is mostly done manually by the expert in the routine clinics. Although a lot of interest has been shown lately in developing automated methods for lung segmentation such as [4], [5], [6], [7] to name a few, these methods usually fail to gain popularity in practice due to pulmonary abnormalities and also because of tradition and praxis. Additionally, most methods presented in the literature lack an accompanied user-friendly application that can be tested and evaluated by the practitioners since most of these methods require complex parameter adjustments; therefore, it becomes very difficult for a practitioner without enough knowledge of the underlying algorithm. Also most applications allow only the choice of accepting and rejecting the automated quantification; the user in these cases typically does not have the option of correcting the misclassification but have to reject it altogether. Consequently, most current state-of-the-art methods for pulmonary analysis do not gain popularity in the clinical environment. Commercially available software, on the contrary, come with a hefty price tag and usually have very specific hardware and software requirements.
In this paper, we present a robust, fast, and flexible single-click solution to lung-field annotation in CT images. The presented software, CIDI-Lung-Seg, combines manual and automated annotation thus providing what can be considered a computer-aided annotation and quantification. In contrast to completely automated approaches, CIDI-Lung-Seg provides an initial estimation of the lung-field based on region growing-based FC segmentation algorithm, the details of the algorithm can be found in [8]. The initial annotation can be subsequently modified if deemed necessary by the practitioner. In addition, the software does not require any specific operating system, software, or hardware; since it has been made available in Microsoft Windows, Mac OS X, and linux. To make this manuscript self-contained, a brief outline of the methodology is presented in Section II. Section III describes the software, while the performance evaluation with the commercial software tools is presented in Section IV. The paper is concluded in Section V with a discussion and future directions.
II. METHODS
The algorithm driving the CIDI-Lung-Seg is summarized below; herein, we provide a brief summary of the algorithm. The initial lung parenchyma extraction is performed by adapting the fuzzy-connectedness (FC) image segmentation algorithm [9], [10]. The initial phase consists of two primary stages: (i) seed selection for FC, and (ii) FC segmentation. The CIDI-Lung-Seg software can identify seed locations automatically as well as it allows the user to manually select them if desired (Fig. 1). These two steps are explained in the following subsections.
Fig. 1.
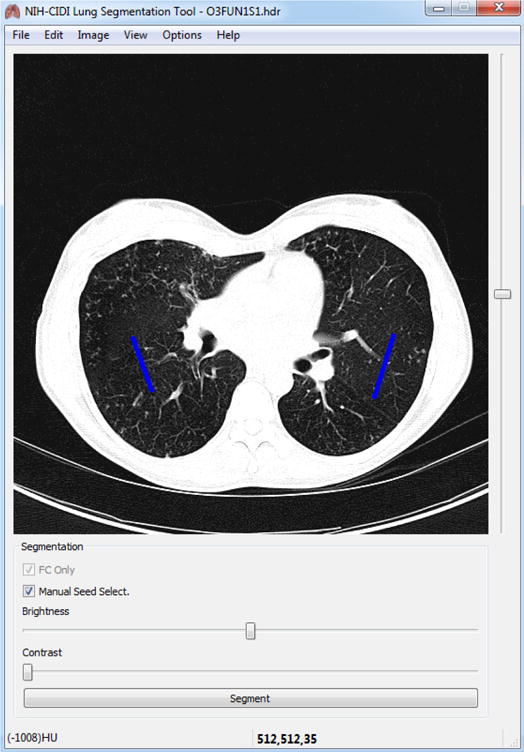
Manual seed selection in CIDI-Lung-Seg. Single-stroke painted line (shown in blue) are used as seeds for left and right lungs.
A. Automatic Seed selection and Initial FC segmentation
Fig. 2 summarizes the initial lung annotation process using the FC algorithm. To annotate both lungs, the FC requires two initial seed points sl, and sr, located in the left and right lung parenchyma respectively. As mentioned earlier, these seed points can be manually assigned by users or can be extracted in a fully automated manner. The software assumes the intensity values of the target CT image to be in Hounsfield units (HU). For automatic seed localization, we obtain candidate seeds from a region through a strict thresholding. For a target CT image I, the methods started by extracting the geometrical markers, i.e., the skin boundary and rib cage from the image to automatically locate the lung region. The final seed selection is done using the threshold operator over CT attenuation values for strictly normal lung parenchyma (HU: −700 through −400, mean ≈ −550). Once most robust normal (healthy) regions in left and right lungs are identified, the voxels belonging to the region having the minimum HU values are selected as seed locations sl and sr respectively:
| (1) |
where denotes the location of the voxel(s), and . In addition to the seeds, the FC algorithm requires the mean m and the variance σ of the target region(s). These values are empirically adjusted in the software to the default values corresponding to normal lung parenchyma, i.e., m = −550 HU, and σ = 150 HU after analyzing hundreds of CT images from wide variety of sources. Once the seeds are identified and parameters adjusted, FC delineation is performed. It is important to note here that, the entire procedure is performed in the user interface using a single click unless users prefer to input seed location themselves. Fig. 3 shows the annotation produced by CIDI-Lung-Seg in axial, coronal, and sagittal planes. Fig. 4 shows 3D rendering of the annotation using the software’s rendering module.
Fig. 2.
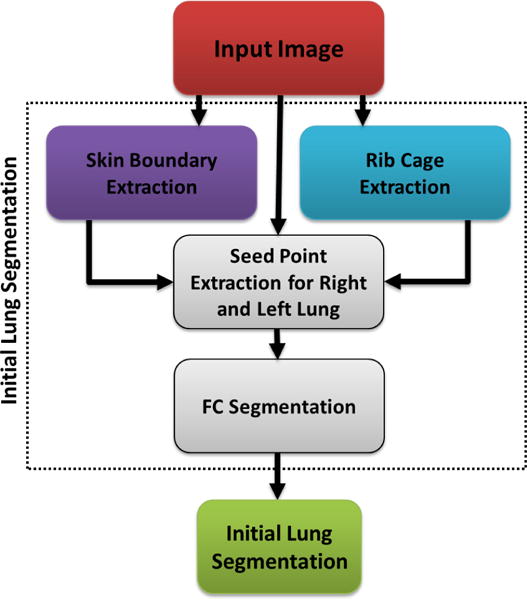
Flowchart explaining the initial FC annotation.
Fig. 3.

Annotated lung (shown in blue) from CT image viewed in CIDI-Lung-Seg (a) axial plane, (b) coronal plane, and (c) sagittal plane.
Fig. 4.
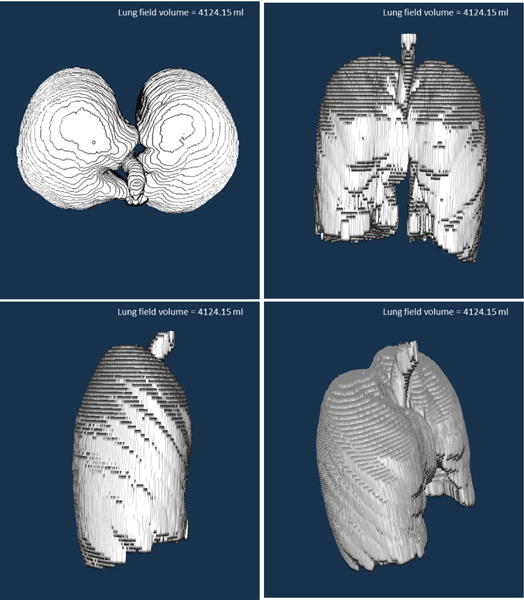
3D rendering of the annotation in CIDI-Lung-Seg.
B. Refinement
Once the initial lung regions are obtained, the annotation results are presented to the user. As shown in the results section, the initial results already provide a normal lung parenchyma for the target with the initial volume estimate. Any refinement (i.e., addition or deletion) in the initial boundaries can be easily incorporated by manual painting tool as shown in Fig. 5. Once the annotation is finalized it can be saved (ANALYZE 7.5 NifTI format) for subsequent analysis. The software currently supports NifTI format, more formats will be supported in the future releases of the software.
Fig. 5.
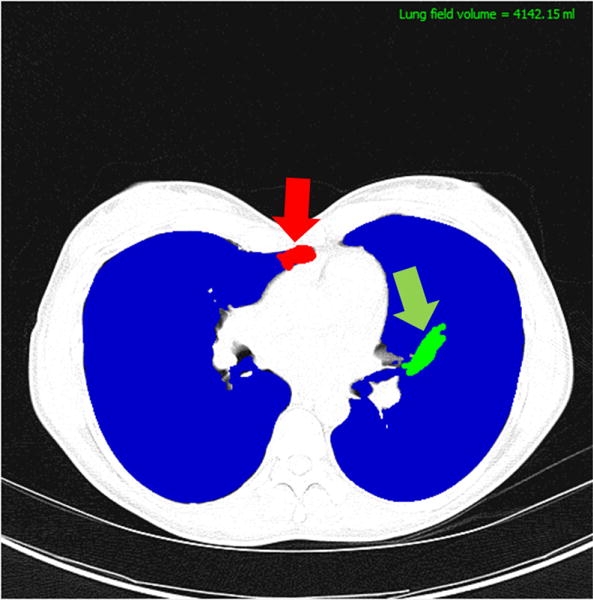
Manual correction using the CIDI-Lung-Seg. The practitioner can add (green) or delete (red) the misclassified areas by stroke painting mechanism.
III. Software Description
CIDI-Lung-Seg is designed and distributed with an open-architecture under the general public GNU license. The software details of CIDI-Lung-Seg is presented in TABLE II. A video guide for the installation and basic working of the software is shared here (http://www.youtube.com/watch?v=VD3GQ0O7weE). The software uses most common libraries from ITK, VTK, and QT frameworks. Our free software can be downloaded from http://www.nitrc.org/projects/nihlungseg.
TABLE II.
Correlation matrix of volumes (mL) for the annotations obtained through different methods.
| CIDI-Lung-Seg | EBW Auto | EBW Threshold | MIM | |
|---|---|---|---|---|
| CIDI-Lung- | 1 | |||
| Seg | ||||
| EBW Auto | 0.995 | 1 | ||
| EBW | 0.999 | 0.996 | 1 | |
| Threshold | ||||
| MIM | 0.996 | 0.990 | 0.995 | 1 |
IV. Performance Analysis
To evaluate the performance of our software against the commercially available tools, we chose two state-of-the-art commercial software tools (i.e., MIM by MIM Software Inc., and Philips Extended Brilliance Workspace (EBW) by Philips Electronics). The segmentation with the MIM Software is performed using its region growing module while Philips EBW is run in two different modes: automated and thresholding, for this comparison. The performance evaluation is performed on 9 in-house collected images at our facility. The estimated lung volume using different approaches is presented in Fig. 6. Table II gives the correlation matrix of the volume for the annotations produced using different software tools. All methods used in the evaluation produced highly correlated results, although it has been noted that MIM region growing miss parts of the lung with HU intensities less than −1000 HU.
Fig. 6.
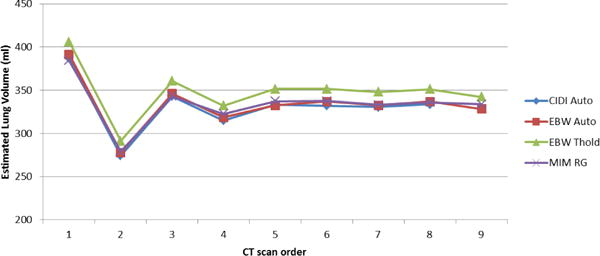
Lung volume estimation from animal CT images using different software tools.
A. Independent external evaluation
To analyze the effectiveness of our software and for an independent comparison, we tested CIDI-Lung-Seg using publically available LObe and Lung Analysis 2011 (LOLA11) Challenge data set http://lola11.com/. The challenge data consists of 55 anonymized CT scans, the abnormality in the scans ranges from mild to severe. Results submitted to the challenge organizers were evaluated against a reference standard using overlap coefficient and published online. The results were reported in terms of minimum, mean, median, and maximum overlap over the 55 scans. The final score was the mean over all scans. The evaluation provided for CIDI-Lung-Seg is reproduced in Table III.
TABLE III.
Overlap coefficient for the CIDI-Lung-Seg for the 55 scans in LOLA11 challenge.
| obj | mean | std | min | Q1 | median | Q3 | max |
|---|---|---|---|---|---|---|---|
| Left lung | 0.968 | 0.097 | 0.316 | 0.979 | 0.987 | 0.995 | 0.999 |
| Right lung | 0.968 | 0.134 | 0.000 | 0.984 | 0.990 | 0.997 | 0.999 |
|
| |||||||
| score | 0.968 | ||||||
V. Conclusion and Future Directions
In this paper, we presented an open source, multi-platform, single-click lung extraction from CT images. The method takes a leap from traditional manual annotation software tools; at the same time it avoids simplistic fully automated approaches that allow clinicians to completely accept or reject annotations these methods produce. The software provides an automated initial annotation, the software provides an easy to use paint tool to correct the initial guess. The comparative tests performed with commercially available software tools demonstrate the robustness and reliability of our software.
In the future releases of the software, we plan to incorporate fast, robust, and efficient machine-learning methods for accurate pathology annotation and quantification. In addition, automatic techniques to segment trachea, airway wall [11], and lung-lobes are envisioned in the future releases of CIDI-Lung-Seg. The inclusion of these methods will make the CIDI-Lung-Seg a complete toolkit for comprehensive pulmonary analysis that can aide clinicians in better diagnosis.
TABLE I.
Overview of the CIDI-Lung-Seg Software.
| Name of Software | CIDI-Lung-Seg |
| Current release | 1.0.2 |
| Devlopment | C/C++, ITK, VTK, QT |
| Developed at | Center for Infectious Disease Imaging, National Institutes of Health |
| Operating System | Windows (32-bit, 64-bit), Linux, Mac |
| Type | Medical image analysis |
| License | GNU General Public License |
| Input image format | ANALYZE 7.5 NifTI |
| DICOM Support | In future releases |
| Download URL | http://www.nitrc.org/projects/nihlungseg |
References
- 1.Estimated prevalence and incidence of lung disease. American Lung Association; Washington, DC: Apr, 2013. (Tech. Rep). [Google Scholar]
- 2.Mansoor A, Patsekin V, Scherl D, Robinson J, Rajwa B. A statistical modeling approach to computer-aided quantification of dental biofilm. Biomedical and Health Informatics, IEEE Journal of. 2014:1–1. doi: 10.1109/jbhi.2014.2310204. [DOI] [PubMed] [Google Scholar]
- 3.Xu Z, Bagci U, Foster B, Mansoor A, Mollura DJ. Medical Image Computing and Computer-Assisted Intervention–MICCAI 2013. Springer; 2013. Spatially constrained random walk approach for accurate estimation of airway wall surfaces; pp. 559–566. [DOI] [PMC free article] [PubMed] [Google Scholar]
- 4.Armato SG, III, Sensakovic WF. Automated lung segmentation for thoracic CT: Impact on computer-aided diagnosis. Academic Radiology. 2004;11(9):1011–1021. doi: 10.1016/j.acra.2004.06.005. [DOI] [PubMed] [Google Scholar]
- 5.Kuhnigk J-M, Dicken V, Zidowitz S, Bornemann L, Kuem-merlen B, Krass S, Peitgen H-O, Yuval S, Jend H-H, Rau WS, et al. New tools for computer assistance in thoracic CT. part 1. functional analysis of lungs, lung lobes, and bronchopulmonary segments. Radiographics. 2005;25(2):525–536. doi: 10.1148/rg.252045070. [DOI] [PubMed] [Google Scholar]
- 6.Zhang L, Hoffman EA, Reinhardt JM. Lung lobe segmentation by graph search with 3d shape constraints. Proc SPIE. 2001;4321:204–215. [Google Scholar]
- 7.Jones TN, Metaxas DN. Automated 3d segmentation using deformable models and fuzzy affinity. Information Processing in Medical Imaging Springer. 1997:113–126. [Google Scholar]
- 8.Ciesielski KC, Udupa JK, Falcão AX, Miranda PA. Fuzzy connectedness image segmentation in graph cut formulation: A linear-time algorithm and a comparative analysis. Journal of Mathematical Imaging and Vision. 2012;44(3):375–398. [Google Scholar]
- 9.Zhou Y, Bai J. Multiple abdominal organ segmentation: An atlas-based fuzzy connectedness approach. Information Technology in Biomedicine, IEEE Transactions on. 2007;11(3):348–352. doi: 10.1109/titb.2007.892695. [DOI] [PubMed] [Google Scholar]
- 10.Udupa JK, Samarasekera S. Fuzzy connectedness and object definition: Theory, algorithms, and applications in image segmentation. Graphical Models and Image Processing. 1996;58(3):246–261. [Google Scholar]
- 11.Xu Z, Bagci U, Kubler A, Luna B, Jain S, Bishai WR, Mollura DJ. Computer-aided detection and quantification of cavitary tuberculosis from ct scans. Medical physics. 2013;40(11):113701. doi: 10.1118/1.4824979. [DOI] [PMC free article] [PubMed] [Google Scholar]


