

Abstract
The clinical translation of pro-angiogenic growth factors for treatment of vascular disease has remained a challenge due to safety and efficacy concerns. Various approaches have been used to design spatiotemporally-controlled delivery systems for growth factors in order to recapitulate aspects of endogenous signaling and thus assist in translation. We have developed acoustically-responsive scaffolds (ARSs), which are fibrin scaffolds doped with a payload-containing, sonosensitive emulsion. Payload release can be controlled non-invasively and in an on-demand manner using focused, megahertz-range ultrasound (US). In this study, we investigate the in vitro and in vivo release from ARSs containing basic fibroblast growth factor (bFGF) encapsulated in monodispersed emulsions. Emulsions were generated in a two-step process utilizing a microfluidic device with a flow focusing geometry. At 2.5 MHz, controlled release of bFGF was observed for US pressures above 2.2 ± 0.2 MPa peak rarefactional pressure. Superthreshold US yielded a 12.6-fold increase in bFGF release in vitro. The bioactivity of the released bFGF was also characterized. When implanted subcutaneously in mice, ARS exposed to superthreshold US displayed up to 3.3-fold and 1.7-fold greater perfusion and blood vessel density, respectively, than ARS without US exposure. Scaffold degradation was not impacted by US. These results highlight the utility of ARSs in both basic and applied studies of therapeutic angiogenesis.
Keywords: acoustic droplet vaporization, ultrasound, controlled release, perfluorocarbon, basic fibroblast growth factor, angiogenesis
Graphical abstract
1. Introduction
Exogenous, pro-angiogenic growth factors can stimulate blood vessel formation and restore perfusion in preclinical models of cardiovascular disease [1–5]. However, the clinical use of pro-angiogenic growth factors for treating conditions, such as coronary artery and peripheral artery diseases, has been disappointing [6–12]. Retrospective analysis of these studies revealed many potential shortcomings in the preclinical to clinical transition of therapeutic angiogenesis. One crucial reason is related to the route of the growth factor including variables such as the administration route, dose, and duration of treatment [13–15]. In human studies, basic fibroblast growth factor (bFGF) [6–8] or genes encoding for acidic FGF [16–18], vascular endothelial growth factor (VEGF) [9, 10, 19], or hepatocyte growth factor (HGF) [11, 12] were administered using intravascular or intramuscular injections. Growth factors administered using these routes have short in vivo half-lives, slow tissue penetration, and the tendency to cause systemic side effects (e.g., nephrotoxicity, edema formation) [6, 20].
The paradigm of acellular (i.e., inductive) tissue engineering has been to incorporate angiogenic growth factors within a hydrogel scaffold, which is then implanted at or adjacent to the site of intended vascularization. Growth factor release from the scaffold is dependent on factors such as the growth factor-scaffold affinity as well as the rates of enzymatic and cellular degradation of the scaffold [21]. This approach can extend the in vivo half life of the growth factor [22], localize its actions to the site of implantation [23], and promote cellular processes involved in angiogenesis [24]. Despite these advantages over bolus injections, conventional hydrogels do not enable spatiotemporal control of growth factor release. In contrast, endogenous growth factors are expressed in spatially- and temporally-regulated patterns during angiogenesis. Taking VEGF-A as an example, the spatial gradient of the growth factor impacts the directionality of blood vessel growth while differences in temporal gradients influence vessel density [25, 26].
Several approaches have been used to impart spatiotemporally-controlled release from hydrogels. By altering material properties, temporally-controlled release (e.g., burst, sustained, or delayed) of bFGF, VEGF, and platelet derived growth factor (PDGF) has been achieved with collagen [27], alginate [28, 29], and poly(lactide-co-glycolide) (PLG) [30] based scaffolds. Anisotropic (e.g., bi-layer) scaffolds composed of collagen or PLG enable spatially-controlled delivery of bFGF, VEGF, and PDGF [27, 31]. By definition, however, these a priori approaches do not provide the ability to modulate the spatiotemporal gradients or released dose of growth factor once the scaffold is fabricated and implanted in vivo. This is potentially problematic when trying to personalize pro-angiogenic growth factor therapy based on the patient response during treatment. Thus, a scaffold where growth factor delivery can be actively modulated could facilitate the understanding of how variations in growth factor presentation impact angiogenesis.
We have developed fibrin-based hydrogels where the delivery of payloads such as growth factors can be controlled non-invasively and in an on-demand manner using focused ultrasound (US) [32, 33]. These acoustically-responsive scaffolds (ARSs) contain a fibrin matrix doped with micron-sized, sonosensitive emulsions. Payloads, which are contained within the perfluorocarbon (PFC) emulsion, are released from the ARS through a non-thermal mechanism termed acoustic droplet vaporization (ADV) [34, 35]. Megahertz-range US is used to generate ADV, which causes vaporization of the PFC phase within the emulsion and expulsion of the encapsulated payload [36–39].
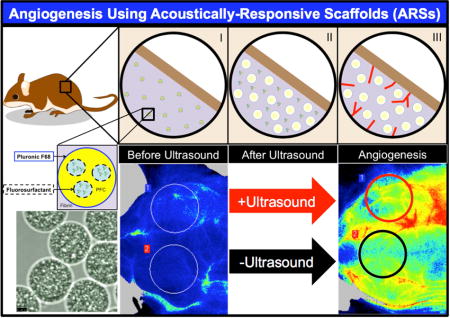
Previously, we demonstrated that release from the ARS is a threshold-based phenomenon that is dependent on characteristics of the emulsion, scaffold, and US [39]. Additionally, we showed in an in vivo proof-of-concept study that US can modulate release of a surrogate payload (i.e., dextran) from an ARS [32, 33]. In the current study, we focus on the in vitro and in vivo delivery of bFGF using ARSs (Figure 1). bFGF-loaded emulsions were generated using a microfluidic device, which yielded monodispersed particles having more consistent release kinetics than the heterogeneous particles used in our prior work [32, 33, 39]. We characterized the in vitro release of bFGF from ARSs, including bioactivity of the released bFGF and we evaluated the angiogenic response of subcutaneously-implanted ARSs. Overall, as will be shown, ARSs yield a robust angiogenic response that is controlled by focused non-invasive US.
Figure 1.
Control of angiogenesis using an ARS. (I) ARSs were polymerized in situ in the subcutaneous space. The fibrin-based ARSs contained bFGF encapsulated within a monodispersed double emulsion. (II) During US exposure, the PFC within the emulsion transitioned from a liquid into a gas, thereby releasing the encapsulated bFGF. (III) The released bFGF stimulated blood vessel growth into the ARS.
2. Materials and Methods
2.1 Preparation and Characterization of the Double Emulsion
Double emulsions with a water-in-PFC-in-water (W1/PFC/W2) structure were prepared as previously described [32, 38]. Briefly, a triblock fluorosurfactant, consisting of Krytox 157FSH (CAS# 51798-33-5, DuPont, Wilmington, DE, USA) and polyethylene glycol (MW: 1000, CAS#: 24991-53-5, Alfa Aesar, Ward Hill, MA USA), was dissolved at 2% (w/w) in 1 g of perfluorohexane (PFH, C6F14, boiling point: 56°C, CAS#: 355-42-0, Strem Chemicals, Newburyport, MA USA). The PFC solution was combined at 2:1 (v/v) with a W1 phase containing 1 mg/mL basic fibroblast growth factor (bFGF, Cat#: GF003AF, EMD Millipore, Temecula, CA USA), 7.5 mg/mL bovine serum albumin (Sigma-Aldrich, St. Louis, MO USA), and 7.5 μg/mL heparin (Cat #: 375095, Calbiochem, San Diego, CA, USA) in phosphate-buffered saline (PBS, Life Technologies, Grand Island, NY USA). The PFC and W1 phases were sonicated (Q55, QSonica, Newton, CT USA) for 30 seconds while on ice. The resulting primary emulsion, with a water-in-PFC (W1/PFC) structure and mean diameter of approximately 2 μm [40], was pumped at 0.5 μL/min into the inner channel of a quartz microfluidic chip (Cat#: 3200146, junction: 14 × 17 μm, hydrophilic coating, Dolomite, Royston, United Kingdom) using a syringe pump (KDS-410, kd Scientific, Holliston, MA USA). Simultaneously, 50 mg/mL Pluronic F68 (CAS# 9003-11-6, Sigma-Aldrich) in PBS was pumped at 2.5 μL/min into the outer channels of the chip using a second syringe pump (78-0388, kd Scientific).
Blank or fluorescently-labeled emulsions were prepared as described above with either PBS or 0.1 mg/mL Alexa Fluor 488-labeled dextran (MW: 10 kDa, Life Technologies) as the W1 phases, respectively. Emulsions were characterized with a Coulter Counter (Multisizer 4, Beckman Coulter, Brea, CA USA) in the range of 1–30 μm. To confirm emulsion morphology, the dextran-loaded emulsion was imaged using an inverted confocal microscope (SP5X, Leica Microsystems, Inc., Buffalo Grove, IL USA) at the University of Michigan Microscopy & Image Analysis Laboratory. The encapsulation efficiency of bFGF in the emulsion was determined by first allowing the emulsion to settle from the supernatant, which contained non-encapsulated bFGF. Next, an aliquot of the emulsion pellet was broken, as done previously [32], and the bFGF concentration was measured using an enzyme-linked immunosorbent assay (ELISA) (Cat#: DY233, R&D Systems, Minneapolis, MN USA). The encapsulation efficiency was determined by comparing the measured bFGF concentration with the theoretical concentration initially loaded into the emulsion. For all experiments, ARSs were prepared using emulsion pellet, which minimized the carryover of non-encapsulated bFGF.
2.2 Fabrication and Characterization of the ARS
ARSs were prepared using 10 mg/mL clottable protein by first combining bovine fibrinogen (Sigma-Aldrich) dissolved in degassed (36% O2 saturation) Dulbecco’s modified Eagle’s medium (DMEM, Life Technologies), with 10% (v/v) bovine thrombin (20 U/mL, Thrombin-JMI, King Pharmaceuticals, Bristol, TN, USA), 0.025 U/mL aprotinin (Sigma-Aldrich), and 1% (v/v) emulsion. ARSs used for in vivo experiments contained 0.125 mg/mL Alexa Fluor 647-labeled fibrinogen (Cat#: F35200, Molecular Probes, Eugene, OR USA) for non-invasive monitoring of fibrin degradation.
The ADV and inertial cavitation (IC) thresholds of the ARSs were determined using previously described methods [39]. Briefly, 0.5 mL ARSs were cast in 24-well Bioflex plates (Flexcell International, Burlington, NC, USA) by aliquoting the ARS mixture into each well and allowing it to polymerize for 30 min at room temperature. The ARSs were exposed to focused US generated by a calibrated, single-element transducer (2.5 MHz, H108, f-number = 0.83, focal length = 50 mm, Sonic Concepts, Inc., Bothell, WA USA) in the range of 0 to 8.0 MPa peak rarefactional pressure. The complete acoustic setup is described in section 2.3. A calibrated hydrophone (HGL-0085, dynamic range = 1–50 MHz, Onda, Sunnyvale, CA USA) was placed 6 cm away from the focus of the transducer to detect backscattered acoustic signals generated in the ARS during the US exposure. The radiofrequency signals collected with the hydrophone and digitized by an oscilloscope (sampling rate = 100 MHz) were analyzed in MATLAB (The MathWorks, Natick, MA, USA) using the fast Fourier transform. The ADV threshold was determined by analyzing the fundamental frequency since bubbles formed in the ARS due to ADV significantly increase the scattered, fundamental signal [41, 42]. The ADV threshold was defined as the lowest acoustic pressure at which the increase in fundamental signal was observed. The IC threshold was computed using the broadband signal from the acquired radiofrequency waveforms using identical methods as described previously [39].
Using a prior method [39], the physical stability of the ARSs was determined by casting 0.5 mL ARSs in 24-well plates (Corning Life Sciences, Tewksbury, MA, USA) with 1% (v/v) blank emulsion. After polymerization at room temperature, each ARS was covered with 0.5 mL of DMEM and placed in a standard tissue culture incubator (37° C, 5% carbon dioxide). At each time point (i.e., days 0, 1, 3, and 7), the overlying medium was removed and replaced with 0.05% trypsin–EDTA (Life Technologies). After complete degradation of the fibrin component of the ARS, the resulting sample was centrifuged to isolate the emulsion, and the emulsion was sized using a Coulter Counter. It was experimentally confirmed that incubation of the emulsion in trypsin did not alter the size distribution or number density of the emulsion.
2.3 US Exposure
All acoustic exposures were conducted using the following setup. The single-element transducer was driven by pulsed waveforms generated using a dual channel function generator (33500B, Agilent Technologies, Santa Clara, CA USA), amplified by a gated radiofrequency amplifier (GA-2500A Ritec Inc, Warwick, RI USA), and passed through a matching circuit (H108_3MN, Sonic Concepts) to reduce impedance between the transducer and amplifier. Gating of the carrier waveform was realized using the second channel of the function generator, resulting in a pulsed signal. All generated and amplified signals were monitored with an oscilloscope (HDO4034, Teledyne LeCroy, Chestnut Ridge, NY USA). All acoustic exposures were done with the following parameters unless otherwise stated: 2, 4, 6, or 8 MPa peak rarefactional pressure, 13 acoustic cycles, and 100 Hz pulse repetition frequency (PRF). All US pressures are listed as peak rarefactional pressures.
2.4 In vitro Controlled Release of bFGF
For in vitro studies, 0.5 mL aliquots of the ARS mixture were added into each well of a 24 well BioFlex plate and allowed to polymerize for 30 min at room temperature. Each ARS was then covered with 0.5 mL of overlying media, consisting of DMEM supplemented with 100 U/mL penicillin and 100 μg/mL streptomycin. The ARSs were placed in a tissue culture incubator between US exposures. For controlled release experiments, the BioFlex plate containing the ARSs was placed in a tank of degassed water (30–36% O2 saturation) at 37°C such that only the bottom half of the plate was submerged. The single element US transducer was positioned under the plate such that the axial focus was located at mid-height of the ARS. The bottom of each well in the plate consisted of a silicone elastomer membrane, which based on a thickness of 1 mm, attenuated the US by less than 2% [43]. During US exposure, the transducer was rastered across the entire ARS for 2 min. Five US exposure conditions were explored: no US; daily US for 6 days beginning one day after polymerization at 2, 4, or 8 MPa; and daily US beginning 4 days after polymerization at 8 MPa.
The overlying media was sampled daily by collecting half of the media and replacing the sampled volume with an equal volume of fresh media. On days with US exposure, the media was sampled immediately after US exposure. The concentration of bFGF in the media, subsequently referred to as releasate, was measured by ELISA. The bioactivity of the released bFGF was assessed using NR-6-R murine fibroblasts [44], kindly provided by Dr. Angie Rizzino at the University of Nebraska Medical Center, and modifying a previously published method [45]. Briefly, the cells were initially cultured in DMEM with 10% bovine calf serum (BCS, Thermo Fisher Scientific Inc, Waltham, MA USA) and then passaged into DMEM/F12 media (Thermo Fisher Scientific Inc) supplemented with 10% BCS three days prior to the start of the bioactivity assay. The cells were seeded in a 96 well plate at 5000 cells/well in serum free media containing DMEM/F12 supplemented with ITS liquid media supplement (10 μg/mL insulin, 5.5 μg/mL transferrin, and 5 ng/mL selenium, Sigma-Aldrich), 100 μg/mL ovalbumin (Sigma-Aldrich), 1 μM dexamethasone (Sigma-Aldrich), and 5 μg/mL fibronectin (Sigma-Aldrich). The cells were then incubated with either freshly prepared bFGF standards or releasate for 44 hours. Cell proliferation was quantified using the CellTiter 96 AQueous One Solution Cell proliferation Assay (Promega, Madison, WI USA), according to the manufacturer’s instructions.
2.5 In vivo Controlled Release of bFGF
This in vivo research was conducted with approval of the Institutional Animal Care & Use Committee at the University of Michigan. Female BALB/c mice (n = 16, 18–21 g, Charles River Laboratories, Wilmington, MA, USA) were anesthetized with isoflurane (5% for induction and 1.5% for maintenance). The lower dorsal hair was removed by shaving and applying depilatory cream (Nair, Church & Dwight Co, Ewing, NJ USA); the skin was sterilized with betadine surgical scrub (Purdue Products L.P., Stamford, CT USA). The ARS mixture (0.3 mL per implant) was then injected subcutaneously using a 20-gauge needle (Becton Dickinson, Franklin Lakes, NJ, USA) at two locations with the dorsal region and allowed to polymerize for 2 minutes prior to removal of the needle. The ARS mixture contained 1% (v/v) bFGF-loaded emulsion, which yielded 1 μg bFGF per ARS. The mice were allowed to recover following implantation. Scaffolds containing 10 mg/mL fibrin or 10 mg/mL fibrin with unencapsulated bFGF (1 μg per scaffold) were injected as negative and positive control implants, respectively.
US was applied using previously published methods [32]. Briefly, each mouse was anesthetized with isoflurane and placed in a prone position. US coupling gel (MediChoice, Owens & Minor, Mechanicsville, VA USA) was applied to the implant region. A coupling cone (C106, Sonic Concepts) was placed on the US transducer, filled with degassed water (30–36% O2 saturation), and the water was sealed in by Tegaderm film (3M Health Care, St. Paul, MN USA). The transducer was rastered across the implant for 2 min. For each mouse, US was applied daily to only one ARS per mouse beginning 1 day after implantation for a period of 7 or 14 days. The scaffolds receiving US treatment (i.e., left or right implant) were randomized for all mice.
2.6 Perfusion Imaging
The mice were anesthetized with isoflurane and imaged with a PeriCam PSI HR (Perimed, Ardmore, PA USA) laser speckle contrast analysis (LASCA) system to quantify the relative perfusion within the implant region. The mice were imaged on day 0 (i.e., immediately after implantation), 1 (i.e., the first day of US exposure), 3, 7, 10, and 14. All images were acquired with a 10 cm distance between the scanner and implant, resulting in a resolution of 20 μm/pixel. Pimsoft software (Perimed) was used for image acquisition and processing. A total of 30 images per implant per time point were acquired at a rate of 0.096 images/s with a field of view of 2.0 × 2.8 cm. Every 6 images were averaged to create a total of five averaged images per implant per time point. Three of the five averaged images were used for perfusion analysis, whereby the average relative perfusion was computed within circular regions of interest (ROIs, 0.9 cm diameter) encompassing each implant.
2.7 Imaging Scaffold Degradation
The mice were anesthetized with isoflurane and imaged with an IVIS Spectrum Preclinical In Vivo Imaging System (Perkin Elmer, Houston, TX USA) at the University of Michigan Center for Molecular Imaging to quantify the fraction of Alexa Fluor 647-labeled fibrinogen remaining in the ARS implants. The mice were imaged on day 0 (i.e., the day of implantation), 1 (i.e., the first day of US exposure), 7, and 14. The signal from the Alexa Fluor 647-labeled fibrinogen was collected using an excitation filter of 640 nm and emission filters ranging from 680 to 740 nm. To account for autofluorescence, a sequence of background signals was collected using an excitation filter of 570 nm and emission filters ranging from 620 to 740 nm. Spectral unmixing was performed on the data sets in Living Image software (Perkin Elmer), according to the manufacturer’s instructions, using the fluorophore and autofluorescence (background) images. Following unmixing, equally sized ROIs (0.9 cm diameter), were drawn to encompass each implant and the average radiant efficiency ([photons/s/cm2/sr]/[μW/cm2]) was calculated. For each implant, the average radiant efficiency on days 1, 7, and 14 was normalized by the day 0 measurement, thus accounting for any differences in the amount of fluorophore initially loaded.
2.8 Histology
Mice were euthanized on days 7 and 14 post implantation. ARSs or fibrin implants were retrieved and fixed overnight in aqueous buffered zinc formalin (CAS# 50-00-0, Formalde-Fresh, Fisher Scientific, Waltham, MA USA). Implants were then transferred to 70% ethanol until they were processed and embedded in paraffin at the University of Michigan Microscopy & Image Analysis Laboratory. The paraffin-embedded tissues were cut into 5 μm thick serial sections and placed on pre-cleaned glass slides (Fisherbrand Superfrost Plus, Fisher Scientific) for histological analysis. Immunostaining of mice-derived blood vessels was performed using a rabbit anti-mouse CD31 primary antibody (ab28364, Abcam, Cambridge, MA USA) combined with a goat anti-rabbit secondary labeled polymer-horseradish peroxidase conjugate (Envision+ System-HRP (DAB), Dako North America, Inc., Carpinteria, CA USA), as described previously [46, 47]. Negative controls, involving staining with a rabbit IgG polyclonal isotype control (ab27478, Abcam) as the primary antibody or staining with the secondary antibody only, confirmed the specificity of the CD31 staining. Tissue sections were visualized and photographed with a Leica DMRB light microscope (Leica Microsystems). Three tissue sections from each implant– with six images per tissue section – were analyzed manually for blood vessel formation per unit area. Blood vessel counting was done, in a blinded manner, by three separate individuals. Blood vessels were identified in CD31-stained tissues at 20× magnification by defined lumens and complete enclosure of the lumen.
2.9 Statistics
All statistical analyses were performed using GraphPad Prism software (GraphPad Software, Inc., La Jolla, CA USA). All data is expressed as the mean ± standard error of the mean of measured quantities. All n-values are listed below each corresponding figure. Statistically significant differences of all data sets were determined with a Student’s t-test corrected for multiple comparisons using the Holm-Sidak method, with differences deemed significant for p<0.05.
3. Results
3.1 Emulsion and ARS Properties
Figure 2A shows the flow focusing geometry of the microfluidic device used to produce the double emulsion. The primary emulsion (W1/PFC), containing bFGF in the W1 phase and stabilized by fluorosurfactant, was pumped through the inner channel (yellow arrow). The primary emulsion was generated offline via sonication. The flow from the inner channel converged at the junction with two lateral flow channels (green arrows) of an aqueous solution of Pluronic F68, the W2 phase. Double emulsions were formed at the junction and exited the device through the bottom channel into a collection vial. To confirm morphology of the generated double emulsion, the emulsions were imaged using confocal microscopy. Images of a double emulsion with Alexa Fluor 488-labeled dextran in the W1 phase are displayed in Figure 2B. The double emulsion droplets appeared uniform in size and the W1 droplets were submicron in diameter. Identical morphology was observed for double emulsions containing bFGF (images not shown). The size distribution of the emulsion, measured with a Coulter counter, is shown in Figure 3A. The emulsions had a mean diameter of 13.9 ± 0.04 μm and a coefficient of variance (CV) of 4.5%. The encapsulation efficiency of bFGF in the emulsions was 99.3 ± 1.6%.
Figure 2.
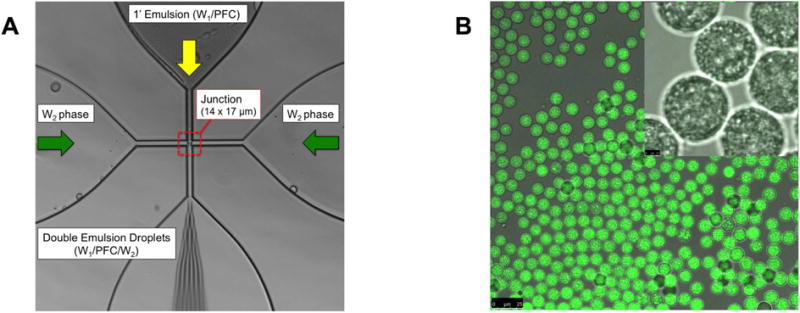
(A) An image highlighting the flow focusing geometry of the microfluidic device, including the 14 × 17 μm junction where the monodispersed double emulsions were formed. (B) Confocal microscopy images of the resulting double emulsion at 40× and 100× magnification for the large and inset images, respectively. The images show emulsions that are visually uniform in size. Scale bars: 25 μm (large image) and 2.5 μm (inset)
Figure 3.
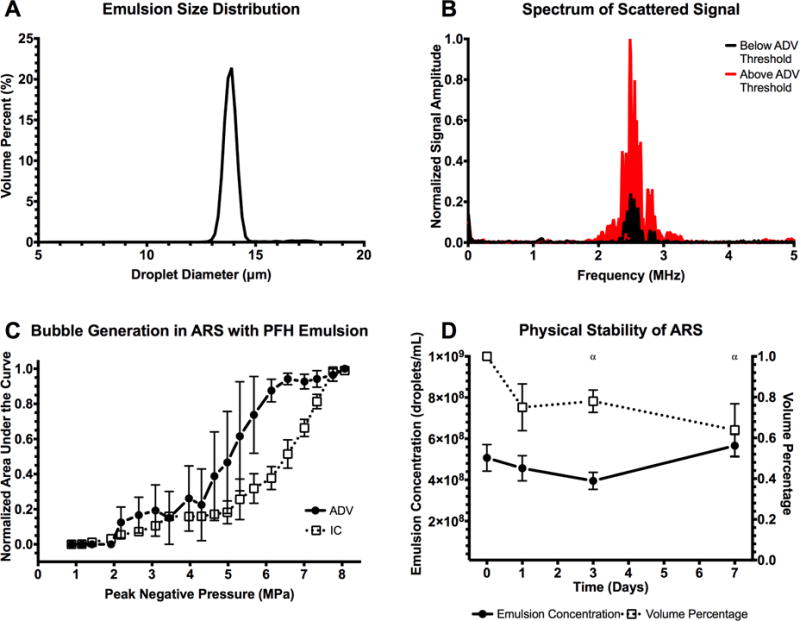
(A) Volume-weighted size distribution of the monodispersed double emulsion. The mean diameter and coefficient of variance of the emulsion was 13.9 ± 0.04 μm and 4.5%, respectively. (B) The scattered, fundamental frequency (i.e., 2.5 MHz) was passively recorded and used as an indicator of ADV, specifically the presence of bubbles generated in the ARS. (C) At pressures above the ADV threshold, 2.2 ± 0.2 MPa, bubble formation was evident. Additionally, the scattered broadband noise was also recorded and used as an indicator of IC, caused by rapid expansion and collapse of the bubbles formed through ADV at high pressures. The IC threshold was 4.8 ± 1.5 MPa (n=3 for both ADV and IC measurements). (D) Stability of the ARS, specifically the emulsions within the ARS, when placed in a cell culture incubator at 37°C (n=5). Statistically significant differences (p < 0.05) relative to day 0 for n=5 samples are denoted by α.
The ADV and IC thresholds of the ARS were determined by passively detecting the scattered fundamental and broadband acoustic signals, respectively. Figure 3B shows the frequency spectrum from ARSs exposed to US that was either below (black) or above (red) the ADV threshold. The presented spectrum accounts for background subtraction of a fibrin gel without emulsion. The frequency spectra appeared qualitatively similar to the black signal until the ADV threshold was reached. Following ADV, bubbles formed in the ARS lead to an increase in the intensity of the scattered signal (red). The relationship between the fundamental signal, broadband signal, and acoustic pressure is shown in Figure 3C. The ADV threshold of the ARS was 2.2 ± 0.2 MPa and the IC threshold was 4.8 ± 1.5 MPa. At subthreshold pressures, bubble formation, characterized by the integrated fundamental signal, was negligible. At superthreshold pressures, bubble formation and IC correlated with acoustic pressure.
Figure 3D shows the in vitro physical stability of the emulsion within the ARSs as a function of time. There were no statistically significant changes in emulsion concentration. However, there were significant decreases in the volume percent of emulsion in the ARS on days 3 and 7. As displayed in Supplemental Figure 1, the mean diameter and CV decreased and increased, respectively, over time.
3.2 In vitro Release of bFGF from the ARSs
Figure 4 shows macroscopic images of ARSs exposed to various US conditions. ARSs not exposed to US or exposed to US at a subthreshold pressure (i.e., 2 MPa), have minimal bubble formation, which is indicative of the absence of ADV. ARSs exposed to US at superthreshold pressures (i.e., 4 and 8 MPa) contain bubbles from ADV. The bubbles in the ARSs on day 2 are larger than those on day 1 (the day of US exposure).
Figure 4.
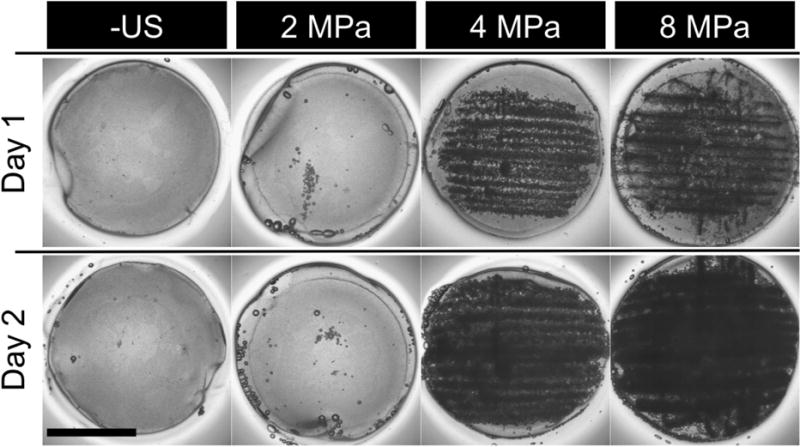
Images of ARSs after exposure to various US pressures on day 1. ARSs exposed to superthreshold US (i.e. > 2.2 MPa) show bubble formation on day 1, while subthreshold US (i.e. < 2.2 MPa) exposures yield no bubble formation. Scale bar: 8 mm. The generated bubbles increase in size by day 2 due to in-gassing.
Figure 5A shows that release of bFGF from ARSs correlated with acoustic pressure. By day 7, the cumulative percentage of bFGF released when the ARSs were exposed to 0 (i.e. –US), 2, 4, and 8 MPa was 1.4 ± 0.4%, 1.9 ± 0.7%, 8.4 ± 2.9%, and 17.9 ± 4.5%, respectively. bFGF release at 4 and 8 MPa was statistically different from the –US condition on days 2–7. No significant differences in bFGF release were observed at any time point when comparing 0 and 2 MPa, which was expected since 2 MPa is subthreshold. A delayed release experiment was performed where the initial US exposure was done on day 4, rather than day 1. This experimental condition, which used 8 MPa, yielded 6.6 ± 0.6% bFGF release by day 7, which was 3 days after the initial US exposure. Significant bFGF release was observed for this delayed experiment on days 5–7, demonstrating temporal control of bFGF release.
Figure 5.
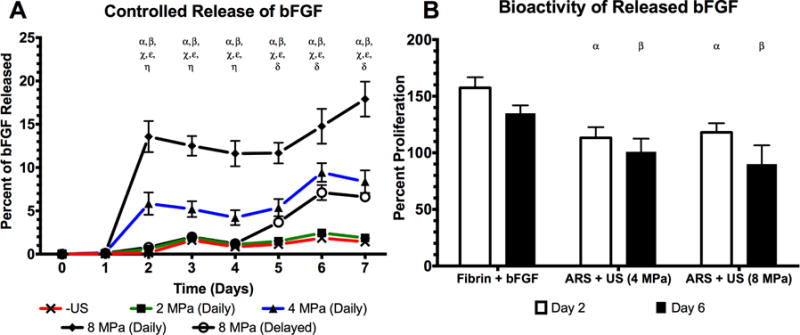
US was used to control the release of bioactive, bFGF from an ARS (A) The percent of bFGF released as a function of acoustic pressure where “Daily” indicates US exposure on days 1–7. A delayed release experiment was also performed (i.e., “Delayed”) where US was applied on days 4–7. (B) The bioactivity of the released growth factor was determined by incubating NR-6-R fibroblasts with releasate. Cell proliferation was measured after 44 hours. Releasates obtained at 0 or 2 MPa did not contain enough bFGF to induce cell proliferation. All data is represented as mean ± standard error of the mean for n = 5 ARSs. For (A), statistically significant differences (p < 0.05) are denoted as follows. α: 8 MPa (daily) vs. –US; β: 4 MPa (daily) vs. –US; χ: 8 MPa (daily) vs. 4 MPa (daily); ε: 8 MPa (daily) vs. 8 MPa (delayed); η: 4 MPa (daily) vs. 8 MPa (delayed); δ: 8 MPa (delayed) vs. –US. For (B), statistically significant differences (p < 0.05) are denoted as follows. α: vs. fibrin+bFGF on day 2, β: vs. fibrin+bFGF on day 6.
In Figure 5B, the bioactivity of bFGF released from an ARS at 4 and 8 MPa, as well as from a fibrin gel, is displayed. The presented values are calculated relative to cells incubated with freshly prepared bFGF standards (see Supplemental Figure 2). At 4 MPa, the bioactivity was 113.3 ± 9.4% and 100.9 ± 11.6% for releasates collected on days 2 and 6, respectively, while at 8 MPa exposure the bioactivity was 118.1 ± 8.0% and 90.0 ± 16.6%, respectively. For a fibrin gel with non-encapsulated bFGF (i.e., fibrin + bFGF), the bioactivity was 157.4 ± 9.4% and 135.0 ± 6.9% for days 2 and 6, respectively. Within an experimental group, there were no significant differences in bioactivity between time points. However, both ARS conditions tested lower than fibrin + bFGF on each day. The concentration of bFGF released at 0 or 2 MPa was too low to induce cell proliferation.
3.3 In vivo Release of bFGF from the ARSs
LASCA imaging was used to non-invasively and longitudinally monitor perfusion in and around the subcutaneous implants placed in the lower dorsal region. Figure 6 shows a representative set of images used to quantify relative perfusion. Qualitatively, the images show that greater perfusion was observed with the ARS exposed to US (i.e., ARS+US, red circle) versus the ARS not exposed to US (i.e., ARS, black circle). The fibrin implants containing bFGF yielded more perfusion than the fibrin control, and overall less perfusion than either ARS condition.
Figure 6.
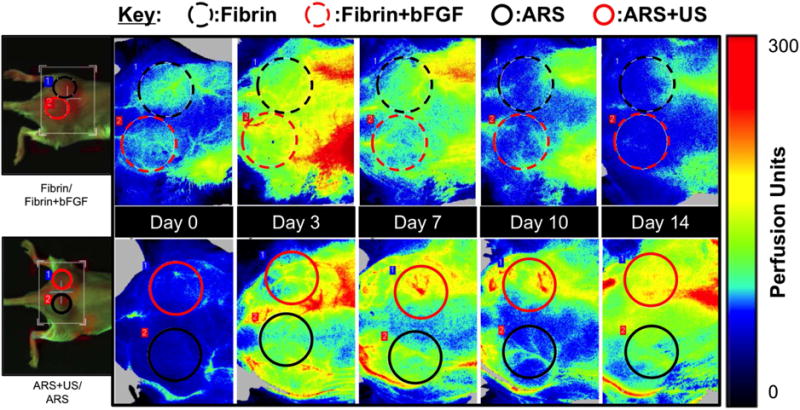
Longitudinal LASCA images of two mice, each with two implants. The regions of interests (ROIs) were chosen based on the physical location of the implants, and are denoted by colored circles. The left most images are visible images of the mice. For all images, the caudal direction is left. ROI diameter: 0.9 cm.
Figure 7A displays a quantitative analysis of the images, based on ROIs. The perfusion for both ARS and ARS+US increased up to day 7, with the greatest change in perfusion relative to day 0 observed on day 7 (i.e., 54.0 ± 13.1 and 97.0 ± 14.8% for ARS and ARS+US, respectively). After day 7, the change in perfusion decreased, with a difference of 12.7 ± 6.7 and 25.8 ± 6.3% on day 14 for ARS and ARS+US, respectively. The greatest changes in perfusion induced by fibrin or fibrin+bFGF was observed on day 3 (7.7 ± 5.0 and 20.9 ± 7.0% for fibrin and fibrin+bFGF, respectively). There were significant differences between ARS and ARS+US on days 7 and 10, and no differences between fibrin and fibrin+bFGF at any time point. The ARS condition yielded greater relative perfusion than fibrin on day 7, and ARS+US yielded a greater perfusion than both fibrin and fibrin+bFGF on days 7 and 10.
Figure 7.
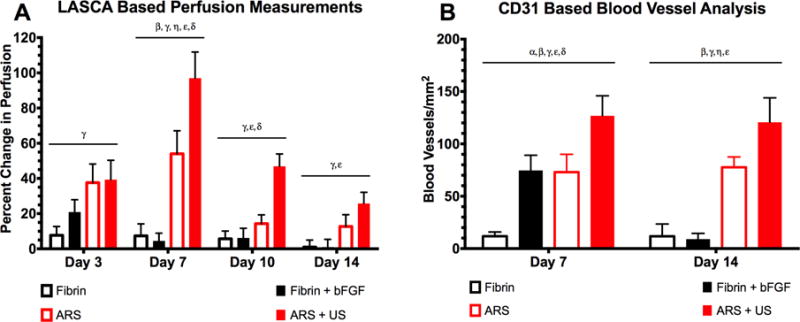
US increased perfusion and blood vessel growth in the bFGF-loaded ARSs (A) Quantification of LASCA images using ROIs. The greatest change in perfusion was observed on day 7, with ARS+US exhibiting greater perfusion than ARS. The differences between ARS and ARS+US were significant on days 7 and 10. All data is represented as mean ± standard error of the mean for n = 8 ARSs (days 1–7) and n = 4 ARSs (days 10 and 14). Statistically significant differences (p < 0.05) are denoted as follows. β: Fibrin vs. ARS; γ: Fibrin vs. ARS+US; η: Fibrin+bFGF vs. ARS; ε: Fibrin+bFGF vs. ARS+US; δ: ARS vs. ARS+US. (B) Blood vessels were identified using CD31 staining. On both days 7 and 14, the greatest blood vessel density was observed for ARS + US. All data is represented as mean ± standard error of the mean for n = 8 ARSs (days 1–7) and n = 4 ARSs (days 10 and 14). Statistically significant differences (p < 0.05) are denoted as follows. α: Fibrin vs. Fibrin+bFGF; β: Fibrin vs. ARS; γ: Fibrin vs. ARS+US; η: Fibrin+bFGF vs. ARS; ε: Fibrin+bFGF vs. ARS+US; δ: ARS vs. ARS+US.
Figure 7B shows the blood vessel density within the ARSs and fibrin implants, based on CD31-staining. On day 7, greater blood vessel density was observed in ARS+US versus ARS (126.8 ± 23.8 and ± 73.1 ± 21.2 vessels/mm2, respectively). All three groups containing bFGF displayed more blood vessels than the fibrin control on day 7. On day 14, greater vascularization was still observed in ARS+US versus ARS. However, blood vessel density regressed in the fibrin + bFGF group.
3.4 Degradation of the ARSs in vivo
The degradation of ARS and ARS+US is shown in Figure 8. At 14 days after implantation there was 36.3 ± 9.0 and 39.0 ± 9.1% remaining of the ARS and ARS+US, respectively. There were no significant differences between ARS and ARS+US at any time point.
Figure 8.
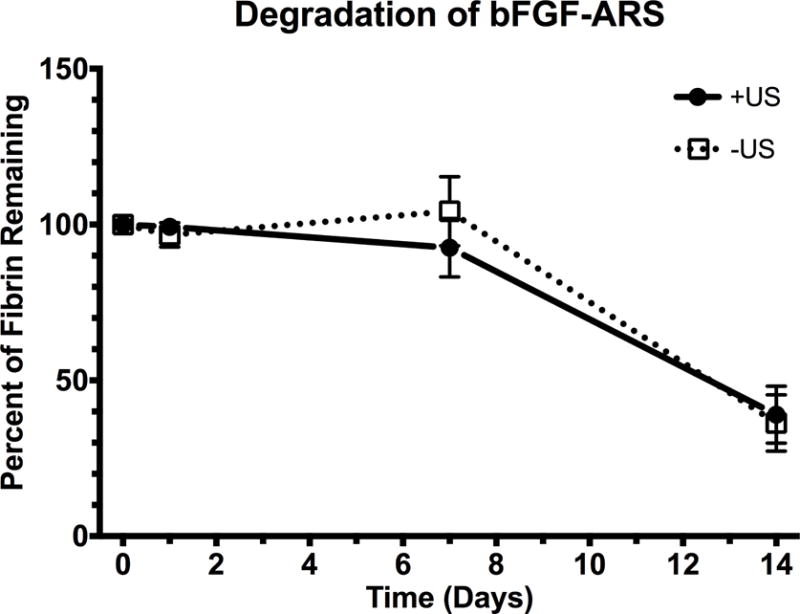
Degradation of the subcutaneously-implanted ARSs, which contained Alexa Fluor 647-labeled fibrinogen, was longitudinally monitored using a fluorescence, in vivo imaging system. All data is represented as mean ± standard error of the mean for n = 8 ARSs (days 1–7) and n = 4 ARSs (day 14).
4. Discussion
Many approaches have been used to obtain spatiotemporally-controlled delivery of growth factors from implantable scaffolds. In this work, US was shown to increase perfusion and angiogenesis via the controlled release of bFGF from an ARS. bFGF release was triggered by focused, megahertz range US, which can be applied non-invasively and in a spatiotemporally-defined manner. Unlike passive approaches, the ARS provides a method of actively modulating growth factor release after polymerization and implantation of the scaffold. The highly versatile nature of the ARS – including the ability to modulate properties of the emulsion, scaffold, and US [39] – suggests that the ARS could be beneficial in both basic and applied studies of therapeutic angiogenesis.
This is the first study to use monodispersed emulsions in ARSs. Previous studies have demonstrated several advantages of using monodispersed, sonosensitive emulsions including uniform ADV thresholds and improved stability during storage [48, 49]. Our prior publication showed that the droplet concentration and volume in an ARS with polydispersed PFH emulsions increased over time [39], likely due to a difference in the chemical potential of the material within the emulsions as defined by the Ostwald ripening phenomena [50]. A polydispersed emulsion is non-ideal for achieving spatiotemporally-controlled release from an ARS since ADV thresholds are inversely correlated with droplet size [51, 52] and larger emulsions have a higher probability of spontaneous vaporization at lower temperatures [41, 53]. ARSs with monodispersed PFH emulsion displayed greater stability (Figure 3D) with no significant change in concentration over time. We did observe a decrease in droplet volume that was associated with an increased CV (Supplemental Figure 1), which suggests that the W1 phase slowly leaked out of the double emulsion. This hypothesis is further supported by the non-zero release of bFGF in the absence of US or at subthreshold pressures (Figure 5A).
Figure 5A shows that the amount of bFGF released correlated with acoustic pressure for superthreshold pressures while little release was observed with subthreshold pressures. Relative to the US exposure at 8 MPa, less than 8% of bFGF was released in the absence of US by day 7, thus demonstrating stable payload retention for the –US condition. These release profiles are consistent with Figure 3C, which displays an ADV threshold of 2.2 ± 0.2 MPa. The majority of the bFGF release for superthreshold pressures occurred one day after US exposure. This is due to the lack of attenuating bubbles in the ARS prior to US exposure, which is identical to the – US condition shown in Figure 4. Subsequent US exposures on day 2 and onward did ultimately cause additional bFGF release, which is consistent with our previous study that demonstrated the benefit of daily US exposures [32]. The impact of bubble attenuation could be mitigated by formulating the ARS with a higher boiling point PFC that is more likely to recondense after ADV [54, 55] or by using US to dislodge bubbles from the ARS by enhancing fibrin degradation [32].
bFGF is known to bind fibrin irreversibly with nanomolar affinity via heparin-binding domains [56]. Therefore, a fraction of the bFGF released from the emulsion binds to fibrin within the ARS, thus hindering its release. The mechanisms by which US interacts with bFGF in the ARS were outside of the scope of the current study, but warrant further investigation. For example, we previously demonstrated that US can increase both the release of unencapsulated dextran from a conventional fibrin hydrogel and the degradation rate of an ARS [32]. Therefore, US could facilitate diffusion of bFGF in the ARS, though it is important to note that unlike dextran, bFGF displays a high affinity for fibrin [57].
As seen in Figure 4, the gas bubbles generated by ADV persisted within the ARS. The following mechanisms can potentially explain this observation. The bulk boiling point of PFH, the sonosensitive phase within the ARS, is 56°C. When formulated as droplets, the boiling point of PFH is higher due to the Laplace pressure [51, 52]. Therefore, it is expected that PFH should form transient bubbles that ultimately recondense, unless PFH existed as a supercooled gas. Alternatively, the persistent bubbles could consist of gas, which was initially dissolved in the liquid PFH due to its high gas solubility [58–60], and that nucleated following ADV. As shown in our prior study [33]. the consolidation of the fibrin surrounding each bubble could also facilitate the persistence of the bubbles in the ARS. As shown macroscopically in Figure 4, the bubbles generated in the ARSs due to ADV increase in size from day 1 (i.e., the first day of US exposure) to day 2. This is due to diffusion of dissolved gases within the media overlying the ARS into the PFH bubbles [35]. This gas modulating capacity of the ARS could potentially explain why ARSs have been shown to increase angiogenesis even in the absence of angiogenic growth factors in the W1 phase of the emulsion [32]. However, the angiogenic response induced following release of bFGF from the ARS (Figure 7B) is significantly greater than without bFGF.
The bioactivity of the bFGF released in the in vitro experiments was assessed by measuring the proliferation of NR-6-R cells following incubation with releasates of known bFGF concentration. Proliferation was normalized relative to that obtained with freshly prepared bFGF standards in serum free media (Supplemental Figure 2). In most cases, proliferation was greater than 100% (Figure 5B). We have shown in vitro that fibrin gels and ARSs degrade over time, both in the presence and absence of US [32]. Thus, the releasate added to the NR-6-R cells contained some soluble components from this degradation. Prior studies demonstrated that fibrin promotes the proliferation of various types of cells [61–63], which could explain the enhanced proliferation observed in Figure 5B.
The bioactivity measured for both ARS conditions was lower than a fibrin gel containing non-encapsulated bFGF. There are two possible explanations for this: 1) acoustic mechanisms (i.e., ADV and/or IC) and 2) the method by which the primary emulsion was prepared. Figure 3C shows that the IC threshold was 4.8 ± 1.5 MPa. Thus, there are instances of IC at 4 MPa and sustained IC at 8 MPa. The rapid expansion and collapse of a bubble during IC can generate very high temperatures and velocities at the bubble site, which can lead to molecular degradation, cellular damage, and sonoporation [64]. Given that there was no significant difference in bioactivity between 4 and 8 MPa, IC is not likely the main mechanism. ADV can also generate high fluid velocities as the PFC within the droplet transitions from a liquid into a gas [34], which can lead to cellular deplating [36, 65] and sonoporation [66]. Both 4 and 8 MPa are superthreshold for ADV, so ADV itself could be impacting the bioactivity of bFGF. A reduction in the pulse length or pulse repetition frequency could reduce the impact of ADV. Another possibility is that the bioactivity of the bFGF was affected by sonication at 20 kHz, the method used to produce the primary emulsion (W1/PFC). The use of a microfluidic device that enables the formation of the double emulsion using two sequential junctions would obviate the need for sonication, which has been shown to impact protein structure and cause protein aggregation [67].
Significantly greater perfusion and angiogenesis were observed for ARS + US versus ARS. Both ARS conditions yielded more sustained increases in perfusion and angiogenesis compared to delivery using a conventional fibrin scaffold (Figure 7). Burst release of bFGF occurs when the growth factor is incorporated directly into a conventional fibrin scaffold [68, 69]. This burst release, coupled with the lack of physiologic demand of vascularization in a subcutaneous implantation model, lead to a transient increase in both perfusion and blood vessel growth for fibrin + bFGF. Vessel regression could explain why the fibrin + bFGF group displayed lower perfusion than ARS and ARS + US groups on day 7 yet had the same blood vessel density, based on CD31 staining, as the ARS group. Since vessels lacking perfusion are prone to regression [70, 71], it is possible that vessels in the fibrin + bFGF group did not mature enough to acquire a substantial blood flow. Additionally, it is also important to consider that perfusion was monitored using a LASCA system, which relies on speckle contrast generated by moving erythrocytes. This technique inherently lacks axial (i.e., in plane) spatial resolution due to its two-dimensional nature. Thus, unlike blood vessel counting via tissue sectioning, the perfusion measurements were not restricted to the axial location of the implant and thereby included effects within the implant and in overlying tissue layers. Additionally, the perfusion measurements could include effects related to both angiogenesis and arteriogenesis, the latter of which would not change the number of vessels. On day 14, the trends observed with both the perfusion and immunohistochemical data were consistent for the experimental groups, with blood vessels regressing in fibrin + bFGF to a level similar to that found with fibrin only.
The degradation of ARSs is an important component of the controlled release process that may affect the uncontrolled release of the bFGF. The degradation may be due to factors within the ARS or the subcutaneous environment such as protease impurities in the starting fibrinogen [72], uptake and clearance by blood and lymphatic vessels [73], and US exposure [32]. Prior studies have shown that US exposure can disrupt hydrogel crosslinking as well as enhance diffusion through the creation of micropores [74, 75]. The results in Figure 8 are consistent with our prior work conducted with Alexa-Fluor 680 dextran loaded emulsions [32], where US did not impact the in vivo degradation rate of ARSs. In the current study, a slower degradation rate over the first 7 days was observed compared with our prior study. This difference could be due to the use of monodispersed versus polydispersed emulsions.
5. Conclusion
Here we show that controlled release of bioactive bFGF is possible using ARSs with monodispersed emulsions in conjunction with non-invasive, focused ultrasound. Monodispersed, double emulsions were made in a two-step approach by first sonicating the primary emulsion followed by generating a double emulsion using a microfluidic device with a flow focusing geometry. In vitro studies showed that the amount of bFGF released was dependent on the acoustic pressure of the US exposure, and that bFGF release could be delayed by postponing the initial US exposure. In addition, the bioactivity of the released bFGF was independent of the acoustic pressure used for US exposure as well as the time at which it was measured. Although the bioactivity of the bFGF released from the ARS was somewhat lower than unencapsulated bFGF, overall, ARSs with monodispered emulsions displayed better stability than was previously observed with polydispersed emulsions. In vivo studies demonstrated that controlled release of bFGF from an ARS exposed to US increased perfusion and blood vessel formation compared to an ARS without US. Both ARS conditions yielded greater perfusion and blood vessel formation than fibrin alone or a conventional fibrin scaffold doped with bFGF. US exposure did not affect the in vivo degradation of the ARS. These results show that ARSs can be used for in vivo controlled release of pro-angiogenic growth factors for both basic science and applied studies of therapeutic angiogenesis. Future work will focus on improving the bioactivity of the bFGF from the ARS as well as establishing proof-of-concept in an animal model of ischemia.
Supplementary Material
Supplemental Figure 1: Stability of the ARS (n=5), specifically the emulsions within the ARS, when placed in a cell culture incubator at 37°C. Statistically significant differences (p < 0.05) relative to day 0 for n=5 gels are denoted by α for mean diameter and β for coefficient of variance.
Supplemental Figure 2: The proliferation of NR-6-R cells when incubated with increasing concentrations of freshly prepared bFGF. Proliferation was assessed after 44 hours using the CellTiter 96 assay for n=10 wells/bFGF concentration.
Acknowledgments
This work was supported by NIH grant R21AR065010 (MLF) and the Basic Radiological Sciences Innovative Research Award (MLF). AM was supported by the National Science Foundation Graduate Student Research Fellowship (Grant No. DGE 1256260). EGO and ML were supported by funds from the Undergraduate Research Opportunity Program. Special thanks to Dr. Allen F. Brooks for aiding in the synthesis of the fluorosurfactant used to formulate the double emulsions.
Footnotes
Publisher's Disclaimer: This is a PDF file of an unedited manuscript that has been accepted for publication. As a service to our customers we are providing this early version of the manuscript. The manuscript will undergo copyediting, typesetting, and review of the resulting proof before it is published in its final citable form. Please note that during the production process errors may be discovered which could affect the content, and all legal disclaimers that apply to the journal pertain.
References
- 1.Cao RH, Brakenhielm E, Pawliuk R, Wariaro D, Post MJ, Wahlberg E, et al. Angiogenic synergism, vascular stability and improvement of hind-limb ischemia by a combination of PDGF-BB and FGF-2. Nat Med. 2003;9:604–13. doi: 10.1038/nm848. [DOI] [PubMed] [Google Scholar]
- 2.Li J, Wei YQ, Liu K, Yuan C, Tang YJ, Quan QL, et al. Synergistic effects of FGF-2 and PDGF-BB on angiogenesis and muscle regeneration in rabbit hindlimb ischemia model. Microvasc Res. 2010;80:10–7. doi: 10.1016/j.mvr.2009.12.002. [DOI] [PubMed] [Google Scholar]
- 3.Awada HK, Johnson NR, Wang YD. Sequential delivery of angiogenic growth factors improves revascularization and heart function after myocardial infarction. Journal of Controlled Release. 2015;207:7–17. doi: 10.1016/j.jconrel.2015.03.034. [DOI] [PMC free article] [PubMed] [Google Scholar]
- 4.Richardson TP, Peters MC, Ennett AB, Mooney DJ. Polymeric system for dual growth factor delivery. Nat Biotechnol. 2001;19:1029–34. doi: 10.1038/nbt1101-1029. [DOI] [PubMed] [Google Scholar]
- 5.Phelps EA, Landazuri N, Thule PM, Taylor WR, Garcia AJ. Bioartificial matrices for therapeutic vascularization. Proceedings of the National Academy of Sciences of the United States of America. 2010;107:3323–8. doi: 10.1073/pnas.0905447107. [DOI] [PMC free article] [PubMed] [Google Scholar]
- 6.Lederman RJ, Mendelsohn FO, Anderson RD, Saucedo JF, Tenaglia AN, Hermiller JB, et al. Therapeutic angiogenesis with recombinant fibroblast growth factor-2 for intermittent claudication (the TRAFFIC study): a randomised trial. Lancet. 2002;359:2053–8. doi: 10.1016/s0140-6736(02)08937-7. [DOI] [PubMed] [Google Scholar]
- 7.Lazarous DF, Unger EF, Epstein SE, Stine A, Arevalo JL, Chew EY, et al. Basic fibroblast growth factor in patients with intermittent claudication: Results of a phase I trial. J Am Coll Cardiol. 2000;36:1239–44. doi: 10.1016/s0735-1097(00)00882-2. [DOI] [PubMed] [Google Scholar]
- 8.Cooper LT, Hiatt WR, Creager MA, Regensteiner JG, Casscells W, Isner JM, et al. Proteinuria in a placebo-controlled study of basic fibroblast growth factor for intermittent claudication. Vasc Med. 2001;6:235–9. doi: 10.1177/1358836x0100600406. [DOI] [PubMed] [Google Scholar]
- 9.Makinen K, Manninen H, Hedman M, Matsi P, Mussalo H, Alhava E, et al. Increased vascularity detected by digital subtraction angiography after VEGF gene transfer to human lower limb artery: a randomized, placebo-controlled, double-blinded phase II study. Molecular therapy : the journal of the American Society of Gene Therapy. 2002;6:127–33. doi: 10.1006/mthe.2002.0638. [DOI] [PubMed] [Google Scholar]
- 10.Rajagopalan S, Mohler ER, Lederman RJ, Mendelsohn FO, Saucedo JF, Goldman CK, et al. Regional angiogenesis with vascular endothelial growth factor in peripheral arterial disease - A phase II randomized, double-blind, controlled study of adenoviral delivery of vascular endothelial growth factor 121 in patients with disabling intermittent claudication. Circulation. 2003;108:1933–8. doi: 10.1161/01.CIR.0000093398.16124.29. [DOI] [PubMed] [Google Scholar]
- 11.Powell RJ, Simons M, Mendelsohn FO, Daniel G, Henry TD, Koga M, et al. Results of a double-blind, placebo-controlled Study to Assess the Safety of Intramuscular Injection of Hepatocyte Growth Factor Plasmid to Improve Limb Perfusion in Patients with Critical Limb Ischemia. Circulation. 2008;118:58–65. doi: 10.1161/CIRCULATIONAHA.107.727347. [DOI] [PubMed] [Google Scholar]
- 12.Morishita R, Aoki M, Hashiya N, Makino H, Yamasaki K, Azuma J, et al. Safety evaluation of clinical gene therapy using hepatocyte growth factor to treat peripheral arterial disease. Hypertension. 2004;44:203–9. doi: 10.1161/01.HYP.0000136394.08900.ed. [DOI] [PubMed] [Google Scholar]
- 13.Grochot-Przeczek A, Dulak J, Jozkowicz A. Therapeutic angiogenesis for revascularization in peripheral artery disease. Gene. 2013;525:220–8. doi: 10.1016/j.gene.2013.03.097. [DOI] [PubMed] [Google Scholar]
- 14.Blatchley MR, Gerecht S. Acellular implantable and injectable hydrogels for vascular regeneration. Biomed Mater. 2015;10 doi: 10.1088/1748-6041/10/3/034001. [DOI] [PubMed] [Google Scholar]
- 15.Briquez PS, Clegg LE, Martino MM, Mac Gabhann F, Hubbell JA. Design principles for therapeutic angiogenic materials. Nat Rev Mater. 2016;1 [Google Scholar]
- 16.Comerota AJ, Throm RC, Miller KA, Henry T, Chronos N, Laird J, et al. Naked plasmid DNA encoding fibroblast growth factor type I for the treatment of end-stage unreconstructible lower extremity ischemia: Preliminary results of a phase I trial. J Vasc Surg. 2002;35:930–6. doi: 10.1067/mva.2002.123677. [DOI] [PubMed] [Google Scholar]
- 17.Nikol S, Baumgartner I, Van Belle E, Diehm C, Visona A, Capogrossi MC, et al. Therapeutic angiogenesis with intramuscular NV1FGF improves amputation-free survival in patients with critical limb ischemia. Molecular Therapy. 2008;16:972–8. doi: 10.1038/mt.2008.33. [DOI] [PubMed] [Google Scholar]
- 18.Belch J, Hiatt WR, Baumgartner I, Driver IV, Nikol S, Norgren L, et al. Effect of fibroblast growth factor NV1FGF on amputation and death: a randomised placebo-controlled trial of gene therapy in critical limb ischaemia. Lancet. 2011;377:1929–37. doi: 10.1016/S0140-6736(11)60394-2. [DOI] [PubMed] [Google Scholar]
- 19.Kusumanto YH, van Weel V, Mulder NH, Smit AJ, van den Dungen JJ, Hooymans JM, et al. Treatment with intramuscular vascular endothelial growth factor gene compared with placebo for patients with diabetes mellitus and critical limb ischemia: a double-blind randomized trial. Hum Gene Ther. 2006;17:683–91. doi: 10.1089/hum.2006.17.683. [DOI] [PubMed] [Google Scholar]
- 20.Baumgartner I, Pieczek A, Manor O, Blair R, Kearney M, Walsh K, et al. Constitutive expression of phVEGF165 after intramuscular gene transfer promotes collateral vessel development in patients with critical limb ischemia. Circulation. 1998;97:1114–23. doi: 10.1161/01.cir.97.12.1114. [DOI] [PubMed] [Google Scholar]
- 21.Lei P, Padmashali RM, Andreadis ST. Cell-controlled and spatially arrayed gene delivery from fibrin hydrogels. Biomaterials. 2009;30:3790–9. doi: 10.1016/j.biomaterials.2009.03.049. [DOI] [PMC free article] [PubMed] [Google Scholar]
- 22.Yang HS, Bhang SH, Hwang JW, Kim DI, Kim BS. Delivery of Basic Fibroblast Growth Factor Using Heparin-Conjugated Fibrin for Therapeutic Angiogenesis. Tissue Eng Pt A. 2010;16:2113–9. doi: 10.1089/ten.TEA.2009.0673. [DOI] [PubMed] [Google Scholar]
- 23.Losi P, Briganti E, Errico C, Lisella A, Sanguinetti E, Chiellini F, et al. Fibrin-based scaffold incorporating VEGF- and bFGF-loaded nanoparticles stimulates wound healing in diabetic mice. Acta Biomaterialia. 2013;9:7814–21. doi: 10.1016/j.actbio.2013.04.019. [DOI] [PubMed] [Google Scholar]
- 24.Kniazeva E, Kachgal S, Putnam AJ. Effects of Extracellular Matrix Density and Mesenchymal Stem Cells on Neovascularization In Vivo. Tissue Eng Pt A. 2011;17:905–14. doi: 10.1089/ten.tea.2010.0275. [DOI] [PMC free article] [PubMed] [Google Scholar]
- 25.Ruhrberg C, Gerhardt H, Golding M, Watson R, Ioannidou S, Fujisawa H, et al. Spatially restricted patterning cues provided by heparin-binding VEGF-A control blood vessel branching morphogenesis. Genes & development. 2002;16:2684–98. doi: 10.1101/gad.242002. [DOI] [PMC free article] [PubMed] [Google Scholar]
- 26.Abe Y, Ozaki Y, Kasuya J, Yamamoto K, Ando J, Sudo R, et al. Endothelial progenitor cells promote directional three-dimensional endothelial network formation by secreting vascular endothelial growth factor. PloS one. 2013;8:e82085. doi: 10.1371/journal.pone.0082085. [DOI] [PMC free article] [PubMed] [Google Scholar]
- 27.Li XM, Wang JH, Su GH, Zhou ZM, Shi JW, Liu LR, et al. Spatiotemporal control over growth factor delivery from collagen-based membrane. Journal of Biomedical Materials Research Part A. 2012;100A:396–405. doi: 10.1002/jbm.a.33282. [DOI] [PubMed] [Google Scholar]
- 28.Silva EA, Mooney DJ. Spatiotemporal control of vascular endothelial growth factor delivery from injectable hydrogels enhances angiogenesis. Journal of thrombosis and haemostasis : JTH. 2007;5:590–8. doi: 10.1111/j.1538-7836.2007.02386.x. [DOI] [PubMed] [Google Scholar]
- 29.Silva EA, Mooney DJ. Effects of VEGF temporal and spatial presentation on angiogenesis. Biomaterials. 2010;31:1235–41. doi: 10.1016/j.biomaterials.2009.10.052. [DOI] [PMC free article] [PubMed] [Google Scholar]
- 30.Brudno Y, Ennett-Shepard AB, Chen RR, Aizenberg M, Mooney DJ. Enhancing microvascular formation and vessel maturation through temporal control over multiple pro-angiogenic and pro-maturation factors. Biomaterials. 2013;34:9201–9. doi: 10.1016/j.biomaterials.2013.08.007. [DOI] [PMC free article] [PubMed] [Google Scholar]
- 31.Chen RR, Silva EA, Yuen WW, Mooney DJ. Spatio-temporal VEGF and PDGF delivery patterns blood vessel formation and maturation. Pharmaceutical research. 2007;24:258–64. doi: 10.1007/s11095-006-9173-4. [DOI] [PubMed] [Google Scholar]
- 32.Moncion A, Arlotta KJ, O’Neill EG, Lin M, Mohr LA, Franceschi RT, et al. In vitro and in vivo assessment of controlled release and degradation of acoustically responsive scaffolds. Acta Biomaterialia. 2016;46:221–33. doi: 10.1016/j.actbio.2016.09.026. [DOI] [PMC free article] [PubMed] [Google Scholar]
- 33.Fabiilli ML, Wilson CG, Padilla F, Martin-Saavedra FM, Fowlkes JB, Franceschi RT. Acoustic droplet-hydrogel composites for spatial and temporal control of growth factor delivery and scaffold stiffness. Acta Biomaterialia. 2013 doi: 10.1016/j.actbio.2013.03.027. [DOI] [PMC free article] [PubMed] [Google Scholar]
- 34.Kripfgans OD, Fabiilli ML, Carson PL, Fowlkes JB. On the acoustic vaporization of micrometer-sized droplets. The Journal of the Acoustical Society of America. 2004;116:272–81. doi: 10.1121/1.1755236. [DOI] [PubMed] [Google Scholar]
- 35.Kripfgans OD, Fowlkes JB, Miller DL, Eldevik OP, Carson PL. Acoustic droplet vaporization for therapeutic and diagnostic applications. Ultrasound in Medicine and Biology. 2000;26:1177–89. doi: 10.1016/s0301-5629(00)00262-3. [DOI] [PubMed] [Google Scholar]
- 36.Fabiilli ML, Haworth KJ, Sebastian IE, Kripfgans OD, Carson PL, Fowlkes JB. Delivery of chlorambucil using an acoustically-triggered perfluoropentane emulsion. Ultrasound in Medicine and Biology. 2010;36:1364–75. doi: 10.1016/j.ultrasmedbio.2010.04.019. [DOI] [PMC free article] [PubMed] [Google Scholar]
- 37.Fabiilli ML, Lee JA, Kripfgans OD, Carson PL, Fowlkes JB. The release of thrombin, using acoustic droplet vaporization (ADV), from perfluoropentane double emulsions. IEEE International Ultrasonics Symposium. 2010 [Google Scholar]
- 38.Fabiilli ML, Lee JA, Kripfgans OD, Carson PL, Fowlkes JB. Delivery of water-soluble drugs using acoustically triggered perfluorocarbon double emulsions. Pharmaceutical research. 2010;27:2753–65. doi: 10.1007/s11095-010-0277-5. [DOI] [PMC free article] [PubMed] [Google Scholar]
- 39.Moncion A, Arlotta KJ, Kripfgans OD, Fowlkes JB, Carson PL, Putnam AJ, et al. Design and Characterization of Fibrin-Based Acoustically Responsive Scaffolds for Tissue Engineering Applications. Ultrasound in Medicine and Biology. 2016;42:257–71. doi: 10.1016/j.ultrasmedbio.2015.08.018. [DOI] [PMC free article] [PubMed] [Google Scholar]
- 40.Orizondo RA, Babcock CI, Fabiilli ML, Pavlovsky L, Fowlkes JB, Younger JG, et al. Characterization of a reverse-phase perfluorocarbon emulsion for the pulmonary delivery of tobramycin. Journal of aerosol medicine and pulmonary drug delivery. 2014;27:392–9. doi: 10.1089/jamp.2013.1058. [DOI] [PMC free article] [PubMed] [Google Scholar]
- 41.Schad KC, Hynynen K. In vitro characterization of perfluorocarbon droplets for focused ultrasound therapy. Physics in Medicine and Biology. 2010;55:4933–47. doi: 10.1088/0031-9155/55/17/004. [DOI] [PubMed] [Google Scholar]
- 42.Reznik N, Williams R, Burns PN. Investigation of Vaporized Submicron Perfluorocarbon Droplets as an Ultrasound Contrast Agent. Ultrasound in Medicine and Biology. 2011;37:1271–9. doi: 10.1016/j.ultrasmedbio.2011.05.001. [DOI] [PubMed] [Google Scholar]
- 43.Garvin KA, Hocking DC, Dalecki D. Controlling the Spatial Organization of Cells and Extracellular Matrix Proteins in Engineered Tissues Using Ultrasound Standing Wave Fields. Ultrasound in Medicine and Biology. 2010;36:1919–32. doi: 10.1016/j.ultrasmedbio.2010.08.007. [DOI] [PMC free article] [PubMed] [Google Scholar]
- 44.Rizzino A, Ruff E. Fibroblast growth factor induces the soft agar growth of two non-transformed cell. In Vitro Cell Dev Biol. 1986 Dec;22(12):749–55. doi: 10.1007/BF02621092. [DOI] [PubMed] [Google Scholar]
- 45.Services PT, editor. Promega. CellTiter 96® AQueous One Solution Cell Proliferation Assay. 2012. [Google Scholar]
- 46.Vigen M, Ceccarelli J, Putnam AJ. Protease-Sensitive PEG Hydrogels Regulate Vascularization In Vitro and In Vivo. Macromol Biosci. 2014;14:1368–79. doi: 10.1002/mabi.201400161. [DOI] [PMC free article] [PubMed] [Google Scholar]
- 47.Nor JE, Peters MC, Christensen JB, Sutorik MM, Linn S, Khan MK, et al. Engineering and characterization of functional human microvessels in immunodeficient mice. Laboratory Investigation. 2001;81:453–63. doi: 10.1038/labinvest.3780253. [DOI] [PubMed] [Google Scholar]
- 48.Martz TD, Sheeran PS, Bardin D, Lee AP, Dayton PA. Precision Manufacture of Phase-Change Perfluorocarbon Droplets Using Microfluidics. Ultrasound Med Biol. 2011;37:1952–7. doi: 10.1016/j.ultrasmedbio.2011.08.012. [DOI] [PMC free article] [PubMed] [Google Scholar]
- 49.Bardin D, Martz TD, Sheeran PS, Shih R, Dayton PA, Lee AP. High-speed, clinical-scale microfluidic generation of stable phase-change droplets for gas embolotherapy. Lab on a Chip. 2011;11:3990–8. doi: 10.1039/c1lc20615j. [DOI] [PMC free article] [PubMed] [Google Scholar]
- 50.Taylor P. Ostwald ripening in emulsions. Advances in Colloid and Interface Science. 1998;75:107–63. doi: 10.1016/s0001-8686(03)00113-1. [DOI] [PubMed] [Google Scholar]
- 51.Rapoport NY, Kennedy AM, Shea JE, Scaife CL, Nam K-H. Controlled and targeted tumor chemotherapy by ultrasound-activated nanoemulsions/microbubbles. Journal of Controlled Release. 2009;138:268–76. doi: 10.1016/j.jconrel.2009.05.026. [DOI] [PMC free article] [PubMed] [Google Scholar]
- 52.Sheeran PS, Wong VP, Luois S, McFarland RJ, Ross WD, Feingold S, et al. Decafluorobutane as a Phase-Change Contrast Agent for Low-Energy Extravascular Ultrasonic Imaging. Ultrasound Med Biol. 2011;37:1518–30. doi: 10.1016/j.ultrasmedbio.2011.05.021. [DOI] [PMC free article] [PubMed] [Google Scholar]
- 53.Fabiilli ML, Haworth KJ, Fakhri NH, Kripfgans OD, Carson PL, Fowlkes JB. The Role of Inertial Cavitation in Acoustic Droplet Vaporization. IEEE Transactions on Ultrasonics, Ferroelectrics, and Frequency Control. 2009;56:1006–17. doi: 10.1109/TUFFC.2009.1132. [DOI] [PMC free article] [PubMed] [Google Scholar]
- 54.Rapoport N, Nam KH, Gupta R, Gao Z, Mohan P, Payne A, et al. Ultrasound-mediated tumor imaging and nanotherapy using drug loaded, block copolymer stabilized perfluorocarbon nanoemulsions. Journal of controlled release : official journal of the Controlled Release Society. 2011;153:4–15. doi: 10.1016/j.jconrel.2011.01.022. [DOI] [PMC free article] [PubMed] [Google Scholar]
- 55.Reznik N, Shpak O, Gelderblom EC, Williams R, de Jong N, Versluis M, et al. The efficiency and stability of bubble formation by acoustic vaporization of submicron perfluorocarbon droplets. Ultrasonics. 2013;53:1368–76. doi: 10.1016/j.ultras.2013.04.005. [DOI] [PubMed] [Google Scholar]
- 56.Sahni A, Odrljin T, Francis CW. Binding of basic fibroblast growth factor to fibrinogen and fibrin. J Biol Chem. 1998;273:7554–9. doi: 10.1074/jbc.273.13.7554. [DOI] [PubMed] [Google Scholar]
- 57.Martino MM, Briquez PS, Ranga A, Lutolf MP, Hubbell JA. Heparin-binding domain of fibrin(ogen) binds growth factors and promotes tissue repair when incorporated within a synthetic matrix. Proceedings of the National Academy of Sciences of the United States of America. 2013;110:4563–8. doi: 10.1073/pnas.1221602110. [DOI] [PMC free article] [PubMed] [Google Scholar]
- 58.Johnson JLH, Dolezal MC, Kerschen A, Matsunaga TO, Unger EC. In vitro comparison of dodecafluoropentane (DDFP), perfluorodecalin (PFD), and perfluoroctylbromide (PFOB) in the facilitation of oxygen exchange. Artificial cells, blood substitutes, and biotechnology. 2009;37:156–62. doi: 10.1080/10731190903043192. [DOI] [PubMed] [Google Scholar]
- 59.Riess JG. Oxygen Carriers (“Blood Substitutes”) - Raison d’Etre, Chemistry, and Some Physiology. Chemical Reviews. 2001;101:2797–919. doi: 10.1021/cr970143c. [DOI] [PubMed] [Google Scholar]
- 60.Dias AMA, Freire M, Coutinho JAP, Marrucho IM. Solubility of oxygen in liquid perfluorocarbons. Fluid Phase Equilibria. 2004;222:325–30. [Google Scholar]
- 61.Sha’ban M, Yoon SJ, Ko YK, Ha HJ, Kim SH, So JW, et al. Fibrin promotes proliferation and matrix production of intervertebral disc cells cultured in three-dimensional poly(lactic-co-glycolic acid) scaffold. Journal of Biomaterials Science-Polymer Edition. 2008;19:1219–37. doi: 10.1163/156856208785540163. [DOI] [PubMed] [Google Scholar]
- 62.Yamamoto M, Yanaga H, Nishina H, Watabe S, Mamba K. Fibrin stimulates the proliferation of human keratinocytes through the autocrine mechanism of transforming growth factor-alpha and epidermal growth factor receptor. Tohoku Journal of Experimental Medicine. 2005;207:33–40. doi: 10.1620/tjem.207.33. [DOI] [PubMed] [Google Scholar]
- 63.Pawelec KM, Best SM, Cameron RE, Wardale RJ. Scaffold architecture and fibrin gels promote meniscal cell proliferation. APL Materials. 2015;3 doi: 10.1007/s10856-014-5349-3. [DOI] [PubMed] [Google Scholar]
- 64.Ferrara KW, Pollard R, Borden MA. Ultrasound microbubble contrast agents: fundamentals and application to gene and drug delivery. Annual Review of Biomedical Engineering. 2007;9:425–47. doi: 10.1146/annurev.bioeng.8.061505.095852. [DOI] [PubMed] [Google Scholar]
- 65.Seda R, Li DS, Fowlkes JB, Bull JL. Characterization of Bioeffects on Endothelial Cells under Acoustic Droplet Vaporization. Ultrasound in medicine & biology. 2015;41:3241–52. doi: 10.1016/j.ultrasmedbio.2015.07.019. [DOI] [PMC free article] [PubMed] [Google Scholar]
- 66.Fix SM, Novell A, Yun Y, Dayton PA, Arena CB. An evaluation of the sonoporation potential of low-boiling point phase-change ultrasound contrast agents in vitro. Journal of Therapeutic Ultrasound. 2017;5:1–11. doi: 10.1186/s40349-017-0085-z. [DOI] [PMC free article] [PubMed] [Google Scholar]
- 67.Stathopulos PB, Scholz GA, Hwang YM, Rumfeldt JAO, Lepock JR, Meiering EM. Sonication of proteins causes formation of aggregates that resemble amyloid. Protein Science. 2004;13:3017–27. doi: 10.1110/ps.04831804. [DOI] [PMC free article] [PubMed] [Google Scholar]
- 68.Jeon O, Kang SW, Lim HW, Chung JH, Kim BS. Long-term and zero-order release of basic fibroblast growth factor from heparin-conjugated poly(L-lactide-co-glycolide) nanospheres and fibrin gel. Biomaterials. 2006;27:1598–607. doi: 10.1016/j.biomaterials.2005.08.030. [DOI] [PubMed] [Google Scholar]
- 69.Jeon O, Ryu SH, Chung JH, Kim BS. Control of basic fibroblast growth factor release from fibrin gel with heparin and concentrations of fibrinogen and thrombin. Journal of Controlled Release. 2005;105:249–59. doi: 10.1016/j.jconrel.2005.03.023. [DOI] [PubMed] [Google Scholar]
- 70.Ando J, Yamamoto K. Vascular Mechanobiology - Endothelial Cell Responses to Fluid Shear Stress. Circulation Journal. 2009;73:1983–92. doi: 10.1253/circj.cj-09-0583. [DOI] [PubMed] [Google Scholar]
- 71.Kom C, Augustin HG. Mechanisms of Vessel Pruning and Regression. Developmental Cell. 2015;34:5–17. doi: 10.1016/j.devcel.2015.06.004. [DOI] [PubMed] [Google Scholar]
- 72.Lucas MA, Fretto LJ, McKee PA. THE BINDING OF HUMAN-PLASMINOGEN TO FIBRIN AND FIBRINOGEN. J Biol Chem. 1983;258:4249–56. [PubMed] [Google Scholar]
- 73.Ikomi F, Hanna GK, Schmid-Schonbein GW. Size- and surface-dependent uptake of colloid particles into the lymphatic system. Lymphology. 1999;32:90–102. [PubMed] [Google Scholar]
- 74.Huebsch N, Kearney CJ, Zhao X, Kim J, Cezar CA, Suo Z, et al. Ultrasound-triggered disruption and self-healing of reversibly cross-linked hydrogels for drug delivery and enhanced chemotherapy. Proc Natl Acad Sci U S A. 2014;111:9762–7. doi: 10.1073/pnas.1405469111. [DOI] [PMC free article] [PubMed] [Google Scholar]
- 75.Cuignet OY, Baele PM, Van Obbergh LJ. A second-generation blood substitute (perflubron emulsion) increases the blood solubility of modern volatile anesthetics in vitro. Anesthesia and Analgesia. 2002;95:368–72. doi: 10.1097/00000539-200208000-00023. [DOI] [PubMed] [Google Scholar]
Associated Data
This section collects any data citations, data availability statements, or supplementary materials included in this article.
Supplementary Materials
Supplemental Figure 1: Stability of the ARS (n=5), specifically the emulsions within the ARS, when placed in a cell culture incubator at 37°C. Statistically significant differences (p < 0.05) relative to day 0 for n=5 gels are denoted by α for mean diameter and β for coefficient of variance.
Supplemental Figure 2: The proliferation of NR-6-R cells when incubated with increasing concentrations of freshly prepared bFGF. Proliferation was assessed after 44 hours using the CellTiter 96 assay for n=10 wells/bFGF concentration.