
Figure 7.
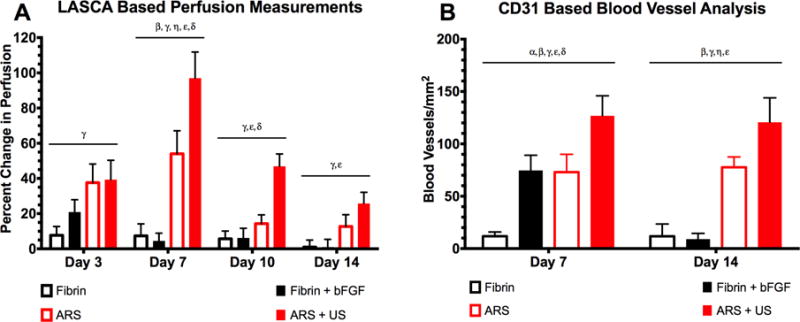
US increased perfusion and blood vessel growth in the bFGF-loaded ARSs (A) Quantification of LASCA images using ROIs. The greatest change in perfusion was observed on day 7, with ARS+US exhibiting greater perfusion than ARS. The differences between ARS and ARS+US were significant on days 7 and 10. All data is represented as mean ± standard error of the mean for n = 8 ARSs (days 1–7) and n = 4 ARSs (days 10 and 14). Statistically significant differences (p < 0.05) are denoted as follows. β: Fibrin vs. ARS; γ: Fibrin vs. ARS+US; η: Fibrin+bFGF vs. ARS; ε: Fibrin+bFGF vs. ARS+US; δ: ARS vs. ARS+US. (B) Blood vessels were identified using CD31 staining. On both days 7 and 14, the greatest blood vessel density was observed for ARS + US. All data is represented as mean ± standard error of the mean for n = 8 ARSs (days 1–7) and n = 4 ARSs (days 10 and 14). Statistically significant differences (p < 0.05) are denoted as follows. α: Fibrin vs. Fibrin+bFGF; β: Fibrin vs. ARS; γ: Fibrin vs. ARS+US; η: Fibrin+bFGF vs. ARS; ε: Fibrin+bFGF vs. ARS+US; δ: ARS vs. ARS+US.