

Abstract
The Flint Water Crisis (FWC) is divisible into four phases of child water-lead exposure risk: Phase A) before the switch in water source to the Flint River (our baseline); Phase B) after the switch in water source, but before boil water advisories; Phase C) after boil water advisories, but before the switch back to the baseline water source of the Detroit Water and Sewerage Department (DWSD); and Phase D) after the switch back to DWSD. The objective of this work is to estimate water-lead attributable movements in child blood lead levels (BLLs) that correspond with the four phases in the FWC. With over 21,000 geo-referenced and time-stamped blood lead samples from children in Genesee County drawn from January 01, 2013 to July 19, 2016, we develop a series of quasi-experimental models to identify the causal effect of water-lead exposure on child BLLs in Flint. We find that the switch in water source (transitioning from phase A to B) caused mean BLLs to increase by about 0.5 μg/dL, and increased the likelihood of a child presenting with a BLL ≥ 5 μg/dL by a factor of 1.91 to 3.50, implying an additional 561 children exceeding 5 μg/dL. We conservatively estimate cohort social costs (through lost earnings alone) of this increase in water-lead exposed children at $65 million, contrasted with expected annual savings of $2 million from switching water source. On the switch from Phase B to C, we find BLLs decreased about 50% from their initial rise following boil water advisories and subsequent water avoidance behaviors by households. Finally, the return to the baseline source water (Phase D) returned child BLLs to pre-FWC levels further implicating water-lead exposure as a causal source of child BLLs throughout the FWC.
Keywords: Child Health, Lead Exposure, Blood Lead Levels, Flint Water Crisis, Child BLLs
1. Introduction
From 1967 till April 2014, the City of Flint purchased treated water wholesale from the Detroit Water and Sewage Department (DWSD), now the Great Lakes Water Authority (GWLA). Throughout this period the Flint Water Service Center (FWSC) maintained a backup water treatment facility. Facing another expected increase in the price of treated water from the DWSD – prices nearly tripled ($/mcf) from 2002 to 2012 – Flint's Emergency Manager (EM), with the consent of City Council, decided to join the newly constituted Karegnondi Water Authority (KWA) in 2013. By joining the KWA, which was constructing its own pipeline to transmit raw water from the same DWSD source of Lake Huron, Flint officials anticipated savings of $600 million over the next 30 years (Lynch, 2016). In the interim, the City of Flint had the option of continuing to purchase treated water from DWSD or treat Flint River water at its own facility. After failing to come to an agreement on a short-term contract with DWSD, and in an effort to save $2 million annually in the meantime, Flint decided on the Flint River water source treated at their FWSC (Felton, 2014; Fonger, 2014).
Within a few weeks of the switch to Flint River water, residents started complaining about the taste and odor of their drinking water. In mid-May 2014, residents reported issues of skin inflammation in their children (Davis et al., 2016). During this time, water discoloration was observed throughout the distribution system (Felton, 2014; Veolia North America, 2015), and there was an unusually large number of water main breaks (Fonger, 2015). Starting in summer 2014, a number of water quality problems developed, some of which resulted in violations of Safe Water Drinking Act (SWDA) standards. Escherichia coli (E. coli) and total coliform violations resulted in the issuance of a series of boil water alerts (Emery, 2016; Masten et al., 2016). While boil advisories were not meant to address the problem of lead contaminated water – as the lead problem was not fully understood in this episode of the crisis – retrospective analyses of the period (see Christensen et al 2017) indicate a substantial and sustained increase in the purchase of bottled water among residents in Genesee County following the issuance of boil water alerts, indicating significant water avoidance by the local population.
By Aug. 31, 2015, Marc Edwards, a professor at Virginia Polytechnic Institute and State University, had analyzed 252 water samples from homes in Flint. He found that 20% of the samples had lead levels that exceeded the 15 μg/L action level (Edwards, 2015). In September, a team led by a local pediatrician, Mona Hanna-Attisha, published data showing that blood lead levels (BLLs) in children increased significantly after the switch to the Flint River water source (Hanna-Attisha et al., 2016). After much publicity regarding the lead problem, on October 16, 2015, the source water for the City of Flint was switched back to treated Lake Huron water supplied by DWSD.
One can divide this abbreviated description of events into four phases corresponding to meaningful breaks in the risk of child water-lead exposure: A) before switch; B) after switch prior to boil advisories; C) after switch after boil advisories; and D) after switch back. With an extraordinary dataset (secured by confidentiality agreement with the Michigan Department of Community Health, Childhood Lead Poisoning Prevention Project) of over 21,000 geo-referenced and time-stamped blood lead samples from children in Flint (and outside Flint in Genesee County) drawn from January 1st 2013 to July 19th 2016, we analytically leverage these four phases to identify the causal effect of water-lead exposure on child BLLs in Flint. We develop a series of difference-in-differences models to estimate water-lead attributable movements in child blood lead levels (BLLs) that correspond with exogenous breaks in the Flint Water Crisis (FWC).
Our work extends the work of Hanna-Attisha et al (2016) in multiple ways. First, by inclusion of many control groups - variously constituted by children residing at the periphery of Flint proper - we address confounding from other sources of lead exposure that are coincidental with the timing of the switch in water source (see Laidlaw et al. (2016)). Second, by division of the post-switch period into before and after the issuance of official boil water advisories, we capitalize on awareness and subsequent water avoidance behaviors of households as an additional source of variation in water-lead exposure risk. This provides some assessment of public health interventions undertaken during the crisis. Third, we extend the analysis of the FWC to the switch-back period, testing whether the return to Detroit water (and away from the highly corrosive Flint River water source) restored child BLLs to pre-crisis levels.
In analyses ahead, we evaluate how the switch to Flint River water influenced child mean BLLs in Flint. We determine the number of children that exceeded the CDCs guidance level of ≥ 5 μg/dL associated with the lead-contaminated drinking water and then calculate a conservative estimate of the cohort-specific damages through expected reductions in lifetime earnings. Consistent with the water-lead exposure source proposition, we evaluate how BLLs in Flint change following the issuance of advisories and subsequent water avoidance behaviors of affected households. Finally, we evaluate if BLLs in Flint returned to pre-FWC levels following the switch back to Detroit water. In the next section, we detail measurement and statistical decisions made to identify the water-lead exposure pathway.
2. Methods
2.1 Data
Blood lead data were obtained from the Michigan Department of Community Health (MDCH) by confidentiality agreement. The dataset contains blood samples on 21,403 children collected from January 1st 2013 through July 19th 2016, under the Healthy Homes and Lead Poisoning Prevention (HHLPP) program. The HHLPP is funded by the CDC and designed to support “lead poisoning prevention and surveillance services for children in Michigan.” Blood lead data are reported in micrograms per deciliter of blood (μg/dL). The MDCH data also contain information on the census block group residential location of each child, the precise date of blood sample collection, child date of birth (allowing one to derive child age at the moment of sample), child sex (male = 1, female = 0), and the method of blood draw (1= cutaneous; 0= venous). As with previous research (Zahran et al., In Press; Zahran et al., 2011), we analyze child BLL as a continuous variable (in μg/dL) and then as a binary variable of ≥ 5 μg/dL = 1, < 5 μg/dL = 0, corresponding to the CDCs present reference level of elevated blood lead.
2.2 Four Phases of the Flint Water Crisis
We divide the Flint Water Crisis (FWC) into four phases corresponding to exogenous breaks in child risk of water-lead exposure: A) before the switch in water source; B) after the switch in water source but before boil water advisories prompted by the identification of E. coli in the distribution system; C) after boil water advisories while still utilizing the Flint River as the source of drinking water; and D) after the return to DWSD water (now the GLWA). Phase A, the before switch period, is from January 1st 2013 to April 25th 2014. Phase B, the after switch/before boil advisory period, is from April 26th 2014 to September 14th 2014. Phase C, the after switch/after boil advisory period, is from September 15th 2014 to September 25th 2015. Phase D, the after switch back period, is from September 25th 2015 to July 19th 2016. The switch points from Phase A to B and from Phase C to D correspond to the dates when the source of water delivered to Flint residents were switched, going from Detroit (DWSD) to Flint River water, and then from Flint River back to Detroit water (GLWA). The switch point from Phase B to C is more ambiguous. From the 16th of August until the 14th of September 2014, City of Flint officials issued a series of targeted boil water advisories. While the motivation was not meant to account for water lead exposure risk – which remained unknown to relevant managerial and technical personnel at the time – the boil advisories induced water avoidance behaviors in the local population that substantially minimized the risk of water lead exposure.
In analyses that follow, the dates of phase transition (detailed above) are forwarded 30 days to variously account for the physical chemistry and physiology involved in the switch from one exposure phase to the next. In the switch from Detroit (Phase A) to Flint River water (Phase B), which occurred on April 25th 2014, we forward 30 days to account for the chemistry involved in the dissolve of passivation layers inside lead-based pipes in the Flint water system.1 This passivation lag of 30 days in the switch from Phase A to B is also consistent with the timing of complaints by residents with respect to the color, taste, and odor of drinking water (see Masten et al. (2016)). A 30 day lag in going from Phase B to C is also scientifically warranted to account for the known residence time of lead in child bloodstreams (Hu et al., 1998; Lidsky and Schneider, 2003; Rabinowitz, 1991). A physiological lag of 30 days guards against a potential period classification error where a child sampled in early Phase C might register an elevated blood lead level because of water lead exposures in Phase B. Finally, for both reasons of the time required for the restoration of a passivation layer and the residence time of lead in the bloodstream, a forward lag of 30 days is required in the movement from Phase C to D. Figure 1 summarizes the four phases of the FWC with lag adjustments.
Figure 1.
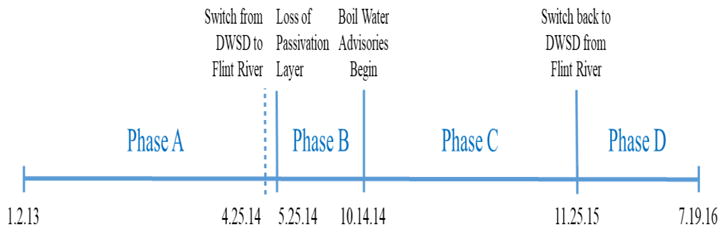
Lead exposure phases of the flint water crisis.
2.3 Econometric Approach
We develop a series of difference-in-differences analyses to identify movements in child BLLs corresponding to exogenous breaks in child water-lead exposure risk that divide the FWC into four periods. We estimate generalized least squares (LS) and logistic regression models with census block group random effects2 to account for unobserved conditions at the census block group scale – like exposure to accumulated lead in neighborhood soils (see Zahran et al. (2011)) and/or haphazardly removed or deteriorating lead-based paint (see Rabito et al. (2007)), among other factors – that meaningfully impact child BLLs. In all estimated equations detailed below, our first difference represents a period of child blood draw (sequentially as Phase A versus B; Phase C versus B; and Phase D versus A), and our second difference is geographical, corresponding to whether a child resides in Flint (and is therefore a recipient of Flint water) or is not a resident of Flint proper (but does reside in the shared County of Genesee, Michigan).
2.3.1 B versus A: Switch to Flint River Water
We start by estimating the child BLL effects of switching from Detroit to Flint River water by comparing Phase A (before switch) to Phase B (after switch, before advisories). This analysis reproduces the work of Hanna-Attisha et al. (2016), with two crucial exceptions: 1) we refine the control group (of children outside Flint, but within Genesee County) to account for time-coincident effects (like the well-known seasonal fluctuation in child BLLs) that can inflate pre-post differences within Flint; and 2) we censor the post-switch period to before the issuance of boil water advisories that induced water avoidance behaviors by households. Failing to account for this behavioral change can attenuate observed pre-post differences within Flint. Our design nets these potential biases. With that in mind, we first estimate a random effects generalized LS equation of child i's BLL sampled in place j, at time t:
| (1) |
where, Fij is an indicator variable = 1 if a child i&';s residence is in Flint, = 0 if not, PBit = 1 if the child is sampled in Phase B (corresponding the post-switch period but before the first boil advisory) and = 0 if sampled in Phase A, Mi is = 1 if the sampled child is male, Ai is the child age in years, Zt denotes year and quarterly fixed effects, Ci is = 1 if the blood draw was cutaneous, and Vj is the poverty rate in block group of child residence. The causal effect of the switch from Detroit to Flint River water is captured by the estimated difference-in-differences coefficient (δ), reflecting the interaction of F and P. Insofar as the switch from Detroit to Flint water statistically significantly increased child BLLs, then δ > 0 where p < 0.05.
The LS random effects model divides the residual term in two parts: 1) a block group-specific error component given by uj; and 2) a child-specific error component, which varies between children and block group, given by eijt. The neighborhood level residual uj is the difference between block group j's child blood lead mean and the overall mean, with the mean child blood lead for block group j being β0 + uj. The block group-specific error component is meant to capture the combined effects of unobserved census block characteristics. The child-specific residual eijt is the difference between observed blood lead level of child i and the average blood lead of children sharing block group j, where eijt = BLLijt. –(β0+uj). Both residual terms are assumed to be Gaussian with zero means: and .
Next, we estimate a random effects logistic equation for the probability of a child i in place j, at time t having a BLL ≥ 5:
| (2) |
where, Λ[·] is the CDF of the logistic distribution, with all other terms carry from Eq. (1). In the presentation of logit model results, we exponentiate the estimated coefficient δ to give the meaning of an odds ratio, with expδ > 1 indicating that the switch from Detroit to Flint River water increased child BLLs.
2.3.2 Estimating Social Costs of Switching to Flint River Water
To estimate one aspect of the social costs of the switch in water supply we use a standard syllogism in environmental health economics linking BLL to IQ point loss and IQ point loss to future earnings (Gould, 2009; Grosse et al., 2002; Schwartz, 1994). Multiplying 10,000 children ≤ 6 years of age (as per Census Bureau data) by the baseline risk of a child presenting with a BLL ≥ 5 μg/dL of 4.01 per 100, we derive the pre-switch period count of children with elevated blood lead. To estimate the count of additional children harmed by the switch in water supply, we leverage the exponentiated difference-in-differences coefficient from Eq. (2) and multiply by the baseline count of children with elevated blood lead. Next, we estimate population-wide IQ point loss before and after the switch to Flint River water by multiplying the estimated number of affected children by the average BLL level within BLL category of ≥ 5 μg/dL and the average IQ point loss per μg/dL (Gould 2009; Lanphear et al. 2005). The sum of IQ points lost attributable to the switch in water regime is quantified by taking the difference between the two periods. Following others (Grosse et al., 2002; Nevin et al., 2008; Salkever, 1995; Schwartz, 1994), each IQ point lost corresponds to a loss in the present discounted value of lifetime earnings of $28,881 (2014 USD). Multiplying this by the sum of IQ points lost provides a lower bound estimate of the social cost attributed to the switch.
2.3.3 C versus B: Boil Water Advisories
Next, we test whether boil water advisories issued by authorities in Flint (and subsequent behavioral adaptations by households) functioned to reduce the risk of water lead exposure by comparing Phase B (after switch, before advisories) to Phase C (after advisories, before returning to Detroit water). Authorities issued these advisories after positive tests for the presence of E. coli in the water supply. As shown in Figure 2, Google Trend search interest in the Flint-Saginaw-Bay City metropolitan area for “Flint + water” (daily time-step); “Flint + water + contamination” and “water + boil” (weekly time-step) increased noticeably in and around boil advisory dates, implying that boil water advisories reached the local population.
Figure 2.

Google trends search interest in Flint-Saginaw-Bay City region of Michigan. Search for “Notes: Flint water” presented at a daily time-step; “Flint water contamination” and “water boil” presented at weekly time-step. Flint water (daily time-step); Flint water contamination and water boil (weekly time-step)
While boil advisories (at the time) were not meant to address lead contamination of the water supply, they reinforced suspicion among residents and public interest organizations that the drinking water was unsafe. These advisories may have had the unintended effect of reducing child water-lead exposure. To test this possibility, and following the same sequence as before, we first estimate the following random effects generalized LS equation:
| (3) |
and then estimate a random effects logistic equation for the probability of a child i in place j, at time t having a BLL ≥ 5:
| (4) |
where, all terms carry from Eq. (1-2), with the exception of PCit = 1 if the child is sampled in Phase C (corresponding the post-switch period and after the last boil advisory) and PCit = 0 if sampled in Phase B (corresponding to the post-switch period but before the last boil advisory). The estimated coefficient (δ) now captures the causal effect of the boil advisories (and subsequent household behavioral adaptations) relative to the unwarned post-switch exposure period Insofar as advisories reduced the risk of water-lead exposure, and water-lead lead exposure is linked to child BLLs, we expect δ < 0 in the LS model and expδ < 1 in the logit model.
2.3.4 D versus A: Switch Back to Detroit Water
On the 24th of September, 2015, a Hurley Medical Center research team led by Dr. Mona Hanna-Attisha announced research showing measurable increases in child BLLs in Flint (Hanna-Attisha et al., 2016). The next day, Flint officials announced a water-lead advisory. A week later, after more than a year since residents first reported water quality problems, the Department of Health and Human Services and the Genesee County Health Department jointly announced a state of emergency and instructed residents to avoid drinking the water. On the 16th of October, Flint reconnected to the Detroit Water and Sewerage Department. By comparing BLLs during Phase A (the switch to Flint River water) versus Phase D (after the return back to Detroit water), the question we pursue in this section is whether the return to Detroit water returned the children of Flint to pre-water crisis BLLs.
In pursuit of this question, and as before, we first estimate a random effects generalized LS equation of child i sampled at place j, in time t:
| (5) |
After that we estimate a random effects logistic equation for the probability of a child i in place j, at time t having a BLL ≥ 5:
| (6) |
where all terms carry from Eq. (1-2), with the exception of PDit= 1 if the child is sampled in Phase D (corresponding the switch back to Detroit water period) and = 0 if sampled in Phase A corresponding to the before switch to Flint water period. The estimated coefficient (δ) now captures whether or not the switch back to Detroit water returned the city of Flint to pre-crisis lead exposure risk. Insofar as the restoration of the pre-crisis water supply returned the city to status quo risk, then we expect δ = 0 in the LS model and expδ = 1 in the logit model.
2.4 Sensitivity Tests
Across all specifications, we render a series of sensitivity tests involving adjustments to both treatment (i.e., Flint) and control groups (not Flint, Genesee County) as well as periods of observation. First, we limit our treatment group to Flint children residing within 1 mile of spatially targeted boil advisory areas. Second, we do the opposite, limiting our treatment group to children in Flint living outside boil advisory areas. Third, we test for differences in the BLLs of children residing within and outside risk areas. Fourth, we exclude children in our control group residing in townships/outlying cities in Genesee County, including only control group children proximate to Flint City boundaries. Finally, for tests detailing The Switch Back to Detroit Water, we censor the switch back period to before an observed surge in the blood lead sampling of children.3 Figure 3 spatially summarizes these treatment and control group adjustment decisions.
Figure 3. The City of Flint and Genesee County study areas.
3 Results
Table 1 reports descriptive statistics on child demographics, child BLLs, and the proportion of children with EBLLs by observation period and residential location.
Table 1. Descriptive statistics on child demographics and BLLs by phase period and residential location.
| Phase A | Phase B | Phase C | Phase D | |||||
|---|---|---|---|---|---|---|---|---|
| Flint | Not Flint | Flint | Not Flint | Flint | Not Flint | Flint | Not Flint | |
| Child Age | 2.373 | 2.125 | 2.285 | 2.164 | 2.199 | 1.967 | 2.908 | 2.359 |
| (1.297) | (1.234) | (1.276) | (1.279) | (1.363) | (1.195) | (1.718) | (1.531) | |
| Child Sex | 0.516 | 0.520 | 0.505 | 0.526 | 0.520 | 0.500 | 0.525 | 0.517 |
| (Male=1) | (0.498) | (0.500) | (0.500) | (0.500) | (0.500) | (0.500) | (0.499) | (0.500) |
| Cutaneous Blood | 0.549 | 0.620 | 0.527 | 0.633 | 0.583 | 0.695 | 0.545 | 0.614 |
| Draw | (0.498) | (0.485) | (0.500) | (0.482) | (0.493) | (0.461) | (0.498) | (0.487) |
| BLL | 2.382 | 2.112 | 2.972 | 2.297 | 2.683 | 2.286 | 2.295 | 2.209 |
| (2.045) | (1.576) | (2.277) | (1.234) | (2.466) | (1.370) | (1.853) | (1.752) | |
| EBLL (≥5 μg/dL=1) | 0.049 | 0.024 | 0.117 | 0.026 | 0.066 | 0.021 | 0.031 | 0.014 |
| (0.217) | (0.152) | (0.322) | (0.159) | (0.248) | (0.144) | (0.173) | (0.116) | |
Note: Standard deviation in parentheses.
3.1 B versus A: Switch to Flint River Water
Table 2 reports coefficients estimating the blood lead effects (in μg/dL) of switching the water supply in Flint from Detroit to the Flint River. Beginning with Column 1, including all children in both Flint and not Flint (but in Genesee County), we find that the switch to Flint River water increased BLLs in Flint by 0.445 μg/dL (95% CI: 0.249, 0.642). With a conditional pre-switch average of 2.416 μg/dL, our estimated effect constitutes an 18.4% increase in average BLLs. In Column 2, we exclude Flint children in high risk areas (i.e., boil advisory areas). The estimated switch effect decreases slightly to 0.347 μg/dL (95% CI: 0.124, 0.569), but is not statistically significantly different from our estimated δ in Column 1. In Column 3, we restrict our treatment group to Flint children residing in higher risk areas. Following the switch to Flint River water, BLLs increased among Flint children in high risk areas by 0.639 μg/dL (95% CI: 0.395, 0.883). Column 4 shows that observed differences between higher (Column 3) and lower (Column 2) risk children in Flint are not different from statistical chance (δ = 0.212, 95% CI: -0.174, 0.598). Finally, Column 5 indicates that by limiting our control group to spatially proximate children, our estimated BLL effect of the switch to Flint water remains statistically unchanged (δ = 0.393, 95% CI: 0.149, 0.639).
Table 2. Coefficients estimating the blood lead effect (in μg/dL) of switching the water supply from Detroit to the Flint River.
| Model 1: All Children | Model 2: Excluding Buffer Children in Flint | Model 3: Limiting to Buffer Children in Flint | Model 4: Limiting to Children Within Flint | Model 5: Excluding Children in Outlying Municipalities in Genesee County | |
|---|---|---|---|---|---|
| Flint Buffer | 0.203** | ||||
| (0.098) | |||||
| Flint | 0.244*** | 0.209* | 0.252 | 0.233** | |
| (0.093) | (0.112) | (0.232) | (0.118) | ||
| After Switch | -0.017 | 0.032 | 0.029 | 0.160 | -0.023 |
| (0.086) | (0.085) | (0.086) | (0.184) | (0.124) | |
| Flint × After Switch | 0.445*** | 0.347*** | 0.639*** | 0.212 | 0.394*** |
| (0.100) | (0.114) | (0.125) | (0.197) | (0.125) | |
| Constant | 1.167*** | 1.250*** | 1.260*** | 1.294*** | 1.375*** |
| (0.125) | (0.126) | (0.198) | (0.265) | (0.181) | |
| N | 6,821 | 5,421 | 5,468 | 2,440 | 4,221 |
| N Block | 372 | 315 | 335 | 168 | 245 |
| R-squared | 0.069 | 0.062 | 0.071 | 0.067 | 0.080 |
Notes: Standard errors in parentheses,
p<0.01,
p<0.05,
p<0.1. Models 1 through 5 control for child age, child age squared, method of blood draw (cutaneous=1), percent of households in poverty in the block group of child residence, fixed effects for quarter and year of blood draw, and include a block group random effect. N Block is the number of different census blocks in which children are observed.
Figure 4 plots difference-in-differences coefficients vis-a-vis child BLLs (μg/dL) by the elapsed time since the switch in water supply (and the initiation of our treatment period). By incrementally expanding the treatment period window (with 10 day intervals), we estimate the timing of signal detection where the observed increase in child BLLs in Flint supersedes conventional standards of statistical significance. Contrast this signal timing estimate of 60 days with the first official boil advisory at 130 days.
Figure 4.

Difference-in-differences coefficient vis-a-vis child blood lead (μg/dL) by elapsed time since the start of Phase B (May 25, 2014, t = 0). Coefficients derived from model reported in Table 2, Column 1, involving the incremental expansion of the post-period.
Table 3 reports Odds Ratios (OR) of the likelihood a child presents with EBLL as a result of the switch in water supply from Detroit to Flint River. Column 1 shows that the switch to Flint water increased the risk of a child presenting with a BLL of ≥ 5 μg/dL by a factor of 2.399 (95% CI: 1.354, 4.249). Column 2 indicates that children outside boil advisory areas experienced 91% increase in the probability of presenting with EBLLs as result of the switch to Flint water. By contrast, results in Column 3 show that children residing in high risk areas witnessed 175% increase in the probability of eclipsing the CDCs guidance level of ≥ 5 μg/dL. Column 4 indicates that estimated differences in the risk of EBLL between children residing in boil advisory areas or not are indistinguishable from chance (95% CI: 0.694, 2.734). Finally, limiting our control group area to children at the near periphery of the Flint city boundary increases the estimated EBLL effect of switching to Flint river water to a factor of 3.496 (95% CI: 1.479, 8.263).
Table 3. Odds ratios of child BLL ≥5 μg/dL estimating the effect of switching the water supply from Detroit to the Flint River.
| Model 1: All Children | Model 2: Excluding Buffer Children in Flint | Model 3: Limiting to Buffer Children in Flint | Model 4: Limiting to Children Within Flint | Model 5: Excluding Children in Outlying Municipalities in Genesee County | |
|---|---|---|---|---|---|
| Flint Buffer | 1.467 | ||||
| [0.894, 2.406] | |||||
| Flint | 2.049*** | 1.884*** | 2.504*** | 1.994*** | |
| [1.393, 3.013] | [1.167, 3.042] | [1.571, 3.989] | [1.245, 3.195] | ||
| After Switch | 1.573 | 1.854* | 1.650 | 2.643** | 0.995 |
| [0.817, 3.028] | [0.890, 3.859] | [0.809, 3.365] | [1.173, 5.955] | [0.378, 2.619] | |
| Flint × After Switch | 2.399*** | 1.910* | 2.760*** | 1.377 | 3.496*** |
| [1.354, 4.249] | [0.951, 3.836] | [1.445, 5.272] | [0.694, 2.734] | [1.479, 8.263] | |
| N | 6,821 | 5,421 | 5,468 | 2,440 | 4,221 |
| N Block | 372 | 315 | 335 | 168 | 245 |
| Log | -1,030.82 | -696.94 | -754.71 | -553.83 | -746.80 |
| Likelihood | |||||
| Wald χ2 | 167.21 | 76.52 | 159.78 | 81.36 | 119.56 |
Notes: 95% confidence intervals in braces, and standard errors
p<0.01,
p<0.05,
p<0.1. Models 1 through 5 control for child age, child age squared, method of blood draw (cutaneous=1), percent of households in poverty in the block group of child residence, fixed effects for quarter and year of blood draw, and include a block group random effect. N Block is the number of different census blocks in which children are observed.
3.2. Social Costs of Switching to Flint River Water
As described previously, we conservatively estimate the social costs of switching from Detroit to Flint River water. The social costs are capitulated using multiplicative factors from Eq. (2), reported in Table 3, Column 1, and a standard syllogism in environmental health economics linking BLL to IQ point loss and IQ point loss to future earnings (Gould, 2009; Grosse et al., 2002; Schwartz, 1994). Table 4 summarizes the steps. Columns A and B estimate the number of children with BLLs > 5 μg/dL before and after the switch to Flint River water. The additional number of children eclipsing the CDCs guidance level were derived by multiply the baseline risk of 4.01 per 100 (95% CI: 2.94, 5.09) by a factor of 2.4 (95% CI: 1.35, 4.25), corresponding to difference-in-differences OR reported in Table 3, Column 1.
Table 4. Estimated costs in present discounted value of lifetime earnings from IQ point loss from switching the water supply from Detroit to the Flint River.
| Affected (≥5 μg/dL) Children Before Switch | Additional Affected Children After Switch | Average BLL of Affected Children (μg/dL) | Average IQ Point Loss per μg/dL | IQ Point Loss Before Switch | IQ Point Loss After Switch | IQ Point Loss Attributable to Switch | Loss in Present Discounted Value of Lifetime Earnings ($) from Switch | |
|---|---|---|---|---|---|---|---|---|
| (A) | (B) | (C) | (D) | (E) | (F) | (G) | (H) | |
| Point Estimate | 401 | 561.4 | 7.825 | 0.513 | 1609.70 | 3863.29 | 2253.59 | $65,085,815 |
| Lower Bound | 294 | 102.9 | 7.825 | 0.513 | 1180.18 | 1593.25 | 413.06 | $11,929,694 |
| Upper Bound | 509 | 1654.25 | 7.825 | 0.513 | 2043.24 | 8683.77 | 6640.53 | $191,785,196 |
Notes: The count of affected children by in Column A assumes a population of 10,000 children <6 years of age, and baseline risk of 4.01 per 100 (95% CI: 2.94, 5.09). Affected children in Column B derived from multiplicative factor in Table 2, Column 1 (OR = 2.4, 95% CI: 1.35, 4.25). Column D is the IQ response to BL dosage. Column E = A × C × D; Row 2, Column F = B × C × D; Row 2, Column G = F − E; and Column H = G × $28,881
Columns C and D indicate the average BLL level within BLL category of ≥ 5 μg/dL and the average IQ point loss per μg/dL, respectively. The marginal effect in Column D are from Gould (2009) and Lanphear et al. (2005). Columns E and F estimate population-wide IQ point loss before and after the switch to Flint River water by multiplying the estimated number of affected children (in Columns A or B), the average BLL of children with BLL ≥ 5 μg/dL, and the average IQ point loss per μg/dL. The sum of IQ points lost attributable to the switch in water regime (2,254 IQ points) is reported in Column G. This reflects the difference between Columns F and E. Multiplying the sum of IQ points lost (2,254) by the loss in the present discounted value of lifetime earnings of $28,881 (2014 USD) (Grosse et al., 2002; Nevin et al., 2008; Salkever, 1995; Schwartz, 1994) gives a total social cost of $65.1 million. If not for the efforts of residents, resulting in the switch back to Detroit water, this social cost would be realized for all subsequent cohorts of children in Flint.
It is important note that our social cost figure of $65.1 million is not meant to be a full accounting of social damages. Our estimate is conservative because it considers only a subset of the population (children under six) and only one of the many known cost channels associated with lead exposure in society.4 Our estimate is meant to be contrasted with the estimated savings of $2 million annually by switching to Flint River water.
3.3 C versus B: Boil Water Advisories
Next, we analyze the behaviour of child BLLs after the issuance of boil water advisories. While boil advisories were meant to address the presence of Escherichia coli (E. coli) in the water supply and not lead, official warnings likely induced and/or reinforced water avoidance behaviours by households that had the effect of reducing water-lead exposure. In support of the supposition of water avoidance, using comprehensive retail sales data from Nielsen, Christensen, Keiser, and Lade (2017) find evidence showing a large, statistically significant, and sustained increase in sales of bottled water in Genesee county corresponding with issuance of boil advisories.
Table 5 shows coefficients estimating the blood lead effects (in μg/dL) of water avoidance behaviors in the post-advisory period relative to the post-switch but pre-advisory period. Beginning with Column 1, including all children in both Flint and not Flint (but in Genesee County), we find that BLLs in Flint decreased by 0.229 μg/dL. Compared to the estimated initial rise of 0.445 (reported in Column 1, Table 2) a reduction of 0.229 μg/dL (in Phase C) constitutes about a 50% reduction in water lead exposure (from Phase B) attributable to preventive actions undertaken by authorities and residents. Note the BLL effect of the advisory period in advisory areas in Column 3. We find that BLLs decreased by 0.292 μg/dL (95% CI: -0.555, -0.029) among children in higher risk areas, similarly constituting a 46% reduction over the estimated initial increase for this subgroup (0.639 μg/dL, as reported in Table 2, Column 3). Together with results in Column 4 showing no difference in observed BLL reductions between advisory area and non-advisory area children in Flint, it appears that the post-advisory period involved spatially uniform vigilance in household avoidance of lead-contaminated water.
Table 5.
Coefficients estimating the blood lead effect (in μg/dL) of boil advisories (and subsequent preventive household behaviors) relative to after switch pre-advisory period.
| Model 1: All Children | Model 2: Excluding Buffer Children in Flint | Model 3: Limiting to Buffer Children in Flint | Model 4: Limiting to Children Within Flint | Model 5: Excluding Children in Outlying Municipalities in Genesee County | |
|---|---|---|---|---|---|
| Flint Buffer | 0.444** | ||||
| (0.198) | |||||
| Flint | 0.632*** | 0.421*** | 0.900*** | 0.625*** | |
| (0.104) | (0.106) | (0.117) | (0.130) | ||
| After Advisories | -0.001 | -0.109 | -0.003 | 0.065 | 0.137 |
| (0.121) | (0.116) | (0.123) | (0.282) | (0.189) | |
| Flint × After Advisories | -0.229** | -0.189 | -0.292** | 0.212 | -0.275* |
| (0.110) | (0.119) | (0.134) | (0.197) | (0.155) | |
| Constant | 0.864*** | 0.964*** | 0.892*** | -0.104 | 0.862*** |
| (0.150) | (0.143) | (0.150) | (0.241) | (0.228) | |
| N | 5,104 | 3,977 | 4,095 | 1.020*** | 3,185 |
| N Block | 369 | 310 | 329 | (0.367) | 241 |
| R-squared | 0.094 | 0.109 | 0.109 | 0.063 | 0.083 |
Notes: Standard errors in parentheses,
p<0.01,
p<0.05,
p<0.1. Models 1 through 5 control for child age, child age squared, method of blood draw (cutaneous=1), percent of households in poverty in the block group of child residence, fixed effects for quarter and year of blood draw, and include a block group random effect. N Block is the number of different census blocks in which children are observed.
Table 6 reports OR of the risk of a child presenting with EBLL in the move from Phase B to Phase C of the FWC. Including all children, Column 1 shows that the likelihood of a child in Flint superseding the CDCs guidance level decreased in the post-advisory period by 42.2% (95% CI: -69.3%, 5.5%), though this effect is imprecisely estimated. In fact, the imprecision of the estimated negative effect of the advisory period obtains across all specifications of treatment and control groups throughout Table 6. Together with Table 5, results show that children in Flint experienced statistically significant reductions in mean BLLs as well as reductions in the fraction of children recording EBLLs in the post-advisory period relative to the pre-advisory period (but after the switch to Flint water). Estimated reductions in BLLs in the post-advisory period represent about half the initial rise in the switch from Detroit to Flint water.
Table 6.
Odds ratios of child BLL ≥5 μg/dL estimating the effect of boil advisories (and subsequent preventive household behaviors) relative to after switch pre-advisory period.
| Model 1: All Children | Model 2: Excluding Buffer Children in Flint | Model 3: Limiting to Buffer Children in Flint | Model 4: Limiting to Children Within Flint | Model 5: Excluding Children in Outlying Municipalities in Genesee County | |
|---|---|---|---|---|---|
| Flint Buffer | 1.867 | ||||
| [1.042, 3.347] | |||||
| Flint | 4.717*** | 2.986*** | 6.941*** | 6.944*** | |
| [2.722, 8.175] | [1.525, 5.848] | [3.728, 12.925] | [3.103, 15.541] | ||
| After Advisories | 1.401 | 1.357 | 1.269 | 0.707 | 1.879 |
| [0.628, 3.123] | [0.530, 3.477] | [0.532, 3.030] | [0.243, 2.056] | [0.602, 5.869] | |
| Flint × After Advisories | 0.578* | 0.573 | 0.576 | 1.045 | 0.412* |
| [0.317, 1.055] | [0.271, 1.210] | [0.296, 1.123] | [0.515, 2.121] | [0.166, 1.024] | |
| N | 5,104 | 3,977 | 4,095 | 1,871 | 3,185 |
| N Block | 369 | 310 | 329 | 166 | 241 |
| Log Likelihood | -874.23 | -546.13 | -649.63 | -504.24 | -643.18 |
| Wald χ2 | 133.86 | 68.39 | 124.07 | 59.60 | 97.86 |
Notes: 95% confidence intervals in braces, and standard errors
p<0.01,
p<0.05,
p<0.1. Models 1 through 5 control for child age, child age squared, method of blood draw (cutaneous=1), percent of households in poverty in the block group of child residence, fixed effects for quarter and year of blood draw, and include a block group random effect. N Block is the number of different census blocks in which children are observed.
3.4 D versus A: Switch Back to Detroit Water
Finally, we consider what happened to child BLLs in Flint after the switch back to Detroit water. Table 7 reports coefficients estimating the blood lead effect (in μg/dL) of switching back to Detroit water (Phase D) relative to before switch period (Phase A). Similarly, Table 8 shows OR corresponding to the risk of children presenting with EBLLs. Insofar as water-lead exposure, resulting from the use of highly corrosive Flint River water, was the source of observed increases in child BLLs in Flint, then the return to Detroit water ought to have returned child BLLs and the risk of EBLL to pre-crisis levels. Tables 7 and 8 provide considerable support for this expectation.
Table 7.
Coefficients estimating the blood lead effect (in μg/dL) of switching back to Detroit water relative to before switch period.
| Model 1: All Children | Model 2: Excluding Buffer Children in Flint | Model 3: Limiting to Buffer Children in Flint | Model 4: Limiting to Children Within Flint | Model 5: Excluding Children in Outlying Municipalities in Genesee County | Model 6: All Children, Limiting to the Pre-Sampling Surge Period | |
|---|---|---|---|---|---|---|
| Flint Buffer | 0.212** | |||||
| (0.089) | ||||||
| Flint | 0.247*** | 0.196** | 0.387** | 0.240** | 0.250*** | |
| (0.086) | (0.099) | (0.161) | (0.094) | (0.096) | ||
| After Switch Back | 0.275*** | 0.247*** | 0.273*** | 0.277*** | 0.271*** | -0.081 |
| (0.054) | (0.058) | (0.054) | (0.095) | (0.075) | (0.099) | |
| Flint × After Switch Back | -0.122* | -0.062 | -0.208** | -0.162 | -0.104 | -0.028 |
| (0.067) | (0.081) | (0.084) | (0.109) | (0.080) | (0.124) | |
| Constant | 0.975*** | 1.011*** | 1.088*** | 1.041*** | 0.946*** | 1.250*** |
| (0.092) | (0.099) | (0.129) | (0.140) | (0.118) | (0.127) | |
| N | 12,016 | 8,940 | 8,921 | 5,522 | 8,457 | 6,214 |
| N Block | 372 | 329 | 350 | 198 | 262 | 372 |
| R-squared | 0.069 | 0.061 | 0.073 | 0.070 | 0.079 | 0.049 |
Notes: Standard errors in parentheses,
p<0.01,
p<0.05,
p<0.1. Models 1 through 6 control for child age, child age squared, method of blood draw (cutaneous=1), percent of households in poverty in the block group of child residence, fixed effects for quarter and year of blood draw, and include a block group random effect. N Block is the number of different census blocks in which children are observed.
Table 8. Odds ratios of child BLL ≥5 μg/dL estimating the effect of switching back to Detroit water relative to before switch period.
| Model 1: All Children | Model 2: Excluding Buffer Children in Flint | Model 3: Limiting to Buffer Children in Flint | Model 4: Limiting to Children Within Flint | Model 5: Excluding Children in Outlying Municipalities in Genesee County | Model 6: All Children, Limiting to the Pre-Sampling Surge Period | |
|---|---|---|---|---|---|---|
| Flint Buffer | 1.489* | |||||
| [0.933, 2.376] | ||||||
| Flint | 2.247*** | 2.117*** | 2.563*** | 2.173*** | 2.190*** | |
| [1.557, 3.244] | [1.368, 3.277] | [1.613, 4.074] | [1.382, 3.418] | [1.483, 3.233] | ||
| After Switch Back | 0.740 | 0.687 | 0.738 | 1.004 | 0.868 | 0.671 |
| [0.488, 1.120] | [0.436, 1.084] | [0.478, 1.138] | [0.613, 1.646] | [0.489, 1.539] | [0.300, 1.501] | |
| Flint × After Switch Back | 1.075 | 1.135 | 0.985 | 0.815 | 0.979 | 0.826 |
| [0.673, 1.716] | [0.645, 1.996] | [0.569, 1.705] | [0.462, 1.439] | [0.537, 1.783] | [0.319, 2.138] | |
| N | 12,016 | 8,940 | 8,921 | 5,522 | 8,457 | 6,214 |
| N Block | 372 | 329 | 350 | 198 | 262 | 372 |
| Log Likelihood | -1,455.61 | -975.88 | -1,008.59 | -549.98 | -1,132.88 | -810.16 |
| Wald χ2 | 121.72 | 64.01 | 103.54 | 71.16 | 94.97 | 81.55 |
Notes: 95% confidence intervals in braces, and standard errors
p<0.01,
p<0.05,
p<0.1. Models 1 through 5 control for child age, child age squared, method of blood draw (cutaneous=1), percent of households in poverty in the block group of child residence, fixed effects for quarter and year of blood draw, and include a block group random effect. N Block is the number of different census blocks in which children are observed.
With one exception, across all spatial definitions of treatment and control groups in Tables 7 and 8, we find that average BLLs and the risk of CDC guidance level exceedance in Flint in the post-switch back period are statistically indistinguishable from the before switch period. Our exceptional case involves children residing in the high risk areas of Flint (i.e., boil water advisory areas). Here, in Table 7, Column 3, we find an actual reduction in average BLLs over Phase A of about 0.208 μg/dL (95% CI: -0.374, -0.043). Given engineering reports of permanent damage to pipe segments throughout city (Roy, 2016), our results showing a return to normal should be interpreted with caution. It is likely the case that widespread use of water-lead filtration devices by households in Flint (Fournier and Chambers, 2016) masks underlying exposure risk. As household vigilance in water filtration and avoidance behaviors decline, BLLs may increase in proportion to suspected damages to water infrastructure. We can rule out, however, that the return of BLLs in Flint to pre-crisis levels is an artifact of a surge in blood lead sampling. Column 6 in Tables 7 and 8 shows results from a test that restricts the switch back period to before the observed spike in surveillance efforts, where again we find no differences in average BLLs (δ = -0.028, 95% CI: -0.270, 0.215) or the risk of EBLL (expδ = 0.826, 95% CI: 0.319, 2.138) between the switch back and pre-switch periods.
4. Discussion and Conclusion
By dividing the FWC into four acts corresponding to meaningful breaks in the risk of child water-lead exposure, we pursued three key questions: 1) did the switch from Detroit to Flint water—producing an engineering failure in water quality—cause an increase in average child BLLs and the fraction of children with EBLLs? 2) did boil water advisories (and subsequent water avoidance behaviors of households) decrease average child BLLs and the fraction of children with EBLLs? 3) by returning to Detroit water, did average child BLLs and the fraction of children with EBLLs return to pre-crisis levels?
With respect to question 1, and across various spatial definitions of treatment and control groups, we found that the failure of the water system in Flint caused average BLLs to increase between 0.347 and 0.639 μg/dL, and caused an increase in the likelihood of a child presenting with ≥ 5 μg/dL by a multiplicative factor of 1.910 to 3.496. With estimated factors, we placed the count of additional children in Flint pushed over the CDCs guidance level of ≥ 5 μg/dL at 561. Our estimate of 561 children harmed, is higher than the implied count in Hanna-Attisha et al. (2016). Hanna-Attisha et al. (2016) found that the percentage of sampled children in Flint, Michigan with elevated blood lead levels (EBLLs) increased by 2.5 percentage points following the water source change (2.4% to 4.9%). Assuming 10,000 children under age 6 in Flint (∼10% of the population, July 1, 2015), the implied count of harmed children in Hanna-Attisha et al. (2016) is 250 children. One source of the difference is that we censored the post-switch period to before the issuance of boil water advisories that functioned to reduce BLLs. Inclusion of all observations in the full post-switch period reduces our estimated OR to 1.75 (95% CI: 1.152, 2.676), implying an additional count of 301 children that is closer to the implied count of Hanna-Attisha (2016).
Contrasted with the expected budget savings of $2 million annually by switching to Flint River water, our conservative estimate of only one aspect of the cohort-specific social damages imposed on the children of Flint is an order of magnitude higher ($65.1 million). It is worth emphasizing that our estimate of social costs considers only a subset of the population (children 6 years of age) and one known damage channel of lead poisoning (IQ→lifetime earnings). Our very narrow calculation of social costs is not meant to be a complete inventory of loss imposed on the population of Flint. Our calculation was meant to show that the strictly budget motivated decision by officials to use Flint River water caused health damages far in excess of purported savings, even under conservative accounting. Total estimated health costs imposed on the population of Flint would grow substantially by inclusion of other cost channels like hospitalization and treatment costs, physical and behavioral costs, and damages imposed on other segments of the population.
Going beyond health, the true costs of the FWC are substantially higher when considering infrastructure replacement costs, the rupture of institutional trust, and the added stigma5 imposed on the city. In closing this section of analysis we estimated the elapsed time between the first chance-distinguishable signal in our data and the first public announcement of problems with drinking water quality, a boil water advisory at 50 to 70 days. It is important to note that this boil water advisory was not specifically due to concerns over lead exposure but rather bacterial contamination. If the initially advisory was due to concern over lead, other recommendations would have been appropriate (e.g. use of bottled or filtered water).
With respect to question 2, we find that in the period subsequent to boil water advisories (Phase C), average BLLs in Flint decreased by about 50% from their initial rise (0.22 μg/dL down from 0.445 μg/dL). Likelihoods of children presenting with EBLLs declined similarly, but calculated effects were imprecisely estimated. Our results demonstrate that if officials acted promptly following the first public complaints of discoloration, poor taste and odor problems (May 2014) with advisories that elicited a similar response to the boil water advisories released later, the number of children harmed would have been smaller. If we multiply the 561 children <6 years of age that experienced EBLLs resulting from the switch in water supply (Table 4, Column B) by the deflated odds ratio of 0.578 observed after the boil water advisory (Table 6), we obtain an estimate of 324 children with EBLLs. The difference between these two estimates provides a crude approximation of the number of children (237) that would have been spared if officials had acted immediately. Despite the best efforts of concerned officials, scientists, and residents, water-lead exposure persisted through this period of generalized caution. The water caution induced by advisories attenuated but did not stem the blood lead crisis. This fact reinforces the dictum that public health and safety are not matters to be left to households.
With respect to question 3, we find that average BLLs in Flint returned to pre-FWC levels with the switch back to Detroit water. The same is true of EBLL prevalence. Figure 5 provides a graphical summary of these conclusions, showing predicted BLLs (μg/dL) in Panel A and probabilities of ≥5 μg/dL in Panel B before the switch to Flint River water and after the switch back to Detroit water for children residing in Flint and outside Flint (but inside Genesee County). Perhaps a function of higher vigilance with respect to all sources of lead (like paint and soil), we find some (but inconclusive) evidence that average BLLs in high risk areas in Flint may have fallen below pre-FWC levels. While the water-lead exposure problem appears to have subsided6, the residents of Flint grapple with other water-borne health problems.7
Figure 5.
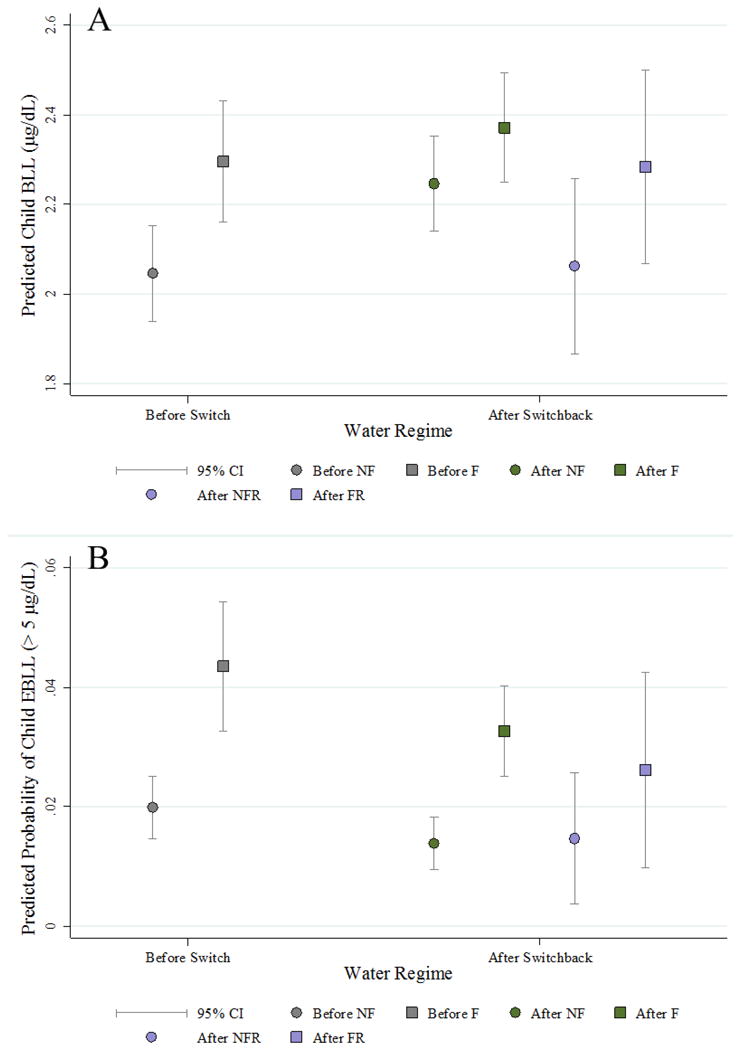
Predicted blood lead levels (μg/dL) and probabilities of ≥5 μg/dL before the switch to Flint River water (A) and after the switch back to Detroit water (B). Predicted values in Panel A from Table 7, Model and from Table 7, Model 6 corresponding to the sample restricted switch back period (before the surge in blood lead testing). Predicted values in Panel B from Table 8, Model 1 and from Table 8, Model 6 corresponding to the sample restricted switch back period (before the surge in blood lead testing). All other covariates are fixed at sample means. F= Flint, NF = Not Flint, FR = Flint, Sample Restricted, NFR = Not Flint, Sample Restricted
The above conclusions are importantly limited by the quality of the surveillance data provided by the Michigan Department of Community Health (MDCH). MDCH data are not collected randomly, focusing instead on at-risk children. If the population of sampled children varied from one phase of the FWC to the next, our estimated effects could be biased. As reported in Table 1, with the exception of Phase D (corresponding to the switch back period), the observed demographic characteristics of sampled children in Flint in terms of age and gender remained remarkably consistent through the crisis. The same is true of the spatial variation in sampling. In terms of the population and housing characteristics of the neighborhoods from which Flint children were sampled, we find low between-phase variation.8 The timing of exogenous shocks to population water-lead exposure risk appear independent of the demographic and spatial sampling protocols of the MDCH surveillance system.
Finally, it is worth considering the FWC in the context of other known contemporary sources of lead exposure risk. Such consideration is not meant to diminish the public health tragedies visited upon the citizens of Flint, but to bring attention to other sources that produce analogous BLL effects in children. Other major sources of child exposure to lead include lead paint (Sayre et al., 1974), contaminated soil (Zahran et al., 2013), and air emissions from piston engine aircraft (Zahran et al., 2017). In various cities of the United States, researchers have observed a striking seasonal behavior to child BLLs (Greene and Morris, 2006; Laidlaw et al., 2005; Melaku et al., 2008; Paode et al., 1998; US EPA, 1995; Zahran et al., 2013). We find the same seasonal pattern to BLLs in Flint (and in Genesee County) children throughout our study periods. Figure 6 summarizes an ancillary analysis of the BLLs of over 1 million children residing in 83 counties in Michigan from 1999 to 2012.
Figure 6.

Predicted child blood lead levels (μg/dL) by month, Michigan-wide, 1999-2012. Predicted values derived from a LS model of 1,180,928 children residing in one of eighty-three counties in Michigan from 1999 to 2012. In addition to fixed effects for month, model covariates in included child age, child sex, as well as county and year fixed effects. Confidence intervals by delta-method standard errors.
Figure 6 shows that conditional mean BLLs in September are 0.457 μg/dL (or 16.2%) higher than in December. This difference between peak and trough months in BLLs is on par with what we observe in the FWC. In effect, a FWC (in terms of BLLs) occurs every year in an untold number of American cities. Candidate mechanisms behind this seasonal flux include home renovations and demolitions involving the release of lead-based paint on interior and exterior walls (Rabito et al., 2007), the atmospheric resuspension of contaminated soils (Zahran et al., 2013), and the deposition of leaded gasoline from piston-engine aircraft (Zahran et al., In Press). Given that both the EPA and the CDC have concluded that there is no known safe level of lead exposure (CDC, 2012a; CDC, 2012b; DHHS, 2012), much prevention science and health policy research remains on all contemporary sources of child lead exposure.
Highlights.
Change in Flint';s water source resulted in BLLs of 561 children exceeding 5 μg/dL
Cohort social costs estimated to be greater than $65.1 million
Peak BLLs decreased ∼50% following advisories and water avoidance behaviors
Child BLLs returned to pre-FWC levels following return to original source water
Increase in Flint child BLLs similar in size to seasonal increases observed elsewhere
Acknowledgments
We thank the Michigan Department of Community Health, Childhood Lead Poisoning Prevention Project for providing the blood lead data used in this study. Research reported in this publication was supported by National Institute of Environmental Health Sciences of the National Institutes of Health (NIH) under award number R21 ES027199- 01. The content is solely the responsibility of the authors and does not necessarily represent the official views of the NIH.
Footnotes
Flint received water from DWSD since 1967. Over the nearly 50 years of service, water entering the distribution system was managed appropriately resulting a layer coating the inside of pipes (i.e. passivation layer), creating a barrier between lead bearing metals and drinking water. When the City of Flint switched its water supply, the new corrosive water rapidly dissolved this layer allowing lead present in pipes to dissolve into drinking water. Because some of these reactions are kinetically limited and time-dependent changes in water chemistry, the extent of time water was in contact with lead bearing metals created variations in exposure. It can be assumed that the greater the amount of time water spent in the distribution system (i.e. water age), the greater the amount of dissolution of the passivation layer. These conditions responsible for the dissolution of the passivation layer are described by Masten et al. (2016). Following the switch back to Detroit water, now supplied by the GLWA, chemical conditions of the new water supply, mainly the presence of orthophosphate, resulted in precipitation and the rebuilding of the passivation layer.
Testing for statistical independence of the block-group specific error component (uj) with regressors, a Hausman test of fixed versus random effects supports the use of random effects (χ2 = 4.82; Pr > χ2 = 0.964)
In both Flint and outside Flint (but in Genesee County) we observe a remarkable increase in the count of children sampled in the 1st of quarter of 2016. In Flint, the year-over-year count of children increased near ten-fold, and tripled outside Flint (but in Genesee County). The increased vigilance in BL sampling may have produced unobservable compositional changes in children that confound period comparisons. By limiting the switch-back period to children observed before the surge in sampling, we mitigate this compositional problem.
Lead exposure can cause irreversible health problems, including learning disabilities, growth stunting, seizures, and lasting damage to various body systems. Kemper et al (1998) provide comprehensive health care cost estimates from medical interventions necessary to treat both low and high level exposure to lead. Others have estimated the total direct costs of lead-linked crime, including victim costs, criminal justice processing and incarceration, as well as lost earnings to victims and perpetrators of crime (Gould 2009).
While we show that water-lead exposure risk (as reflected in the BLLs of Flint children) has retreated to pre-FWC levels, in analyses of Zillow housing market data, we find that Zip Codes in Flint witnessed a 24% reduction in the percent of homes sold, a 13% reduction in inventories (or homes listed for sale), and a 14% reduction in the average price of transacted homes (relative to control Zip Codes in Genesee County) after Mayor Karen Weaver declared a state of emergency in the City of Flint on the 15th of November. The FWC has had a measurable effect on the wealth of residents.
While BLLs in Flint have returned to pre-FWC levels, it is questionable whether the switch back to Detroit water entirely governs the outcome. This positive outcome may be inflated by the widespread use of point-of-use filtration systems by households in Flint, which remove lead, masking suspected permanent damage/corrosion to pipe segments throughout the water distribution system.
According to Michigan Disease Surveillance System data, Genesee County witnessed measurable spikes in Legionellosis, an acute lung infection caused by Legionella, in both 2014 and 2015. A total of Legionella pneumophila is transmitted in aerosols of contaminated water. A candidate hypothesis for the Legionellosis outbreak involves interactions between corrosion products and insufficient residual chlorine levels in the Flint municipal water system. Chlorine restricts the growth of pathogens like Legionella. Extensive corrosion reported while treated Flint River water was being distributed increased the presence of chlorine-demanding iron, together with the additional organic matter present in treated Flint River water, likely resulting in widespread proliferation of L. pneumophila throughout the distribution system (Schwake et al., 2016).
Observed neighborhood (census tract) level characteristics of percent African American (A=48.9, B=48.4, C=46.5), average housing age (A= 1943.2, B=1943.3, C=1943.2), vacancy rate (A= 13.9, B= 12.3, C=13.2), percent poverty (A=25.9, B=24.9, C=24.3) and percent unemployed (A= 7.8, B=7.7; C=7.3) from which children were sampled behaved consistently through the FWC.
The authors declare they have no actual or potential competing financial interests.
Publisher's Disclaimer: This is a PDF file of an unedited manuscript that has been accepted for publication. As a service to our customers we are providing this early version of the manuscript. The manuscript will undergo copyediting, typesetting, and review of the resulting proof before it is published in its final citable form. Please note that during the production process errors may be discovered which could affect the content, and all legal disclaimers that apply to the journal pertain.
References
- Centers for Disease Control and Prevention (CDC) Low Level Lead Exposure Harms Children: A Renewed Call of Primary Prevention. Vol. 2013. Centers for Disease Control and Prevention; 2012a. CDC Response to Advisory Committee on Childhood Lead Poisoning Prevention Recommendations. [Google Scholar]
- CDC. Report of the Advisory Committee on Childhood Lead Poisoning and Prevention of the Centers for Disease Control and Prevention. Vol. 2014. Centers for Disease Control and Prevention; 2012b. Low Level Lead Exposure Harms Children: A Renewed Call for Primary Prevention. [Google Scholar]
- Christensen P, Keiser DA, Lade GE. Mimeo. Iowa State University; 2017. The Effects of Information Provision on Housing Markets and Avoidance Behavior: Evidence from the Flint, MI Drinking Water Crisis. [Google Scholar]
- Davis MM, et al. Flint Water Advisory Task Force - Final Report. Office of Governor Rick Snyder. 2016:115. [Google Scholar]
- U.S. Department of Health and Human Services (DHHS) Monograph on the Health Effects of Low-level Lead. U.S. Department of Health and Human Services; 2012. [Google Scholar]
- Edwards M. Our sampling of 252 homes demonstrates a high lead in water risk: Flint should be failing to meet the EPA Lead and Copper Rule. FlintWaterStudy; Blacksburg, VA: Sep 8, 2015. [accessed 16 April 2017]. http://flintwaterstudy.org/2015/09/our-sampling-of-252-homes-demonstrates-a-high-lead-in-water-risk-flint-should-be-failing-to-meet-the-epa-lead-and-copper-rule/ [Google Scholar]
- Emery A. EPA concerned about ‘urgent’ situation with chlorine levels in Flint water. M Live; Flint, MI: 2016. [Google Scholar]
- Felton R. Flint residents raise concerns over discolored water. Detroit Metro Times. 2014 [Google Scholar]
- Fonger R. State says Flint River water meets all standards but more than twice the hardness of lake water. M Live. 2014 [Google Scholar]
- Fonger R. Flint DPW director says water use has spiked after hundreds of water main breaks. M Live. 2015 [Google Scholar]
- Fournier H, Chambers J. Witness: Water delivery in Flint would cost $9M a month. Detroit News. 2016 [Google Scholar]
- Gould E. Childhood Lead Poisoning: Conservative Estimates of the Social and Economic Benefits of Lead Hazard Control. Environmental Health Perspectives. 2009;117:1162–1167. doi: 10.1289/ehp.0800408. [DOI] [PMC free article] [PubMed] [Google Scholar]
- Greene NA, Morris VR. Assessment of public health risks associated with atmospheric exposure to PM2.5 in Washington, DC, USA. International journal of environmental research and public health. 2006;3:86–97. doi: 10.3390/ijerph2006030010. [DOI] [PMC free article] [PubMed] [Google Scholar]
- Grosse SD, et al. Economic gains resulting from the reduction in children's exposure to lead in the United States. Environmental Health Perspectives. 2002;110:563–569. doi: 10.1289/ehp.02110563. [DOI] [PMC free article] [PubMed] [Google Scholar]
- Hanna-Attisha M, et al. Elevated blood lead levels in children associated with the Flint drinking water crisis: a spatial analysis of risk and public health response. American journal of public health. 2016;106:283–290. doi: 10.2105/AJPH.2015.303003. [DOI] [PMC free article] [PubMed] [Google Scholar]
- Hu H, et al. Bone lead as a biological marker in epidemiologic studies of chronic toxicity: Conceptual paradigms. Environmental Health Perspectives. 1998;106:1–8. doi: 10.1289/ehp.981061. [DOI] [PMC free article] [PubMed] [Google Scholar]
- Laidlaw MA, et al. Children&';s blood lead seasonality in Flint, michigan (USA), and soil-Sourced lead hazard risks. International journal of environmental research and public health. 2016;13:358. doi: 10.3390/ijerph13040358. [DOI] [PMC free article] [PubMed] [Google Scholar]
- Laidlaw MA, et al. Seasonality and children's blood lead levels: developing a predictive model using climatic variables and blood lead data from Indianapolis, Indiana, Syracuse, New York, and New Orleans, Louisiana (USA) Environmental Health Perspectives. 2005:793–800. doi: 10.1289/ehp.7759. [DOI] [PMC free article] [PubMed] [Google Scholar]
- Lanphear BP, et al. Low-level environmental lead exposure and children's intellectual function: An international pooled analysis. Environmental Health Perspectives. 2005;113:894–899. doi: 10.1289/ehp.7688. [DOI] [PMC free article] [PubMed] [Google Scholar]
- Lidsky TI, Schneider JS. Lead neurotoxicity in children: basic mechanisms and clinical correlates. Brain. 2003;126:5–19. doi: 10.1093/brain/awg014. [DOI] [PubMed] [Google Scholar]
- Lynch J. Officials: Flint water rates could double in five years. The Detroit News. 2016 [Google Scholar]
- Masten SJ, et al. Flint Water Crisis: What Happened and Why? Journal-American Water Works Association. 2016;108:22–34. doi: 10.5942/jawwa.2016.108.0195. [DOI] [PMC free article] [PubMed] [Google Scholar]
- Melaku S, et al. Seasonal variation of heavy metals in ambient air and precipitation at a single site in Washington, DC. Environmental Pollution. 2008;155:88–98. doi: 10.1016/j.envpol.2007.10.038. [DOI] [PubMed] [Google Scholar]
- Nevin R, et al. Monetary benefits of preventing childhood lead poisoning with lead-safe window replacement. Environmental Research. 2008;106:410–419. doi: 10.1016/j.envres.2007.09.003. [DOI] [PubMed] [Google Scholar]
- Paode RD, et al. Dry deposition fluxes and mass size distributions of Pb, Cu, and Zn measured in Southern Lake Michigan during AEOLOS. Environmental Science & Technology. 1998;32:1629–1635. [Google Scholar]
- Rabinowitz MB. Toxicokinetics of Bone Lead. Environmental Health Perspectives. 1991;91:33–37. doi: 10.1289/ehp.919133. [DOI] [PMC free article] [PubMed] [Google Scholar]
- Rabito F, et al. The association between demolition activity and children's blood lead levels. Environmental research. 2007;103:345–351. doi: 10.1016/j.envres.2006.09.011. [DOI] [PubMed] [Google Scholar]
- Roy S. Moving Forward After Flint. American Scientist. 2016;104:137–139. [Google Scholar]
- Salkever DS. Updated estimates of earnings benefits from reduced exposure of children to environmental lead. Environmental Research. 1995;70:1–6. doi: 10.1006/enrs.1995.1038. [DOI] [PubMed] [Google Scholar]
- Sayre JW, et al. House and hand dust as a potential source of childhood lead exposure. American Journal of Diseases of Children. 1974;127:167–170. doi: 10.1001/archpedi.1974.02110210017002. [DOI] [PubMed] [Google Scholar]
- Schwake DO, et al. Legionella DNA Markers in Tap Water Coincident with a Spike in Legionnaires' Disease in Flint, MI. Environmental Science & Technology Letters. 2016;3:311–315. [Google Scholar]
- Schwartz J. Societal Benefits of Reducing Lead-exposure. Environmental Research. 1994;66:105–124. doi: 10.1006/enrs.1994.1048. [DOI] [PubMed] [Google Scholar]
- US Environmental Protection Agency (EPA) Seasonal Rhythms of BLL Levels: Boston, 1979-1983: Final Report. US Environmental Protection Agency; Washington, DC: 1995. EPA 747-R-94-003. [Google Scholar]
- Veolia North America. Water Quality Report. Flint, MI: Veolia North Ameria; 2015. [Google Scholar]
- Zahran S, et al. The Effect of Leaded Aviation Gasoline on Blood Lead in Children. Journal of the Association of Environmental and Resource Economists. 2017;4:575–610. [Google Scholar]
- Zahran S, et al. The Effect of Leaded Aviation Gasoline on Blood Lead in Children. Journal of the Association of Environmental and Resource Economists In Press. [Google Scholar]
- Zahran S, et al. Linking source and effect: Resuspended soil lead, air lead, and children's blood lead levels in Detroit, Michigan. Environmental science & technology. 2013;47:2839–2845. doi: 10.1021/es303854c. [DOI] [PubMed] [Google Scholar]
- Zahran S, et al. Nonlinear associations between blood lead in children, age of child, and quantity of soil lead in metropolitan New Orleans. Science of the Total Environment. 2011;409:1211–1218. doi: 10.1016/j.scitotenv.2010.11.036. [DOI] [PubMed] [Google Scholar]