Abstract
Hybridoma screening is a critical step for antibody discovery, which necessitates prompt identification of potential clones from hundreds to thousands of hybridoma cultures against the desired immunogen. Technical issues associated with ELISA- and flow cytometry-based screening limit accuracy and diminish high-throughput capability, increasing time and cost. Conventional ELISA screening with coated antigen is also impractical for difficult-to-express hydrophobic membrane antigens or multi-chain protein complexes. Here, we demonstrate novel high-throughput screening methodology employing the Celigo Image Cytometer, which avoids nonspecific signals by contrasting antibody binding signals directly on living cells, with and without recombinant antigen expression.
The image cytometry-based high-throughput screening method was optimized by detecting the binding of hybridoma supernatants to the recombinant antigen CD39 expressed on Chinese hamster ovary (CHO) cells. Next, the sensitivity of the image cytometer was demonstrated by serial dilution of purified CD39 antibody. Celigo was used to measure antibody affinities of commercial and in-house antibodies to membrane-bound CD39. This cell-based screening procedure can be completely accomplished within one day, significantly improving throughput and efficiency of hybridoma screening. Furthermore, measuring direct antibody binding to living cells eliminated both false positive and false negative hits. The image cytometry method was highly sensitive and versatile, and could detect positive antibody in supernatants at concentrations as low as ∼5 ng/mL, with concurrent Kd binding affinity coefficient determination. We propose that this screening method will greatly facilitate antibody discovery and screening technologies.
Keywords: Hybridoma screening, antibody discovery, high-throughput, image cytometry, Celigo
Introduction
Monoclonal antibodies (Mab) were first generated using the hybridoma technology over 4 decades ago [1]. Mabs have been extensively used in many fields, such as clinical immunodiagnosis [2], food analysis, and environmental monitoring [3]. These reagents are not only useful tools for scientists to study an analyte of interest, but can also be powerful therapeutic agents for cancer [4], bacterial [5], or viral diseases [6]. For example, antibody-based cancer immunotherapy has recently demonstrated initial success, albeit full embodiment of Mabs as a viable first-line cancer regimen requires much improvement in antibody qualities [7]. This can be achieved, at least in part, by performing high-throughput antibody discovery screening. For Mab discovery, the classic strategy is to generate hybridoma by fusing myeloma cells with spleen cells from immunized animals, and then screen for potential antigen-specific hybridoma clones. Even for antibodies obtained through display technologies (e.g., phage, yeast or mammalian cell display), a high-throughput screening method is the key for success. The most frequently used screening method is the enzyme-linked immunosorbent assay (ELISA). ELISA works well for aqueous antigens (e.g., cytokines, toxins, or simple soluble extracellular domains of cell surface receptors) that can be coated onto ELISA plates, but it has limitations in the following scenarios: 1) The target antigen is difficult to be recombinantly expressed due to membrane-tethered tertiary structures or hydrophobic segments; 2) The target epitope is within multi-chain protein complex or derived from cell-specific post-translational modifications; and 3) The target epitope is in the membrane-proximal region required for antibody-dependent cell-mediated cytotoxicity (ADCC), which may not be preserved when the protein is liberated from cell surface. In all these cases, the target authenticity issue posts a true challenge in screening for Mabs with desired bioactivity. Using brutal force to express target proteins in bacteria or baculovirus system for ELISA coating is often the source for false positive or false negative results obtained with conventional ELISA, when compared with cell-based immunoassay or radioimmunoassay [8, 9].
The other commonly used screening method is fluorescence-activated cell sorting (FACS). The major drawback of this method is the throughput, where standard flow cytometry is unable to handle vast numbers of samples, i.e., which usually requires at least 1 min to acquire enough cells for analysis for each sample and additional washing step between samples. Although flow screening with 96-well format is achievable by certain types of cytometry machines (e.g., Guava), results are also plagued by potential non-specificity and artifacts, as its discerning power is much less than image-based methods. Therefore, there is an urgent need for a novel hybridoma-screening strategy that can meet high-throughput and target authenticity requirements.
Previously, we and others have developed high-throughput cell-based assays using Celigo Image Cytometer [10-18]. The ability to directly image and analyze live cells bound with antibodies allows researchers to characterize antibodies binding to cell surface antigens, potentially overcoming the limitations associated with the current screening methods. Herein, we established a protocol using the Celigo Image Cytometer to image and analyze a standard 96-well microplate with one bright-field and two fluorescence channels in approximately 9 min/plate, much faster than ELISA and standard flow cytometry.
In this proof-of-concept study, we screened Mab clones against mouse CD39 (ectonucleoside triphosphate diphosphohydrolase-1, ENTPD1), which is expressed on endothelial cells, B cells and is also a surface biomarker for regulatory T cells (Treg) [19]. We developed and optimized a novel high-throughput cell-based hybridoma screening method using Celigo Image Cytometry and CD39-expressing Chinese hamster ovary (CHO) cells, and validated the results by standard flow cytometry. Most importantly, Celigo Image Cytometry was shown to be highly sensitive (detection limit at 5 ng/mL of antibody in supernatant), and is able to measure the Kd antibody binding affinity. Our newly established hybridoma-screening method can significantly improve the throughput and efficiency over the current methods, and will be a promising platform for antibody discovery research in cancer immunotherapy.
Materials and Methods
Hybridoma culture
All hybridoma cells were grown in high-glucose Dulbecco's Modified Eagle Medium (DMEM, Sigma-Aldrich, St. Louis, MO) supplemented with 10% fetal bovine serum (FBS, Gibco, Waltham, MA), 100 units per mL penicillin/streptomycin (ThermoFisher Scientific, Waltham, MA), and 2 mM glutamine (Gibco). Initially, hybridoma cells were maintained in 96-well plates, and when a positive antibody sample was identified, cells in the positive well were expanded in 24-well plates.
Preparation of CD39-expressing CHO cells
CHO cells expressing mouse CD39 were generated by transfecting “Toggle-In” CHO cells (Antagen Pharmaceuticals, Inc., Boston, MA) with full-length mouse CD39 cloned in pTOG3 vector (Antagen), and selected in Hygromycin B (InVivogen, 1 mg/mL) for one week. The pool was confirmed to be over 80% positive by staining with anti-CD39 Mab 5F2, a clone previously established in the lab. A pure CHO clone #10 was selected after subcloning and used in the subsequent assays. CD39-expressing CHO cells were cultured in DMEM supplemented with 5% FBS, 100 units per mL penicillin/streptomycin, and 2 mM glutamine.
Cell-based hybridoma screening assay development
An initial CHO cell-based hybridoma screening experiment was performed to determine the optimal assay protocol. Specifically, CD39-expressing CHO cells were seeded in seven BD Falcon™ 96-well microplates at 8000 cells/well (100 μL) for every well and incubated overnight. Cells were then fixed with 100 μL of 4% paraformaldehyde (PFA) for 20 min. The plates were washed twice with 200 μL of phosphate-buffered saline (PBS) per well with PBS completely removed at the end, and this wash protocol was repeated throughout each experiment. Next, 672 unique hybridoma supernatant samples containing primary antibodies (60 μL) were pipetted into each well, incubated overnight at 4°C, and washed twice. Subsequently, the secondary Donkey anti-mouse IgG (H+L) antibodies labeled with AF488 (Jackson ImmunoResearch, West Grove, PA) at 100 μL (2.5 μg/mL) were pipetted into each well, incubated for 60 min at room temperature, and washed twice. Finally, cells were stained with 100 μL of 2 μg/mL of Hoechst for 30 min, and then washed once prior to Celigo image cytometric analysis.
Cell-based hybridoma screening with CFSE-labeled negative cells as control
CD39-expressing CHO cells were mixed 1:1 with CFSE-labeled wild type CHO cells and seeded in 96-well microplates (Greiner) at 8000 cells/well in 100 μL of medium and cultured overnight. After incubation, 50 μL of medium was replaced with 50 μL of original (six 96-well plates, 576 samples) or serially diluted (×2, 12 times, 12 positive samples) hybridoma supernatant samples in each well. After incubation for 60 min at 37°C and two washes with PBS, cells were fixed with 4% PFA for 20 min and washed twice. Subsequently, 100 μL of secondary Donkey anti-mouse IgG (H+L) antibodies (2.5 μg/mL) labeled with AF594 (Jackson ImmunoResearch) were pipetted into each well, incubated for 60 min at room temperature, and washed twice. Finally, cells were stained with 100 μL of 2 μg/mL of Hoechst for 30 min, and then washed once prior to Celigo image cytometric analysis.
Antibody binding affinity measurement using Celigo image cytometry
CD39-expressing CHO cells were seeded into two Greiner 96-well microplates at 8000 cells/well (100 μL) for every well and incubated overnight. After incubation, the in-house purified antibody (anti-mouse CD39 IgG2c) was added to wells A1 – A3 and a negative control IgG (Z-mAb™ IgG2c, AB Biosciences, Allston, MA) was added to wells A7 – A9 at 100 μL for a final volume of 200 μL, gently mixed and serially diluted (n = 3). The plate map in Supplementary Table 1a showed the different concentrations of both antibodies after dilution on Plate 1. Similar procedure was conducted on Plate 2 for the commercial antibody (Supplementary Table 1b). The purified antibody and the negative control IgG were two-fold serially diluted from 500 μg/mL to 31 ng/mL, whereas the commercial antibody labeled with PE (5F2, eBioscience, San Diego, CA) was two-fold serially diluted from 40 μg/mL to 5 pg/mL. Both plates were then incubated for 60 min at 37°C, and washed twice. Next, cells were fixed with 4% PFA for 20 min and washed twice.
For Plate 1, the secondary Donkey anti-mouse IgG (H+L) antibody labeled with AF594 at 100 μL (2.5 μg/mL) was pipetted into each well, incubated for 60 min at room temperature, and washed twice. As the commercial antibody in Plate 2 was already labeled with PE, it was not necessary to add the secondary antibodies. Finally, cells were stained with 100 μL of 2 μg/mL of Hoechst for 30 min, and then washed once prior to Celigo image cytometric analysis.
Flow cytometry and analysis
CHO cells were collected by EDTA-trypsin digestion, washed with PBS, incubated with hybridoma culture supernatants at 4°C for 30 min. Cells were then washed with sorting buffer (PBS supplemented with 1% FBS) and stained with the secondary goat anti-mouse IgG (H+L) antibodies labeled with AF594 (Jackson ImmunoResearch) for 30 min at 4°C. Fluorescently labeled cells were washed and analyzed using the FACSCalibur for flow cytometry-based analysis.
Celigo Image Cytometer instrumentation, data acquisition, and analysis
Previously, the same Celigo Image Cytometer instrument has been used in numerous high-throughput cell-based assays [14, 15, 20]. Briefly, Celigo utilizes a transmission and epifluorescence optical setup for one bright-field (BF) and four fluorescence (FL) imaging channels (Blue, Green, Red, and Far Red) with high power LED to perform plate-based image cytometric analysis. Each FL imaging channel uses a specific fluorescence filter set for the corresponding colors: Blue (EX: 377/50 nm, EM: 470/22 nm), Green (EX: 483/32 nm, EM: 536/40 nm), Red (EX: 531/40 nm, EM: 629/53 nm), and Far Red (EX: 628/40 nm, EM: 688/31 nm). The proprietary imaging optics can rapidly capture highly uniform images of entire 96 wells on a standard microplate in less than 4 min in bright field. Celigo can perform auto-focusing in the well based on the contrast of the images or the thickness of the bottom surfaces.
The Celigo software allows for the selection of different applications to analyze antibody binding. The “Target 1 + Mask” and “Target 1 + 2 + Mask” applications are used to count the number of cells stained with Hoechst in the Mask channel and those with fluorescence labels Alexa Fluor 488 (AF488), Alexa Fluor 594 (AF594), and R-phycoerythrin (PE) in the FL channels. The obtained fluorescence intensity results were exported to Excel and FCS Express 6 (De Novo Software, Glendale, CA) for further analysis of antibody binding to CD39-expressing CHO cells.
To perform Celigo image cytometry, sample plates with cells stained and fixed were loaded into the instrument, using preset SCAN and ANALYZE settings. For cells without CFSE labeling, Celigo was set up to acquire images in the Target 1 (Green – AF488) and Mask (Blue – Hoechst) fluorescence channels, and the exposure times were 550000 and 500000 μs, respectively. For cells labeled with CFSE, Celigo was set up to acquire images in the Target 1 (Red – AF594), Target 2 (Green – CFSE), and Mask (Blue – Hoechst) fluorescence channels, and the exposure times were 300000, 350000, and 500000 μs, respectively. To detect weak fluorescence signals with highly diluted staining antibodies for binding affinity assessment, Celigo was set up to acquire images in the Target 1 (Red – AF594 or PE) and Mask (Blue – Hoechst) fluorescence channels, and the exposure times were 400000 (AF594), 800000 (PE), and 500000 μs, respectively.
After setting the fluorescence channels and exposure times, hardware-based autofocus was selected to focus cells in the Hoechst channel, where focus offsets were also set up for the Green (+0.025) and Red (-0.010) channels. The sample wells were then selected in the software for image acquisition.
After image acquisition, the preset ANALYZE parameters were used to first identify the Hoechst-stained cells as Mask. The Mask was then applied to the Green and Red fluorescence channels to measure the mean fluorescence intensities for each sample, which were used to determine the level of antibody binding to cells. For cells without CFSE labeling, the AF488 mean fluorescence intensity data were exported into Excel for analysis. The captured fluorescent images of each sample was visually examined and compared to the mean fluorescence intensity values. We noted that the images having a value less than “3” show no binding with low background. As such we empirically use the arbitrary value of 3 as a cut-off point to distinguish between hits and non-binders, in order to give some guidance to Celigo users. That is, antibodies with values greater than 3 R.U. were considered as hits for the screen. The fluorescence data were also plotted in a histogram using FCS Express to show the changes in fluorescence intensities based on the amount of antibody binding (Supplementary Figure 1a). For cells labeled with CFSE, the AF594 and CFSE mean fluorescence intensity data were exported into FCS Express and graphed in a scatter plot of CFSE in respect to AF594 (Supplementary Figure 1b). A gate was created to measure only the CFSE negative CHO cell population. The mean fluorescence intensities were then batch analyzed and exported into Excel to determine the level of antibody binding. In addition, the mean fluorescence intensities in the antibody dilution series experiment were plotted in respect to the dilution factors. To detect weak fluorescence signals in the captured fluorescent images (Supplementary Figure 1c) with highly diluted staining antibodies for binding affinity assessment, the AF594 mean fluorescence intensity data were exported into Excel and plotted in Graphpad Prism to determine the Kd antibody affinity coefficient.
Results and Discussion
We initially stained CD39-expressing CHO cells after PFA fixation with hybridoma supernatants and further detected with AF488-labeled secondary antibody. Out of the total 672 supernatant samples screened, 65 had AF488 mean fluorescence intensity values greater than 3 and were empirically identified as positive from the screening (Supplementary Figure 2; and more details can be found in Materials and Methods). However, flow cytometry failed to confirm any positivity, as shown in Supplementary Figure 3, where the target sample did not induce an intensity shift. Therefore, such false positive signals could be due to non-specific staining on cells that have been previously fixed [21].
In order to avoid the non-specificity problem, in subsequent experiments we performed PFA fixation only after staining live cells with the primary antibody. Moreover, a 1:1 co-culture of unlabeled CD39-expressing CHO cells with CFSE-labeled wild type CHO cells were conducted, where the latter cells served as internal negative controls to distinguish nonspecific antibody binding (Supplementary Figure 1b). When performing the image cytometric analysis, a gate on CFSE-negative cells was created and all signals were contrasted with those on CFSE-positive cells in the same wells. Such improvement essentially reduced 50% of plates, reagents, and time required for unequivocal positive staining. The use of AF594-labeled secondary antibody also improved the signal-to-background ratio.
Using this optimized protocol, we identified 16 samples out of six plates of hybridoma supernatants (576 samples) containing various titers of anti-CD39 antibody (P1: B2, C1; P2: E5, H12; P3: A7; P4: A2, B5, C3, C5, D3, D12, H12; P5: C8; P6: B5, B6, C6), as shown in Figure 1. Examples of fluorescence images of AF594-stained CHO cells are shown in Figure 2. Fluorescence intensity results of high, medium, low, and no antibody binding for image and flow cytometry are also shown in Figure 2, which confirmed correlation to flow cytometry results (Supplementary Figure 4). Of note, one of the measured mean intensity value was approximately 1.55 R.U., which was slightly higher than other non-binding antibodies, but remained under the cutoff of 3 R.U (Figure 1). Further investigation into the captured fluorescent images indicated that this sample showed no binding but a slightly higher background. Thus we considered it as a “non binder”.
Figure 1.
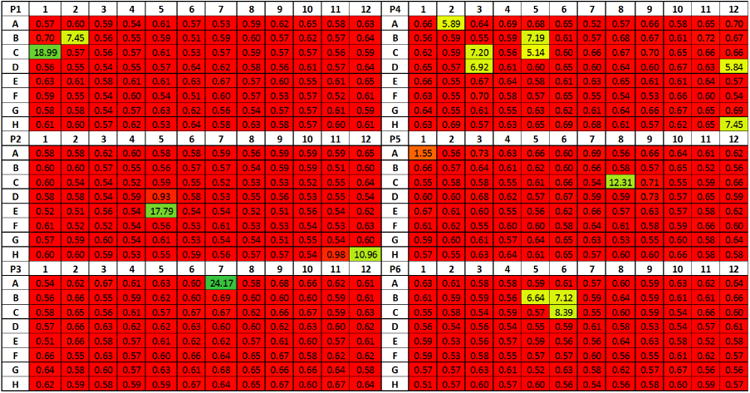
Optimized hybridoma screening results for “Validation of optimized CHO cell-based hybridoma screening assay protocol”. A total of 16 positive hybridoma supernatants were identified as positive hits from the screening experiment. The values presented represent the binding signals, where higher values indicate higher binding (yellow – green).
Figure 2.
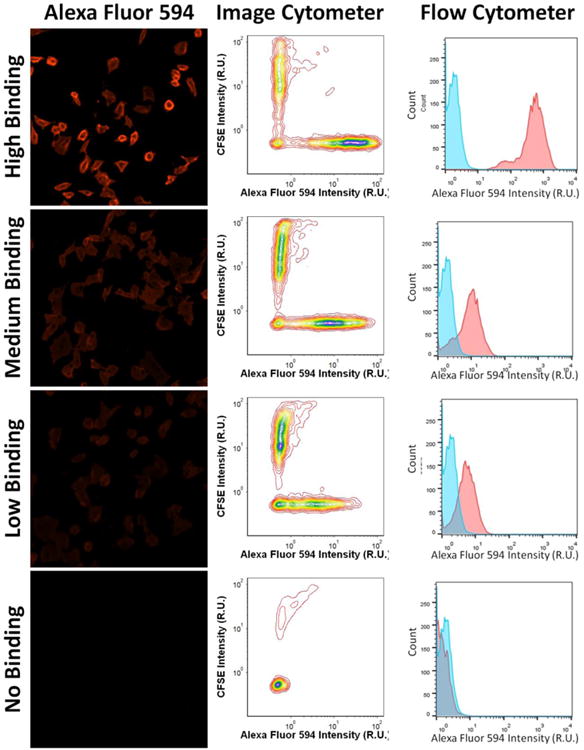
Example fluorescence images and intensity histograms of AF594-CHO at high, medium, low and no binding signals for image and flow cytometers. The optimized binding results validated that all the positive hits from image cytometry were also positive hits on flow cytometry. In addition, wild type CHO cells stained with CFSE did not show AF594 signals, which is indicative of no nonspecific binding.
Of course, we still could not completely exclude the possibility that these 16 hybridoma clones are not CD39 specific, even by incorporating internal CFSE-labeled parental CHO cells as negative control, which showed no signal (Supplementary Figure 1b). As in some rare cases, the introduction of CD39 (and any other exogenous genes) may induce surface co-expression of downstream molecules, which could be picked up by monoclonal antibodies. Even though, our data is sufficient to demonstrate that this image cytometry-based high-throughput hybridoma screening method has relatively high accuracy and is able to significantly reduce the time and materials required for a screening assay.
Because hybridoma supernatants may contain multiple clones with varying titers, we decided to determine the sensitivity of image cytometry-based screening method. 256-fold dilution of the regular hybridoma supernatants can still be detected with our Celigo method. The fluorescence images and intensity scatter plots for different supernatant dilutions are shown in Figure 3. Dilution-dependent intensity changes were clearly observed in the images as well as in the intensity plots. Moreover, dilution-dependent binding results are shown in Figure 4, where Ab1 and Ab2 showed low binding when compared to the other 10 primary antibodies. We also noted that fluorescence intensities seemed to decrease when dilution factors were less than 10, which could be due to signal saturation causing the background to increase. The results showed that the Celigo Image Cytometer can be highly sensitive to detect low antibody binding signals.
Figure 3.
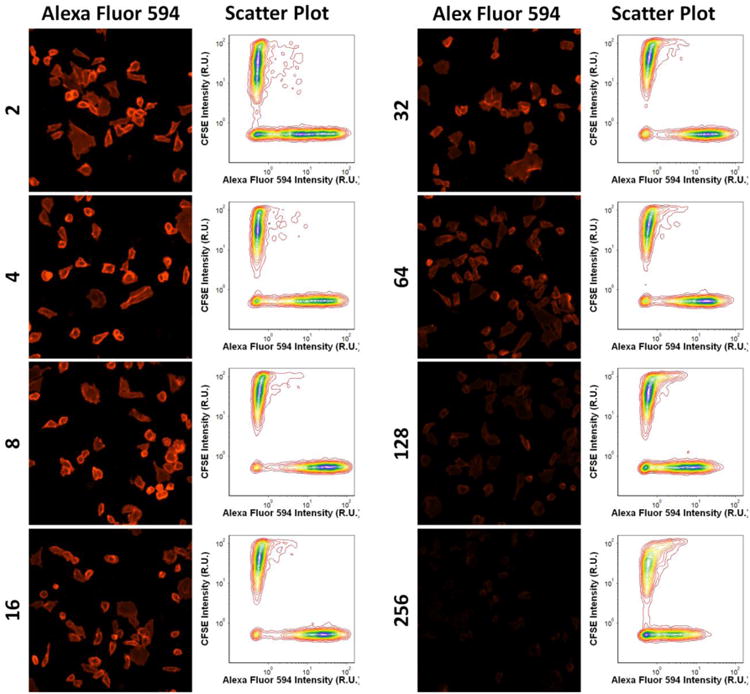
Example fluorescence images and intensity scatter plots for AF594 and CFSE at different dilutions of the primary antibodies. CD39-expressing CHO cell population showed decrease in fluorescence signals as the dilution factor increased.
Figure 4.
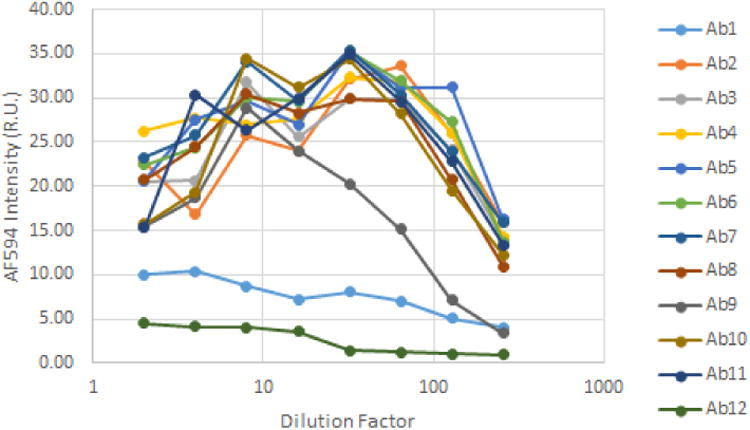
Dilution-dependent binding signal results for 12 positive hybridoma subclones, which showed high binding for Antibody 2-8, and 10-11, medium binding for Antibody 9, and low binding for Antibody 1 and 12.
One of the key characteristics of a promising antibody is its affinity coefficient Kd. We measured the Kd by titrating different concentrations of an in-house purified anti-CD39 antibody and a commercial anti-CD39 antibody (5F2, IgG1; eBioscience), and then using the Celigo Image Cytometer to acquire and analyze fluorescent images at the same exposure time. The purified antibody has the same Fab as the commercial 5F2 (IgG1), except for the Fc region. The overlaid fluorescence images (AF594 or PE with Hoechst) at different antibody concentrations are shown in Figure 5, where clear reduction of fluorescence signals were observed as the concentrations decreased. The dose response curves were plotted and the Kd values were calculated in Graphpad Prism, which showed 8.8 nM and 3.0 nM for the two antibodies, respectively (Figure 6). These results are indicative of the reliability of Celigo method, as there is only less than 1-log difference between Kd values of these two antibodies measured by Celigo method, which can be considered as similar. The isotype antibody control exhibited no binding to CD39-expressing CHO cells.
Figure 5.
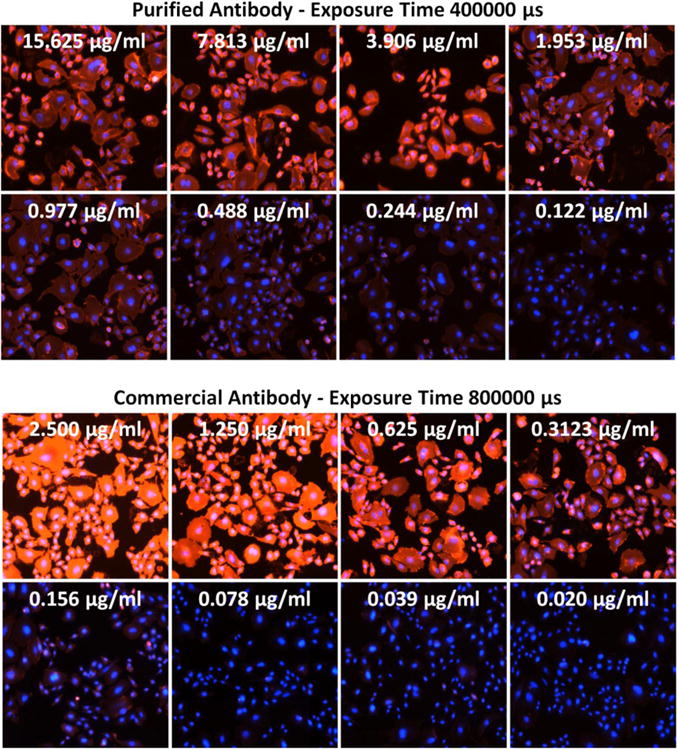
Overlay of fluorescence images of AF594 (Purified Mab), PE (Commercial Mab), and Hoechst at selected antibody concentrations for purified and commercial antibodies. The exposure times are 400000 and 800000 μs, respectively. The fluorescence intensities were clearly reduced as the antibody concentrations decreased.
Figure 6.
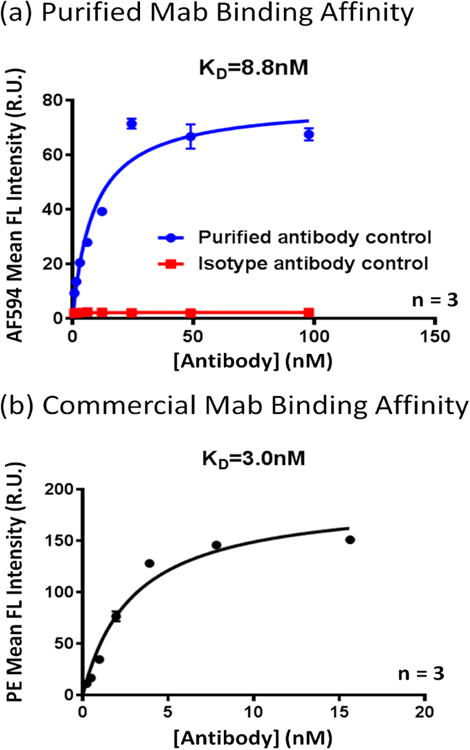
The antibody binding affinity results showing Kd binding coefficient of 8.8 and 3.0 nM for purified and commercial antibody, respectively. The data showed that the commercial antibody has higher binding affinity to CD39-expressing CHO cells. In parallel, isotype control antibody was also plotted showing no binding signals to the target CHO cells. Points indicate mean of triplicate determinations; bars, SD.
In addition, the Celigo Image Cytometer was able to detect binding signals as low as ∼30.50 ng/mL and ∼4.88 ng/mL for the two antibodies, respectively. Based on our experience, this sensitivity is at least one log greater than flow cytometry. Thus, Celigo Image Cytometer not only can be high-throughput, but also sensitive enough to pick up low signals that will otherwise be missed by conventional methods. As the screening procedure can be accomplished within one day, which is a critical requirement in many studies [22],researchers can subclone positive wells immediately to avoid the loss of important hybridoma clones.
Conclusion
In summary, we have demonstrated a novel hybridoma screening method using the Celigo image cytometer to accurately identify positive hits of hybridoma supernatant samples binding to the desired antigen on living cells. By optimizing a screening protocol, detecting fluorescence signals from low antibody concentration and measuring the Kd binding affinity coefficient, we showed that the proposed method is highly sensitive, high-throughput, and versatile, as well as time-efficient. Future work may need to further increase the throughput by utilizing 384-well plates and perform multiplex screening for a mixture of target antigens expressed on different cell populations labeled with respective cell tracking dyes as we did with CFSE in this study. If the sensitivity is high enough, this image-based method might be possible to entirely obviate the lengthy hybridoma fusion step by directly detecting antibodies from single B cells, whose antibody genes can be rescued by single cell PCR. Our data suggest that Celigo Image Cytometry has great potential to facilitate antibody discovery research, especially in searching for high quality therapeutic antibodies against cancer.
Supplementary Material
Acknowledgments
This work has been supported by the National Institute of Health awards P01HL107152 and R21 CA164970; grants from the Ben and Rose Cole Charitable PRIA foundation as well as the Leona M. and Harry B. Helmsley Charitable Trust to S.C.R., as well as the Charlotte F. & Irving W. Rabb Research Award to Y.W., together with scholarship from the China Scholarship Council to the first author H.Z.
Footnotes
Declaration of Conflicting Interests: The authors W.R. and L.L.C. are currently employees of Nexcelom Bioscience, LLC that owns the Celigo Image Cytometry technology. The remainder of the authors declares no conflict of interest.
Publisher's Disclaimer: This is a PDF file of an unedited manuscript that has been accepted for publication. As a service to our customers we are providing this early version of the manuscript. The manuscript will undergo copyediting, typesetting, and review of the resulting proof before it is published in its final citable form. Please note that during the production process errors may be discovered which could affect the content, and all legal disclaimers that apply to the journal pertain.
References
- 1.Kohler G, Milstein C. Continuous cultures of fused cells secreting antibody of predefined specificity. Nature. 1975;256(5517):495–497. doi: 10.1038/256495a0. [DOI] [PubMed] [Google Scholar]
- 2.Payne WJ, et al. Clinical laboratory applications of monoclonal antibodies. Clinical Microbiology Reviews. 1988;1(3):313–329. doi: 10.1128/cmr.1.3.313. [DOI] [PMC free article] [PubMed] [Google Scholar]
- 3.Long F, Zhu A, Shi H. Sensors. 10. Vol. 13. Basel, Switzerland: 2013. Recent Advances in Optical Biosensors for Environmental Monitoring and Early Warning; pp. 13928–13948. [DOI] [PMC free article] [PubMed] [Google Scholar]
- 4.Sliwkowski MX, Mellman I. Antibody Therapeutics in Cancer. Science. 2013;341(6151):1192. doi: 10.1126/science.1241145. [DOI] [PubMed] [Google Scholar]
- 5.Casadevall A, Dadachova E, Pirofski La. Passive antibody therapy for infectious diseases. Nat Rev Micro. 2004;2(9):695–703. doi: 10.1038/nrmicro974. [DOI] [PubMed] [Google Scholar]
- 6.Weltzin R, Monath TP. Intranasal Antibody Prophylaxis for Protection against Viral Disease. Clinical Microbiology Reviews. 1999;12(3):383–393. doi: 10.1128/cmr.12.3.383. [DOI] [PMC free article] [PubMed] [Google Scholar]
- 7.Scott AM, Wolchok JD, Old LJ. Antibody therapy of cancer. Nat Rev Cancer. 2012;12(4):278–287. doi: 10.1038/nrc3236. [DOI] [PubMed] [Google Scholar]
- 8.Vaidya HC, Dietzler DN, Ladenson JH. Inadequacy of Traditional ELISA for Screening Hybridoma Supernatants for Murine Monoclonal Antibodies. Hybridoma. 1985;4(3):271–276. doi: 10.1089/hyb.1985.4.271. [DOI] [PubMed] [Google Scholar]
- 9.Sasaki K, Glass TR, Ohmura N. Validation of Accuracy of Enzyme-Linked Immunosorbent Assay in Hybridoma Screening and Proposal of an Improved Screening Method. Analytical Chemistry. 2005;77(7):1933–1939. doi: 10.1021/ac048823k. [DOI] [PubMed] [Google Scholar]
- 10.Hansen HG, et al. Versatile microscale screening platform for improving recombinant protein productivity in Chinese hamster ovary cells. Scientifc Report. 2015;5:18016. doi: 10.1038/srep18016. [DOI] [PMC free article] [PubMed] [Google Scholar]
- 11.Lee JS, et al. Site-specific integration in CHO cells mediated by CRISPR/Cas9 and homology-directed DNA repair pathway. Scientifc Report. 2015;5:8572. doi: 10.1038/srep08572. [DOI] [PMC free article] [PubMed] [Google Scholar]
- 12.Mazor Y, et al. Enhancement of Immune Effector Functions by Modulating IgG's Intrinsic Affinity for Target Antigen. PLOS ONE. 2016;11(6):e0157788. doi: 10.1371/journal.pone.0157788. [DOI] [PMC free article] [PubMed] [Google Scholar]
- 13.Riedl T, et al. High-Throughput Screening for Internalizing Antibodies by Homogeneous Fluorescence Imaging of a pH-Activated Probe. Journal of Biomolecular Screening. 2016;21(1):12–23. doi: 10.1177/1087057115613270. [DOI] [PMC free article] [PubMed] [Google Scholar]
- 14.Kessel S, et al. High-Throughput 3D Tumor Spheroid Screening Method for Cancer Drug Discovery Using Celigo Image Cytometry. Journal of Laboratory Automation. 2016 doi: 10.1177/2211068216652846. [DOI] [PubMed] [Google Scholar]
- 15.Chan LLY, et al. A high-throughput AO/PI-based cell concentration and viability detection method using the Celigo image cytometry. Cytotechnology. 2016 doi: 10.1007/s10616-016-0015-x. [DOI] [PMC free article] [PubMed] [Google Scholar]
- 16.Feng L, et al. Neoplasia. 3. Vol. 13. New York, N.Y.: 2011. Vascular CD39/ENTPD1 Directly Promotes Tumor Cell Growth by Scavenging Extracellular Adenosine Triphosphate; pp. 206–216. [DOI] [PMC free article] [PubMed] [Google Scholar]
- 17.Bian S, et al. P2X7 Integrates PI3K/AKT and AMPK-PRAS40-mTOR Signaling Pathways to Mediate Tumor Cell Death. PLOS ONE. 2013;8(4):e60184. doi: 10.1371/journal.pone.0060184. [DOI] [PMC free article] [PubMed] [Google Scholar]
- 18.Miao R, et al. Utility of the dual-specificity protein kinase TTK as a therapeutic target for intrahepatic spread of liver cancer. Sci Rep. 2016;6:33121. doi: 10.1038/srep33121. [DOI] [PMC free article] [PubMed] [Google Scholar]
- 19.Deaglio S, et al. Adenosine generation catalyzed by CD39 and CD73 expressed on regulatory T cells mediates immune suppression. J Exp Med. 2007;204(6):1257–65. doi: 10.1084/jem.20062512. [DOI] [PMC free article] [PubMed] [Google Scholar]
- 20.Vinci M, et al. Advances in establishment and analysis of three-dimensional tumor spheroid-based functional assays for target validation and drug evaluation. BMC Biol. 2012;10(29):1–20. doi: 10.1186/1741-7007-10-29. [DOI] [PMC free article] [PubMed] [Google Scholar]
- 21.Whittaker L, Fuks A, Hand R. Plasma membrane orientation of simian virus 40 T antigen in three transformed cell lines mapped with monoclonal antibodies. Journal of Virology. 1985;53(2):366–373. doi: 10.1128/jvi.53.2.366-373.1985. [DOI] [PMC free article] [PubMed] [Google Scholar]
- 22.Burrin J, Newman D. In: Production and assessment of antibodies, in Principles and Practice of Immunoassay. Price CP, Newman DJ, editors. Palgrave Macmillan UK: London; 1991. pp. 19–52. [Google Scholar]
Associated Data
This section collects any data citations, data availability statements, or supplementary materials included in this article.


