

Abstract
Importance
Effects of modern high-deductible health plans (HDHP) on chronically ill patients and adverse outcomes are unknown.
Objective
Determine HDHP effects on high-priority diabetes outpatient care and preventable acute complications.
Design
Controlled interrupted-time-series.
Setting
A large national health insurer from 2003–2012.
Participants
12,084 HDHP members with diabetes age 12–64. HDHP members were enrolled for one year in a low-deductible (≤$500) plan followed by two years in a HDHP (≥$1000) after an employer-mandated switch. Patients transitioning to HDHPs were propensity-score-matched with contemporaneous patients whose employers offered only low-deductible coverage. Low-income (n=4121) and health savings account (HSA)-eligible (n=1899) diabetes patients were subgroups of interest.
Exposure
Employer-mandated HDHP transition.
Main Outcomes and Measures
High-priority outpatient visits, disease monitoring tests, and outpatient and emergency department visits for preventable acute diabetes complications.
Results
The overall, low-income, and HSA-eligible diabetes HDHP groups experienced increases in out-of-pocket medical expenditures of 49.4% (40.3%,58.4%), 51.7% (38.6%,64.7%), and 67.8% (47.9%,87.8%), respectively, relative to controls in the year after transitioning to HDHPs. High-priority primary care visits and disease monitoring tests did not change significantly in the overall HDHP cohort while high-priority specialist visits declined by 5.5% (−9.6%,−1.5%) and 7.1% (−11.5%,−2.7%) in follow-up years 1 and 2 versus baseline, respectively. Outpatient acute diabetes complication visits were delayed in the overall and low-income HDHP cohorts at follow-up (adjusted hazard ratios: 0.94 [0.88,0.99] and 0.89 [0.81,0.98], respectively). The overall, low-income, and HSA-eligible diabetes HDHP groups experienced increased emergency department acute complication visits of 8.0% (4.6%,11.4%), 21.7% (14.5%,28.9%), and 15.5% (10.5%,20.6%) per year, respectively.
Conclusions and Relevance
Diabetes patients experienced minimal changes in outpatient visits and disease monitoring after a HDHP switch, but low-income and HSA-eligible HDHP members experienced major increases in emergency department visits for preventable acute diabetes complications.
High-deductible health plans (HDHP) will soon be the predominant commercial health insurance arrangement in the US.1 HDHPs require potential annual out-of-pocket spending of approximately $1000–$6000 per person for most non-preventive services; in 2015, 46% of covered workers had deductibles of $1000 or more, while 19% had deductibles of $2000 or more.1
Diabetes is a major cause of morbidity and premature death in the US.2,3 High cost-sharing might especially affect chronically ill patients who require frequent and expensive services. However, effects of HDHPs on outpatient care patterns and adverse outcomes among chronically ill patients are unknown.
We hypothesized that some outpatient care, including preventive tests that are inexpensive even under HDHPs, would remain stable among HDHP members with diabetes. We further hypothesized that relatively expensive care such as specialist visits and outpatient visits for acute complications (paid out-of-pocket until the deductible is met), would decline or be delayed, increasing the frequency and severity of emergency department (ED) visits for acute complications.
METHODS
Study Population
We drew our study population from commercially insured members in the Optum database (Eden Prairie, MN) enrolled between 1/2003–12/2012. Data comprised enrollment tables and all medical, pharmacy, and hospitalization claims from members of a large national health plan. We included members in the study based on their employers’ health insurance offerings. We defined employers with low- and high-deductible coverage as those offering exclusively annual deductibles of ≤$500 or ≥$1000, respectively (eAppendix). To determine employer annual deductibles, we used a benefits variable that was available for most smaller employers (approximately ≤100 employees, representing 57.7% of account years) that included information such as in-network and out-of-network deductible, copayment, and co-insurance. For larger employers (42.4% of account years), we imputed deductible levels using out-of-pocket spending among employees who utilized health services, an algorithm that had 96.2% sensitivity and 97.0% specificity (eTable-1).
Both low- and high-deductible plans often cover a single annual preventive primary care visit and disease monitoring such as hemoglobin A1c testing at low or no out-of-pocket cost.1 In contrast, HDHP members on average must pay substantially higher amounts than low-deductible members for specialist, acute care, and ED visits.
Our study groups were drawn from individuals whose employers mandated a HDHP switch (HDHP group) or mandated continuation in low-deductible plans (control group), minimizing self-selection. We required HDHP group members to have 12 baseline months in a low-deductible plan followed by 24 months in an HDHP after the employer-mandated HDHP switch (36 continuous enrollment months per member). We defined the beginning of the month of the low-to-high deductible transition as the index date. We identified all potential control group members whose employers offered only low-deductible plans over at least a 3-year period (n=1,674,527).
To further minimize potential selection effects, especially at the employer level, we used a two-level (employer- and member-level) propensity score matching approach4,5 (eAppendix) and estimated propensity scores predicting the likelihood of a mandated HDHP switch. After matching at the employer level on multiple characteristics (eAppendix), we identified diabetes patients age 12–64 using a standard claims-based algorithm (eTable-2; n=12,854 HDHP and 69,749 control pool members [Table 1]). We included patients who first met the diabetes diagnosis algorithm criteria between 6 months before to 6 months after the beginning of the baseline year. Less than half a percent of members in the HDHP and control pool had missing census-derived characteristics (Table 1) and were excluded from the propensity score match.
Table 1.
Baseline characteristics of the high-deductible health plan group and the control group, before and after the propensity score match.
| Before Propensity Score Match1 | After Propensity Score Match | |||||
|---|---|---|---|---|---|---|
| HDHP Group | Control Group | P-Value | HDHP Group | Control Group | P-Value | |
| Characteristics | (n=12,854) | (n=69,749) | (n=12,084) | (n=12,084) | ||
| Age > 40 on index date, No. (%) | 11133 (86.6) | 60144 (86.2) | 0.25 | 10455 (86.5) | 10392 (86.0) | 0.24 |
| Age on index date, Mean (SD) | 50.4 (10.0) | 50.7 (10.2) | <0.001 | 50.4 (10.0) | 50.5 (10.3) | 0.04 |
| Female, No. (%) | 5724 (44.5) | 32259 (46.3) | <0.001 | 5410 (44.8) | 5430 (44.9) | 0.80 |
| Race/ethnicity, No. (%) | <0.001 | 0.002 | ||||
| Hispanic | 1379 (10.7) | 8770 (12.6) | 1297 (10.7) | 1382 (11.5) | ||
| Asian | 275 (2.1) | 2395 (3.4) | 264 (2.2) | 351 (2.9) | ||
| Black neighborhood | 387 (3.0) | 2747 (3.9) | 377 (3.1) | 368 (3.1) | ||
| Mixed neighborhood | 1886 (14.7) | 11303 (16.2) | 1780 (14.7) | 1785 (14.8) | ||
| White neighborhood | 8912 (69.4) | 44389 (63.8) | 8353 (69.2) | 8172 (67.8) | ||
| No. (%) living in neighborhoods with below-high-school education levels of | <0.001 | <0.001 | ||||
| <15% | 6304 (49.1) | 35479 (50.9) | 5918 (49.0) | 6007 (49.8) | ||
| 15%–24.9% | 3379 (26.3) | 17500 (25.1) | 3182 (26.4) | 3058 (25.4) | ||
| 25%–39.9% | 2367 (18.4) | 12024 (17.3) | 2228 (18.5) | 2175 (18.0) | ||
| >=40% | 793 (6.2) | 4632 (6.7) | 746 (6.2) | 821 (6.8) | ||
| No. (%) living in neighborhoods with below- poverty levels of | 0.004 | 0.37 | ||||
| <5%2 | 4990 (38.9) | 28104 (40.4) | 4708 (39.0) | 4639 (38.5) | ||
| 5%–9.9%2 | 3391 (26.4) | 18385 (26.4) | 3166 (26.2) | 3281 (27.2) | ||
| 10%–19.9%3 | 2922 (22.8) | 15132 (21.7) | 2746 (22.7) | 2689 (22.3) | ||
| >=20%3 | 1540 (12.0) | 8014 (11.5) | 1454 (12.0) | 1452 (12.0) | ||
| ACG score, Mean (SD) | 2.9 (3.7) | 3.0 (3.8) | <0.001 | 2.8 (3.6) | 2.8 (3.5) | 0.07 |
| United States Region, No. (%) | <0.001 | |||||
| West | 1187 (9.2) | 6574 (9.4) | 1089 (9.0) | 1199 (9.9) | ||
| South | 4668 (36.3) | 21222 (30.4) | 4496 (37.2) | 3840 (31.8) | ||
| Midwest | 6363 (49.5) | 31897 (45.8) | 5868 (48.6) | 6129 (50.8) | ||
| Northeast | 629 (4.9) | 10011 (14.4) | 624 (5.2) | 904 (7.5) | ||
| Outpatient visit co-payment > $15, No. (%) | 8431 (65.6) | 29987 (43.0) | <0.001 | 7745 (64.1) | 7472 (61.8) | <0.001 |
| Employer Size, mean, No. (SD) | 582.9 (1532.3) | 5143.8 (11704.5) | <0.001 | 614.9 (1574.8) | 652.1 (1447.0) | <0.001 |
Abbreviations: HDHP, high-deductible health plan; ACG, adjusted clinical groups morbidity score. Please see manuscript for details.
0.12% of HDHP members and 0.21% of control group members (fewer than 1%) had missing race/ethnicity information; 0.09% of HDHP members and 0.16% of control group members (fewer than 1%) had missing education and poverty level information; 0.05% of HDHP members and 0.06% of control group members (fewer than 1%) of control group members had missing U.S. region information. These members were excluded from the match so that the matched sample included no members with missing characteristics.
Defined as high-income;
Defined as low-income.
Within quartiles of the employer propensity score, we matched HDHP members with diabetes at the patient-level 1:1 to controls with diabetes based on age, gender, race/ethnicity, neighborhood poverty and education, US region, Adjusted Clinical Groups (ACG)-morbidity score,6,7 month of first diabetes diagnosis, employer size, and index month. We also matched on baseline quarterly numbers of high-priority (defined below) primary care and specialist visits, preventable acute diabetes complication visits (defined below), ED visits, hospitalization days, and baseline quarterly total out-of-pocket spending per member.8,9 Compared with the unmatched sample, our propensity score matching approach increased the similarity of the HDHP and control groups with respect to age, gender, neighborhood poverty level, morbidity score, baseline outpatient copayment, and employer size (Table 1). Our final group included 12,084 HDHP members with diabetes and their 1:1 matched controls.
Our primary subgroups of interest, based on previous evidence of adverse HDHP effects,10,11 included high-morbidity and low-income diabetes patients (defined below; n=3640 and 4121 per group, respectively). We also assessed HDHP members who were eligible to have health savings accounts (HSA) because such plans are rapidly increasing in prevalence and have the highest out-of-pocket obligations among commercial insurance plans.1 HSAs allow pre-tax contributions from employers or members, funds that can be used to pay for qualified medical expenses.12
Design
We used a before-after with comparison group design, a controlled time-to-event design applied to the baseline and follow-up periods, or a controlled cumulative monthly interrupted-time-series design depending on the outcome type.
Measures
Utilization and Disease Monitoring Measures
We used standard algorithms for detecting outpatient visits with Current Procedural Terminology (CPT®) evaluation and management codes and a provider type variable to classify visits as primary care or specialist. We then applied a taxonomy developed by Fenton and colleagues13 (eAppendix) to characterize each office visit as “high-priority” or “low-priority” based on the primary diagnosis. High-priority diagnoses are considered more likely to benefit from medical care, although the measure is not intended to reflect the appropriateness of particular visits. We captured outpatient disease monitoring measures based on Healthcare Effectiveness Data and Information Set (HEDIS)14 specifications, including ≥1 annual: primary care visit; hemoglobin A1c, low-density lipid cholesterol (LDL-C), and microalbumin test; and retinal eye exam (eTable-3).
Health Outcome Measures
To assess whether HDHPs were associated with changes in time-sensitive care, two clinicians on our team (J.F.W and E.M.E) used a systematic approach to develop a measure of outpatient and ED visits that could indicate a preventable acute diabetes complication (eAppendix, hereafter, “complication visits”). We defined acute diabetes complications as symptoms or conditions (when coded by clinicians as the primary diagnosis) that could be associated with delaying recommended or urgent diabetes-related outpatient or ED care (including prescription drug use) for up to 4 months and that require timely care by medical professionals. We validated this measure in our population (eTables 5 and 6) by determining that outpatient and ED visits with these complication diagnoses were associated with odds ratios of 4.10 (3.98, 4.23) and 3.02 (2.96, 3.08), respectively, of subsequent hospitalization compared with other types of outpatient or ED visits. The 5 most common categories of outpatient complication visits at baseline, accounting for 82.0% of such visits, were cellulitis, urinary tract infection, angina and ischemic heart disease, acute cerebrovascular disease, and pneumonia. The 5 most common categories of ED complication visits at baseline, accounting for 62.0% of such visits, were cellulitis, urinary tract infection, hypo/hyperglycemia and their major acute complications, angina and ischemic heart disease, and pneumonia.
We summed all healthcare expenditures (i.e., paid by the health plan and patient) during the 7 days following an acute complication visit to the ED as a health outcome measure to assess intensity of and need for diagnostic and therapeutic services. That is, we included this as a proxy to indicate level of “sickness” at presentation to the ED.
Covariates
We applied the Johns Hopkins ACG® System comorbidity score (ACG, version 10.0.1) algorithm, a validated measure that predicts mortality,6,15 to members’ baseline year to estimate comorbidity, and defined high- and low-morbidity as ACG scores of ≥3.0 and <2.0, respectively. Using 2000 US Census block data and validated methods,16,17 we defined members as high- and low-income based on living in neighborhoods with below-poverty-levels of <5% and ≥10%, respectively, and used a similar approach to categorize education levels.16–21 We classified members as white, black, Hispanic, Asian, or other based on a combination of geocoding and surname analysis (eAppendix).22,23 Other covariates included age category (12–25, 26–45, ≥ 40–64 years), gender, and US region (West, Midwest, South, Northeast).
Analysis
We compared baseline characteristics of our study groups using chi-squared tests, t-tests, and non-parametric tests.24 In all statistical models estimating HDHP effects, we removed from analyses the month before and after the index date to reduce bias due to anticipatory increases in utilization prior to the HDHP switch (and consequent reductions in the month after the switch).
For the high priority primary care and specialist visit outcomes, we first fit interrupted-time-series models25 in order to both visually display monthly trends and confirm that the study groups did not have differential baseline trends, a key assumption of difference-in-differences analysis. We then used difference-in-differences analysis to examine changes in annual high-priority outpatient visits and disease monitoring measures. We applied generalized estimating equations26,27 models with a negative binomial distribution for outpatient visits and a binary distribution for disease monitoring measures, controlling for age, gender, race/ethnicity, education level, poverty level, US region, ACG score, employer size, and index date.
To examine time to first outpatient and ED visits for acute complications, we used separate Cox proportional hazards regression models for the baseline and follow-up periods, adjusting for the same covariates as above.
To analyze annual changes in complication visits and subsequent 7-day total expenditures, we applied aggregate-level segmented regression to cumulative rates that had been adjusted for the above covariates (eAppendix).
Using the same methods and outcomes, we conducted subgroup analyses stratified by low and high-income and morbidity, and examined HSA-eligible members and their matched pairs. We also assessed several other subgroups of interest including those defined by other income cutoffs (residing in neighborhoods with under 10%, over 5%, and over 20% of households below the Federal poverty level), and residents of predominantly white and non-white race neighborhoods. As a sensitivity analysis, we restricted the sample to members age 18–64, re-matched, then analyzed all primary outcomes.
RESULTS
Baseline Characteristics
The average age of HDHP and control members was 50 and 45% in each group were female (Table 1). 35% in both groups lived in low-income neighborhoods, 25% lived in low-education neighborhoods, 11–12% were Hispanic members, and the mean ACG morbidity score was 2.8 (standard deviation ~3.6). At baseline, HDHP and control members had unadjusted mean high-priority primary care visit rates of 2.04 and 2.05 (p=0.69) per member per year, respectively, and corresponding high-priority specialist visit rates of 1.38 and 1.38 (p=0.94), respectively.
Changes in Out-of-Pocket Exposure
The overall, low-morbidity, high-morbidity, high-income, low-income, and HSA diabetes HDHP groups experienced increases in mean out-of-pocket medical expenditures of 49.4% (40.3%,58.4%; absolute: $374.6), 56.8% (45.8%,67.8%; absolute: $292.0), 40.9% (31.5%,50.4%; absolute: $448.8), 48.4% (37.2%,59.6%; absolute: $361.8), 51.7% (38.6%,64.7%; absolute: $400.4), and 67.8% (47.9%,87.8%; absolute: $463.0), respectively, relative to controls in the year after transitioning to HDHPs (eTable-7). Out-of-pocket obligations for hemoglobin A1c, LDL-C, and microalbumin tests increased from a mean of $1.2–$1.4 at baseline among HDHP members to $2.2–$4.8 at follow-up (eTable-8). Primary care visit costs increased from $15.4 to $23.3–$26.8 from baseline to follow-up among HDHP members, while specialist visits averaged $23.3 at baseline and approximately $42 at follow-up.
Utilization and Disease Monitoring Measures
In adjusted difference-in-differences analyses, only the low-morbidity, high-income, and low-income HDHP subgroups experienced baseline-to-follow-up year 2 changes in high-priority primary care visits of −5.1% (−8.6%,−1.6%), −5.7% (−10.5%,−0.9%), and −5.2% (−9.8%,−0.7%), respectively (Table 2; eFigure-2).
Table 2.
Rates of high-priority outpatient visits among HDHP group members before and after a HDHP switch compared to contemporaneous control group members.
| Mean Annual Rates, per Member1 | Relative Change in HDHP vs Control Group per Member, Year 1 vs Baseline1 | Relative Change in HDHP vs Control Group per Member, Year 2 vs Baseline1 | ||||||||
|---|---|---|---|---|---|---|---|---|---|---|
| HDHP Group | Control Group | |||||||||
| Baseline | Year 1 | Year 2 | Baseline | Year 1 | Year 2 | Estimate | (95% CI) | Estimate | (95% CI) | |
| Overall Cohort (n=12,084 per group) | ||||||||||
| Primary Care | 2.09 | 1.93 | 1.92 | 2.11 | 1.97 | 1.96 | −1.1% | (−3.8%, 1.7%) | −1.5% | (−4.4%, 1.4%) |
| Specialist | 1.43 | 1.46 | 1.52 | 1.42 | 1.53 | 1.63 | −5.5% | (−9.6%, −1.5%) | −7.1% | (−11.5%, −2.7%) |
| Low-morbidity2 (n=7956 per group) | ||||||||||
| Primary Care | 1.83 | 1.78 | 1.77 | 1.84 | 1.81 | 1.88 | −1.0% | (−4.4%, 2.4%) | −5.1% | (−8.6%, −1.6%) |
| Specialist | 0.82 | 0.99 | 1.11 | 0.81 | 1.03 | 1.20 | −4.3% | (−10.4%, 1.7%) | −7.9% | (−14.4%, −1.4%) |
| High-morbidity3 (n=3640 per group) | ||||||||||
| Primary Care | 2.69 | 2.28 | 2.27 | 2.61 | 2.25 | 2.21 | −1.4% | (−6.4%, 3.6%) | −0.1% | (−5.7%, 5.4%) |
| Specialist | 2.72 | 2.29 | 2.22 | 2.59 | 2.36 | 2.40 | −8.0% | (−13.6%, −2.4%) | −12.2% | (−17.9%, −6.5%) |
| High-income4 (n=4555 per group) | ||||||||||
| Primary Care | 1.95 | 1.79 | 1.76 | 1.91 | 1.81 | 1.83 | −2.8% | (−7.5%, 1.9%) | −5.7% | (−10.5%, −0.9%) |
| Specialist | 1.52 | 1.51 | 1.56 | 1.55 | 1.61 | 1.79 | −4.5% | (−10.7%, 1.7%) | −10.7% | (−17.1%, −4.3%) |
| Low-income5 (n=4121 per group) | ||||||||||
| Primary Care | 2.26 | 2.08 | 2.07 | 2.27 | 2.17 | 2.19 | −3.7% | (−8.0%, 0.6%) | −5.2% | (−9.8%, −0.7%) |
| Specialist | 1.28 | 1.36 | 1.42 | 1.25 | 1.38 | 1.50 | −3.5% | (−10.9%, 4.0%) | −7.6% | (−15.9%, 0.7%) |
| Health Savings Account HDHP | ||||||||||
| Members vs Matched Controls6 (n=1899 per group) | ||||||||||
| Primary Care | 2.05 | 1.92 | 1.91 | 2.03 | 2.01 | 1.91 | −5.1% | (−11.7%, 1.5%) | −0.8% | (−8.1%, 6.5%) |
| Specialist | 1.62 | 1.62 | 1.76 | 1.54 | 1.64 | 1.67 | −6.0% | (−15.7%, 3.7%) | 0.3% | (−11.5%, 12.2%) |
Abbreviations: HDHP, high-deductible health plan; CI, confidence interval.
All rates and changes estimated using the STATA margins and/or nlcom commands and adjusted for age, gender, race/ethnicity, education level, poverty level, US region, ACG score, employer size, and index date.
Adjusted Clinical Groups (see text) score of <2.
Adjusted Clinical Groups (see text) score of ≥3.
Living in neighborhoods with below-poverty levels of less than 5%.
Living in neighborhoods with below-poverty levels of 10% or greater.
Health Savings Accounts allow pre-tax contributions from employers or members themselves, funds that can be used to pay for qualified medical expenses.
High-priority specialist visits declined in the overall HDHP cohort by 5.5% (−9.6%,−1.5%) and 7.1% (−11.5%,−2.7%) in follow-up years 1 and 2 versus baseline, respectively. Among the low- and high-morbidity HDHP subgroups compared with controls, year 2 versus baseline changes in high-priority specialist visits were −7.9% (−14.4%,−1.4%) and −12.2% (−17.9%,−6.5%), respectively. Corresponding changes among high- and low-income HDHP members were −10.7% (−17.1%,−4.3%) and −7.6% (−15.9%,0.7%).
By follow-up year 2, we did not detect any changes in disease monitoring measures including annual primary care visits (relative change: −0.2% [−1.4%,0.9%]); hemoglobin A1c (−0.8% [−2.6%,1.0%]), LDL-C (−1.6% [−3.6%,0.5%]), and microalbumin (−0.7% [−4.7%,3.4%]) tests; and retinal eye exams (0.9% [−3.4%,5.1%]), patterns that were similar across all subgroups (Table 3).
Table 3.
Rates of quality measures among HDHP group members before and after a HDHP switch compared to contemporaneous control group members, and stratified by morbidity and income.
| Mean Annual Rates, per Member1 | Relative Change in HDHP vs Control Group1 Year 1 vs Baseline1 | Relative Change in HDHP vs Control Group1 Year 2 vs Baseline1 | ||||||||
|---|---|---|---|---|---|---|---|---|---|---|
| HDHP Group | Control Group | |||||||||
| Baseline | Year 1 | Year 2 | Baseline | Year 1 | Year 2 | Estimate | (95% CI) | Estimate | (95% CI) | |
| Overall Cohort | ||||||||||
| Primary Care Visit | 0.88 | 0.87 | 0.80 | 0.89 | 0.88 | 0.81 | 0.1% | (−1.0%, 1.2%) | −0.2% | (−1.4%, 0.9%) |
| Hemoglobin A1c Test | 0.70 | 0.67 | 0.63 | 0.70 | 0.68 | 0.64 | −0.4% | (−2.2%, 1.3%) | −0.8% | (−2.6%, 1.0%) |
| LDL-C Test | 0.66 | 0.65 | 0.61 | 0.66 | 0.66 | 0.62 | −0.7% | (−2.7%, 1.3%) | −1.6% | (−3.6%, 0.5%) |
| Microalbumin Test | 0.33 | 0.35 | 0.34 | 0.33 | 0.34 | 0.34 | 0.4% | (−3.7%, 4.4%) | −0.7% | (−4.7%, 3.4%) |
| Retinal Eye Exam | 0.30 | 0.31 | 0.32 | 0.31 | 0.33 | 0.33 | −1.3% | (−5.5%, 3.0%) | 0.9% | (−3.4%, 5.1%) |
| Low-morbidity2 | ||||||||||
| Primary Care Visit | 0.87 | 0.86 | 0.79 | 0.86 | 0.86 | 0.80 | −0.5% | (−2.0%, 1.0%) | −2.1% | (−3.6%, −0.5%) |
| Hemoglobin A1c Test | 0.69 | 0.68 | 0.63 | 0.70 | 0.68 | 0.64 | 0.4% | (−1.8%, 2.6%) | −0.9% | (−3.2%, 1.3%) |
| LDL-C Test | 0.65 | 0.65 | 0.61 | 0.66 | 0.66 | 0.63 | 1.5% | (−1.1%, 4.1%) | 0.2% | (−2.4%, 2.8%) |
| Microalbumin Test | 0.32 | 0.35 | 0.34 | 0.33 | 0.35 | 0.35 | −0.3% | (−5.3%, 4.7%) | −1.0% | (−6.0%, 3.9%) |
| Retinal Eye Exam | 0.26 | 0.29 | 0.29 | 0.26 | 0.30 | 0.31 | −3.0% | (−8.7%, 2.7%) | −5.1% | (−10.6%, 0.4%) |
| High-morbidity3 | ||||||||||
| Primary Care Visit | 0.93 | 0.90 | 0.83 | 0.94 | 0.90 | 0.83 | 1.0% | (−0.7%, 2.7%) | 1.0% | (−0.8%, 2.8%) |
| Hemoglobin A1c Test | 0.72 | 0.67 | 0.63 | 0.72 | 0.68 | 0.62 | −0.3% | (−3.4%, 2.9%) | 1.6% | (−1.7%, 4.9%) |
| LDL-C Test | 0.69 | 0.66 | 0.61 | 0.69 | 0.68 | 0.62 | −2.0% | (−5.5%, 1.5%) | −1.1% | (−4.7%, 2.5%) |
| Microalbumin Test | 0.35 | 0.35 | 0.34 | 0.36 | 0.35 | 0.34 | 2.7% | (−4.6%, 10.1%) | 1.6% | (−5.7%, 8.9%) |
| Retinal Eye Exam | 0.38 | 0.36 | 0.38 | 0.40 | 0.40 | 0.38 | −4.1% | (−10.5%, 2.3%) | 2.4% | (−4.3%, 9.2%) |
| High-income4 | ||||||||||
| Primary Care Visit | 0.88 | 0.86 | 0.80 | 0.89 | 0.86 | 0.81 | 0.6% | (−1.2%, 2.5%) | −1.1% | (−3.0%, 0.7%) |
| Hemoglobin A1c Test | 0.72 | 0.69 | 0.64 | 0.72 | 0.70 | 0.66 | −1.3% | (−4.0%, 1.4%) | −2.8% | (−5.6%, −0.1%) |
| LDL-C Test | 0.67 | 0.66 | 0.62 | 0.69 | 0.69 | 0.65 | −1.3% | (−4.5%, 1.8%) | −2.1% | (−5.2%, 1.1%) |
| Microalbumin Test | 0.36 | 0.37 | 0.37 | 0.36 | 0.36 | 0.39 | 5.7% | (−0.8%, 12.1%) | −4.6% | (−10.4%, 1.2%) |
| Retinal Eye Exam | 0.32 | 0.34 | 0.35 | 0.34 | 0.36 | 0.36 | 3.3% | (−3.5%, 10.1%) | 3.5% | (−3.1%, 10.0%) |
| Low-income5 | ||||||||||
| Primary Care Visit | 0.89 | 0.88 | 0.80 | 0.90 | 0.88 | 0.82 | 0.4% | (−1.4%, 2.3%) | −0.8% | (−2.7%, 1.2%) |
| Hemoglobin A1c Test | 0.68 | 0.66 | 0.61 | 0.69 | 0.67 | 0.63 | −0.2% | (−3.2%, 2.9%) | −1.9% | (−5.1%, 1.3%) |
| LDL-C Test | 0.63 | 0.64 | 0.59 | 0.65 | 0.64 | 0.61 | 2.1% | (−1.6%, 5.8%) | 0.3% | (−3.4%, 4.1%) |
| Microalbumin Test | 0.31 | 0.32 | 0.31 | 0.32 | 0.33 | 0.32 | 2.4% | (−5.1%, 10.0%) | 3.1% | (−4.5%, 10.7%) |
| Retinal Eye Exam | 0.27 | 0.28 | 0.28 | 0.28 | 0.30 | 0.30 | −2.2% | (−9.9%, 5.5%) | 0.4% | (−7.4%, 8.2%) |
| Health Savings Account HDHP Members vs Matched Controls6 | ||||||||||
| Primary Care Visit | 0.90 | 0.87 | 0.81 | 0.90 | 0.89 | 0.81 | −1.2% | (−3.9%, 1.5%) | −0.2% | (−3.1%, 2.7%) |
| Hemoglobin A1c Test | 0.70 | 0.69 | 0.63 | 0.70 | 0.68 | 0.62 | 0.7% | (−3.7%, 5.1%) | 1.3% | (−3.5%, 6.0%) |
| LDL-C Test | 0.66 | 0.67 | 0.62 | 0.66 | 0.64 | 0.61 | 3.6% | (−1.7%, 8.8%) | 0.8% | (−4.6%, 6.1%) |
| Microalbumin Test | 0.36 | 0.37 | 0.36 | 0.34 | 0.35 | 0.35 | 0.9% | (−9.1%, 11.0%) | −1.3% | (−11.2%, 8.5%) |
| Retinal Eye Exam | 0.32 | 0.36 | 0.35 | 0.30 | 0.33 | 0.34 | 2.1% | (−8.4%, 12.5%) | −2.0% | (−12.0%, 7.9%) |
Abbreviations: HDHP, high-deductible health plan; CI, confidence interval.
All rates and changes estimated using the STATA margins and/or nlcom commands and adjusted for age, gender, race/ethnicity, education level, poverty level (as appropriate), US region, ACG (as appropriate) score, employer size, and index date.
Adjusted Clinical Groups (see text) score of <2.
Adjusted Clinical Groups (see text) score of ≥3.
Living in neighborhoods with below-poverty levels of less than 5%.
Living in neighborhoods with below-poverty levels of 10% or greater.
Health Savings Accounts allow pre-tax contributions from employers or members themselves, funds that can be used to pay for qualified medical expenses.
Health Outcome Measures
The overall HDHP diabetes cohort experienced a follow-up period delay in time to first outpatient complication visit relative to controls (adjusted hazard ratio, aHR: 0.94 [0.88,0.99]; eTable-15 and eFigure-3) that was not present at baseline (aHR: 1.01 [0.93,1.09]). Total annual ED complication visits and complication episode expenditures increased by 8.0% (4.6%,11.4%) and 5.6% (3.8%,7.3%) in the overall HDHP group relative to controls (eTables 16 and 17, eFigure-3).
Among key HDHP subgroups, high-morbidity HDHP members experienced a follow-up period delay in first outpatient complication visits (aHR 0.89 [0.82,0.97]; Figure 2 and eTable-16) and increased annual total expenditures for ED complication episodes (adjusted relative change: 12.1% [7.2%,17.0%]; eTable-17).
Figure 2.
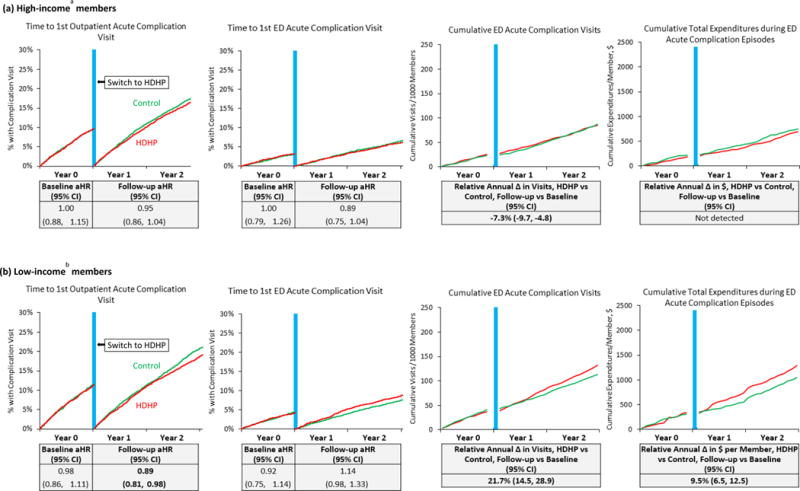
Unadjusted plots of preventable acute diabetes complication measures and tables (below each plot) showing adjusted effect estimates, stratified by income group.
Abbreviations: HDHP, high-deductible health plan; aHR, adjusted hazard ratio; CI, confidence interval. Note: “Total expenditures during acute complication episodes” is a proxy indicating overall utilization in the 7 days following emergency department visits for preventable acute diabetes complications (as defined in the manuscript). Vertical blue lines are centered at the index date when HDHP members were switched into HDHPs. aLiving in neighborhoods with below-poverty levels of less than 5%. bLiving in neighborhoods with below-poverty levels of 10% or greater.
Low-income HDHP members also delayed first outpatient complication visits at follow-up (0.89 [0.81,0.98], Figure 3 and eTable-16), experienced an acceleration in first ED complication visits that approached statistical significance (aHR: 1.14 [0.98,1.33]), had increased total ED complication visits (21.7% [14.5%,28.9%]), and increased total expenditures for ED episodes (9.5% [6.5%,12.5%]). Corresponding changes in these ED outcomes among HSA HDHP members were 15.5% (10.5%,20.6%) and 29.6% ([19.0%,40.1%]; eFigure-5 and eTable-17).
Sensitivity analyses (eAppendix) did not change interpretation of our main findings and results are included in eTables 10,11,13–19; and eFigure-4).
DISCUSSION
HDHP members with diabetes experienced minimal changes in high-priority outpatient visits and disease monitoring measures, but delayed presenting for first outpatient complication visits and experienced 6%–8% increases in ED complication measures. Low-income and high-morbidity HDHP members also experienced delays in presenting for outpatient complication visits after the HDHP switch, and these groups as well as HSA-HDHP members experienced moderate-to-large increases in ED acute complication visits or expenditures.
Our results were generally consistent with our hypotheses. Reductions in specialist visits were smaller than expected, but the decline in this rate might have been tempered by increased need for specialist care because of increased diabetes complication severity. Although we cannot directly determine whether delayed outpatient complication visits caused increased morbidity among vulnerable HDHP members, the large increases in ED complication episode costs we detected seems suggestive. Despite some uncertainty about causal mechanisms and morbidity impacts, increased acute diabetes complications and associated expenditures are almost certainly unintended consequences that all stakeholders wish to avoid. Of note, adverse HDHP effects in diabetes would have gone undetected if assessed using traditional HEDIS disease monitoring metrics, suggesting that health systems could benefit from adopting acute preventable diabetes complication measures such as the one we created and validated.
Reasons for our acute complication findings may be clarified by considering effects in our key patient subgroups. It is likely that high-morbidity, low-income, and HSA-eligible diabetes patients (who experienced the largest cost-sharing increases) had significantly greater concerns about HDHP-related out-of-pocket spending than their less vulnerable HDHP counterparts. These patients might therefore attempt to minimize health expenditures by forgoing expensive scheduled and acute visits, or by shifting care to less expensive but potentially less appropriate settings. Such effects might lead to more severe disease by the time of presentation for acute complications. Adverse outcomes among HSA-HDHP members might imply that HSA funding levels were low, that patients were unaware of this resource, or that they engaged in inappropriate attempts to preserve HSA funds. These findings among subgroups suggest that a bifurcation of outpatient care could be occurring among HDHP members with diabetes, with less vulnerable patients largely unaffected, but more vulnerable patients facing access limitations that ultimately increase utilization. Future studies could directly assess the causal relationship between care delays and acute complication visits, and determine whether other factors such as medication non-adherence play any role.
No previous research has examined outpatient visits or complications among HDHP patients with diabetes. The RAND Health Insurance Experiment from 40 years ago predicted that the “poor and sick” would have increased long-term mortality under high-level cost sharing due to worsened hypertension control.11 Our study, which occurs in a different health care era and includes a far larger sample size, is the first to examine acute complication measures among chronically ill HDHP members. It adds the key finding that concerning utilization patterns increase soon after a HDHP switch among similarly vulnerable populations. Other chronically ill HDHP patients who require time-sensitive care, such as those with coronary heart disease, heart failure, or cancer might be at risk, but further research is warranted.
Two previous studies found minimal or no changes in several diabetes disease monitoring metrics;28,29 similarly, we detected no changes in such measures, likely related to low out-of-pocket costs (eTable-8) and perhaps the perceived non-discretionary nature of these tests (e.g., retinal eye exams). These findings should be reassuring to primary care physicians both because they might presage unchanged long-term disease control under HDHPs and also because rates of such tests are increasingly being used to measure clinician “quality.” Our disease monitoring results also confirm a growing body of literature demonstrating that excluding “high value” services such as secondary preventive tests from cost-sharing under HDHPs might help to preserve use.30–33
This study has several potential limitations. We did not have exact benefit coverage details for large employers, but we utilized a highly sensitive and specific algorithm for detecting their deductible levels. Furthermore, our analyses of “gold-standard” out-of-pocket expenditures showed that, at the population level, the HDHP group experienced increased out-of-pocket medical expenditures of approximately 50%, indicating the validity of our plan type classification. Our measure of acute complication visits is novel, but we created the measure rigorously and validated it extensively as described above and in the eAppendix. Furthermore, the top 5 diagnosis clusters (e.g., cellulitis, urinary tract infection, hypo/hyperglycemia and their major acute complications, angina and ischemic heart disease, and pneumonia) have face validity and analyses of this subset revealed similar patterns (eTable-19). Nevertheless, measurement error is still possible given lack of consensus regarding which diagnoses comprise “acute preventable diabetes complications” and the imprecision of ICD-9 diagnoses. We did not have information about HSA contributions, data that could allow determining whether such funds modify the adverse outcomes we detected. We also did not report changes in medication use or laboratory values (due to a high degree of missing values). We did not have access to health insurance premiums and therefore could not estimate total member expenditures (premiums plus out-of-pocket). Finally, our study is not representative of people with non-employer-sponsored insurance, very low socioeconomic status patients, members with very high deductibles, or people whose first exposure to insurance is under HDHPs.
We found that diabetes patients experienced minimal changes in outpatient visits and disease monitoring after a HDHP switch, but low-income, high-morbidity, and HSA-HDHP subgroups experienced major increases in ED visits or expenditures for preventable acute diabetes complications. These subgroups might be especially at risk in the increasingly HDHP-centric private US health system, and our results support a strategy of minimizing the enrollment of vulnerable diabetes subpopulations in HDHPs or targeting cost-sharing reductions such as HSA contributions to such patients.34
Supplementary Material
Figure 1.
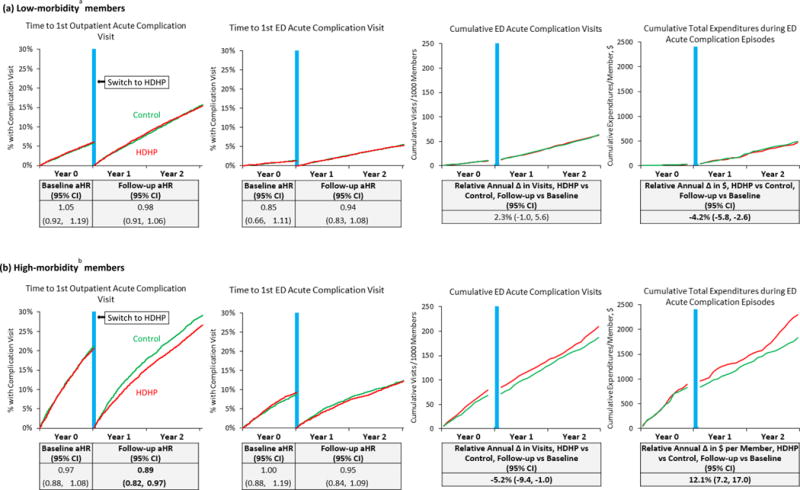
Unadjusted plots of preventable acute diabetes complication measures and tables (below each plot) showing adjusted effect estimates, stratified by morbidity group.
Abbreviations: HDHP, high-deductible health plan; aHR, adjusted hazard ratio; CI, confidence interval. Note: “Total expenditures during acute complication episodes” is a proxy indicating overall utilization in the 7 days following emergency department visits for preventab le acute diabetes complications (as defined in the manuscript). Vertical blue lines are centered at the index date when HDHP members were switched into HDHPs. aAdjusted Clinical Groups score less than 2.0; bAdjusted Clinical Groups score greater than or equal to 3.0.
Acknowledgments
This work was supported by a grant from CDC/NIDDK under Grant No. 1U58DP002719 and the NIDDK Health Delivery Systems Center for Diabetes Translational Research (1P30-DK092924). The research protocol was approved by the Harvard Pilgrim Health Care institutional review board. We thank NEXT-D colleagues Kenrik Duru, MD MSHS (UCLA School of Medicine), Carol Mangione, MD, MSPH (UCLA School of Medicine), Jeanine Albu, MD (the Mount Sinai Hospital), Tannaz Moin, MD MBA MS (UCLA School of Medicine), and Ron Ackerman MD MPH (Northwestern University School of Medicine), for assistance with early development of an acute diabetes complication measure and valuable insights regarding approaches to construction. No compensation was provided for any persons listed above.
Footnotes
AUTHOR CONTRIBUTIONS:
Drs. Wharam, Ross-Degnan, and Zhang had full access to all the data in the study and take responsibility for the integrity of the data and the accuracy of the data analysis.
Study concept and design: All authors
Acquisition of data: Wharam, Ross-Degnan
Analysis and interpretation of the data: All authors
Drafting of the manuscript: Wharam
Critical revision of the manuscript for important intellectual content: All authors
Statistical analysis: Wharam, Zhang
Obtained funding: Wharam, Ross-Degnan
Administrative, technical, or material support: Wharam
Study supervision: Wharam, Ross-Degnan
CONFLICTS OF INTEREST/FINANCIAL DISCLOSURES:
The authors have no conflicts of interest or financial disclosures to report.
References
- 1.The Kaiser Family Foundation and Health Research & Educational Trust 2015 Annual Survey Employer Health Benefits. 2015 http://files.kff.org/attachment/summary-of-findings-2015-employer-health-benefits-survey. Accessed 24 September, 2015.
- 2.Lloyd-Jones D, Adams R, Carnethon M, et al. Heart disease and stroke statistics–2009 update: a report from the American Heart Association Statistics Committee and Stroke Statistics Subcommittee. Circulation. 2009;119(3):480–486. doi: 10.1161/CIRCULATIONAHA.108.191259. [DOI] [PubMed] [Google Scholar]
- 3.Hu FB, Stampfer MJ, Solomon CG, et al. The impact of diabetes mellitus on mortality from all causes and coronary heart disease in women: 20 years of follow-up. Arch Intern Med. 2001;161(14):1717–1723. doi: 10.1001/archinte.161.14.1717. [DOI] [PubMed] [Google Scholar]
- 4.Schreyogg J, Stargardt T, Tiemann O. Costs and quality of hospitals in different health care systems: a multi-level approach with propensity score matching. Health Econ. 2011;20(1):85–100. doi: 10.1002/hec.1568. [DOI] [PubMed] [Google Scholar]
- 5.Cook EF, Goldman L. Performance of tests of significance based on stratification by a multivariate confounder score or by a propensity score. Journal of clinical epidemiology. 1989;42(4):317–324. doi: 10.1016/0895-4356(89)90036-x. [DOI] [PubMed] [Google Scholar]
- 6.Reid RJ, Roos NP, MacWilliam L, Frohlich N, Black C. Assessing population health care need using a claims-based ACG morbidity measure: a validation analysis in the Province of Manitoba. Health Serv Res. 2002;37(5):1345–1364. doi: 10.1111/1475-6773.01029. [DOI] [PMC free article] [PubMed] [Google Scholar]
- 7.The Johns Hopkins ACG System. http://acg.jhsph.org/index.php/the-acg-system-advantage. Accessed 5 November, 2014.
- 8.St Clair T, Cook TD, Hallberg K. Examining the Internal Validity and Statistical Precision of the Comparative Interrupted Time Series Design by Comparison With a Randomized Experiment. American Journal of Evaluation. 2014;35(3):311–327. [Google Scholar]
- 9.Ryan AM, Burgess JF, Jr, Dimick JB. Why We Should Not Be Indifferent to Specification Choices for Difference-in-Differences. Health services research. 2015;50(4):1211–1235. doi: 10.1111/1475-6773.12270. [DOI] [PMC free article] [PubMed] [Google Scholar]
- 10.Wharam JF, Zhang F, Landon BE, Soumerai SB, Ross-Degnan D. Low-socioeconomic-status enrollees in high-deductible plans reduced high-severity emergency care. Health affairs. 2013;32(8):1398–1406. doi: 10.1377/hlthaff.2012.1426. [DOI] [PubMed] [Google Scholar]
- 11.Newhouse JP. Free for all? Lessons from the RAND Health Insurance Experiment. Cambridge: Harvard University Press; 1996. [Google Scholar]
- 12.IRS. Health Savings Accounts and Other Tax-favored Health Plans. Publication 969. 2011 http://www.irs.gov/pub/irs-pdf/p969.pdf. Accessed 22 January, 2012.
- 13.Fenton JJ, Von Korff M, Lin EH, Ciechanowski P, Young BA. Quality of preventive care for diabetes: effects of visit frequency and competing demands. Ann Fam Med. 2006;4(1):32–39. doi: 10.1370/afm.421. [DOI] [PMC free article] [PubMed] [Google Scholar]
- 14.NCQA. HEDIS® 2014: Healthcare Effectiveness Data and Information Set. 2014 http://www.ncqa.org/Portals/0/HEDISQM/HEDIS2014/List_of_HEDIS_2014_Measures.pdf. Accessed 16 July, 2014.
- 15.The Johns Hopkins ACG Case-Mix System Reference Manual, Version 7.0. Baltimore, MD: The Johns Hopkins University; 2005. [Google Scholar]
- 16.Krieger N. Overcoming the absence of socioeconomic data in medical records: validation and application of a census-based methodology. American Journal of Public Health. 1992;82(5):703–710. doi: 10.2105/ajph.82.5.703. [DOI] [PMC free article] [PubMed] [Google Scholar]
- 17.Krieger N, Chen JT, Waterman PD, Rehkopf DH, Subramanian SV. Race/ethnicity, gender, and monitoring socioeconomic gradients in health: a comparison of area-based socioeconomic measures–the public health disparities geocoding project. American Journal of Public Health. 2003;93(10):1655–1671. doi: 10.2105/ajph.93.10.1655. [DOI] [PMC free article] [PubMed] [Google Scholar]
- 18.U.S. Bureau of the Census. Geographical Areas Reference Manual. Washington, D.C.: U.S. Bureau of the Census; 1994. [Google Scholar]
- 19.Trivedi AN, Zaslavsky AM, Schneider EC, Ayanian JZ. Relationship between quality of care and racial disparities in Medicare health plans. Jama. 2006;296(16):1998–2004. doi: 10.1001/jama.296.16.1998. [DOI] [PubMed] [Google Scholar]
- 20.Trivedi AN, Rakowski W, Ayanian JZ. Effect of cost sharing on screening mammography in medicare health plans. The New England journal of medicine. 2008;358(4):375–383. doi: 10.1056/NEJMsa070929. [DOI] [PubMed] [Google Scholar]
- 21.Selby JV, Fireman BH, Swain BE. Effect of a copayment on use of the emergency department in a health maintenance organization. New England Journal of Medicine. 1996;334(10):635–641. doi: 10.1056/NEJM199603073341006. [DOI] [PubMed] [Google Scholar]
- 22.Ethnic Technologies. http://www.ethnictechnologies.com/index.html.
- 23.Fiscella K, Fremont AM. Use of geocoding and surname analysis to estimate race and ethnicity. Health services research. 2006;41(4 Pt 1):1482–1500. doi: 10.1111/j.1475-6773.2006.00551.x. [DOI] [PMC free article] [PubMed] [Google Scholar]
- 24.Corder GW, Foreman DI. Nonparametric statistics for non-statisticians : a step-by-step approach. Hoboken, N.J.: Wiley; 2009. [Google Scholar]
- 25.Wagner AK, Soumerai SB, Zhang F, Ross-Degnan D. Segmented regression analysis of interrupted time series studies in medication use research. Journal of clinical pharmacy and therapeutics. 2002;27(4):299–309. doi: 10.1046/j.1365-2710.2002.00430.x. [DOI] [PubMed] [Google Scholar]
- 26.Liang KY, Zeger SL. Longitudinal Data Analysis Using Generalized Linear Models. Biometrika. 1986;73(1):13–22. [Google Scholar]
- 27.Zeger SL, Liang KY. Longitudinal data analysis for discrete and continuous outcomes. Biometrics. 1986;42(1):121–130. [PubMed] [Google Scholar]
- 28.Haviland A, McDevitt R, Sood N, Marquis MS. How Do Consumer-Directed Health Plans Affect Vulnerable Populations? Forum for Health Economics & Policy. 2011;14(2) [Google Scholar]
- 29.Rowe JW, Brown-Stevenson T, Downey RL, Newhouse JP. The effect of consumer-directed health plans on the use of preventive and chronic illness services. Health affairs. 2008;27(1):113–120. doi: 10.1377/hlthaff.27.1.113. [DOI] [PubMed] [Google Scholar]
- 30.Reddy SR, Ross-Degnan D, Zaslavsky AM, Soumerai SB, Wharam JF. Impact of a high-deductible health plan on outpatient visits and associated diagnostic tests. Med Care. 2014;52(1):86–92. doi: 10.1097/MLR.0000000000000008. [DOI] [PMC free article] [PubMed] [Google Scholar]
- 31.Wharam JF, Graves AJ, Zhang F, Soumerai SB, Ross-Degnan D, Landon BE. Two-year trends in cancer screening among low socioeconomic status women in an HMO-based high-deductible health plan. J Gen Intern Med. 2012;27(9):1112–1119. doi: 10.1007/s11606-012-2057-x. [DOI] [PMC free article] [PubMed] [Google Scholar]
- 32.Wharam JF, Graves AJ, Landon BE, Zhang F, Soumerai SB, Ross-Degnan D. Two-year trends in colorectal cancer screening after switch to a high-deductible health plan. Med Care. 2011;49(9):865–871. doi: 10.1097/MLR.0b013e31821b35d8. [DOI] [PubMed] [Google Scholar]
- 33.Reiss SK, Ross-Degnan D, Zhang F, Soumerai SB, Zaslavsky AM, Wharam JF. Effect of switching to a high-deductible health plan on use of chronic medications. Health Serv Res. 2011;46(5):1382–1401. doi: 10.1111/j.1475-6773.2011.01252.x. [DOI] [PMC free article] [PubMed] [Google Scholar]
- 34.Wharam JF, Ross-Degnan D, Rosenthal MB. The ACA and high-deductible insurance–strategies for sharpening a blunt instrument. New England Journal of Medicine. 2013;369(16):1481–1484. doi: 10.1056/NEJMp1309490. [DOI] [PubMed] [Google Scholar]
Associated Data
This section collects any data citations, data availability statements, or supplementary materials included in this article.