Abstract
To meet energy demands, dorsal root ganglion (DRG) neurons harbor high mitochondrial content, which renders them acutely vulnerable to disruptions of energy homeostasis. While neurons typically rely on mitochondrial energy production and have not been associated with metabolic plasticity, new studies reveal that meclizine, a drug, recently linked to modulations of energy metabolism, protects neurons from insults that disrupt energy homeostasis. We show that meclizine rapidly enhances glycolysis in DRG neurons and that glycolytic metabolism is indispensable for meclizine-exerted protection of DRG neurons from hypoxic stress. We report that supplementation of meclizine during hypoxic exposure prevents ATP depletion, preserves NADPH and glutathione stores, curbs reactive oxygen species (ROS) and attenuates mitochondrial clustering in DRG neurites. Using extracellular flux analyzer, we show that in cultured DRG neurons meclizine mitigates hypoxia-induced loss of mitochondrial respiratory capacity. Respiratory capacity is a measure of mitochondrial fitness and cell ability to meet fluctuating energy demands and therefore, a key determinant of cellular fate. While meclizine is an ‘old’ drug with long record of clinical use, its ability to modulate energy metabolism has been uncovered only recently. Our findings documenting neuroprotection by meclizine in a setting of hypoxic stress reveal previously unappreciated metabolic plasticity of DRG neurons as well as potential for pharmacological harnessing of the newly discovered metabolic plasticity for protection of peripheral nervous system under mitochondria compromising conditions.
Keywords: ATP, Dorsal root ganglion neuron, glutathione, glycolytic metabolism, hypoxia, meclizine, mitochondrial respiration, reactive oxygen species
Graphical Abstract
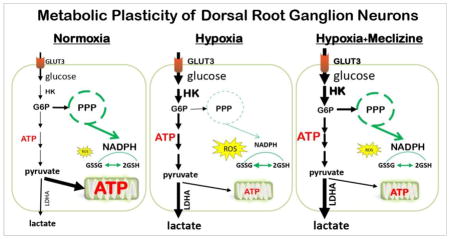
INTRODUCTION
Mammalian cells differ in their oxygen consumption, energy production and energy demands. Energy production occurs largely in mitochondria, which are also the main source of ROS that can be injurious under normal and more so under compromised conditions [1]. Neurons typically respond to changing energy demands by increasing oxygen consumption and elevating mitochondrial oxidative phosphorylation (OXPHOS) which is associated with increases in ROS generation [2–4]. In the peripheral nervous system (PNS) dorsal root ganglion (DRG) neurons, ROS is amplified by the high mitochondrial content and can be further increased by disruption of energy homeostasis [5, 6]. This raises the question whether under compromised conditions metabolic reprogramming might constitute a mechanism for shielding neurons from mitochondria initiated injury and dysfunction. In support of such scenario, brain region-specific capacity for differential usage of energy substrates under stress has been described [7–9] and while metabolic plasticity has not been generally associated with nerve cells, recent report challenges this premise demonstrating that sensory neurons have the capability to use non-OXPHOS energy for axonal transport [10]. Interestingly, large screen for drugs capable of shifting energy metabolism away from mitochondrial respiration identified the ‘old’ antiemetic drug, meclizine [11]. Meclizine, a histamine H1 type antagonist, which previously has not been linked with energy metabolism proved neuroprotective in mouse model of ischemia and reperfusion [11], models of Huntington’s Disease (HD) [12] and most recently in models of Parkinson Disease (PD) [13]. This recent study expands the scope of previously proposed mechanisms of protection by meclizine [12, 14–16], demonstrating that in PD models meclizine confers neuroprotection by enhancing glycolysis without altering OXPHOS [13]. To test the premise that meclizine could be neuroprotective also in the PNS where compromised oxygen supply contributes to pathophysiology of various disease conditions [17–19], we investigated effects of meclizine supplementation in the course of hypoxic exposure of cultured DRG neurons. Cellular endpoints that were adversely affected by hypoxia in this sub-lethal model, include mitochondrial respiratory parameters as assayed by the Seahorse XF24 extracellular flux analyzer [20–24], ATP content, ROS formation [25], NADP+/NADPH ratios, glutathione stores [26] and morphology of DRG neurons.
Since meclizine was reported to have ability to modulate energy metabolism [11, 13], we hypothesized that under hypoxic conditions, meclizine could stimulate glycolytic metabolism and ATP production, help maintain redox balance and curb ROS levels. Lower ROS is predicted to limit mitochondrial compromise and thereby sustain DRG neurons ability to resume OXPHOS and cellular functions after hypoxic challenge. We report that meclizine supplementation during hypoxic exposure of cultured DRG neurons, enhanced glycolysis, attenuated ATP depletion, reduced ROS levels and alleviated in dose-dependent manner the post-hypoxia decline of mitochondrial respiratory capacity.
METHODS
Isolation, culture and treatments of mouse DRG neurons and astrocytes
The mouse-handling procedure was approved by the University of Texas Medical Branch Institutional Animal Care and Use Committee. Dorsal root ganglion neurons were isolated from 3–4-month-old male C57BL/6 mice (Harlan Laboratories, USA) as described [27–30] with some modifications. Briefly, ganglia from all spinal levels were removed, placed in ice-cold dissecting solution (130 mM NaCl, 5 mM KCl, 2 mM KH2PO4, 1.5 mM CaCl2, 6 mM MgCl2, 10 mM glucose and 10 mM Hepes, pH 7.2) and connective tissue was trimmed. Ganglia were incubated for 1 h at 37°C with collagenase type A (Roche) and trypsin, washed, incubated with DNase I (Roche), dissociated by 20 gentle triturations and spun at 168 g for 3 min to pellet ganglia. Pellets were washed with DPBS, passed through 70 μm strainer, spun and re-suspended in DMEM/F12 (Sigma) supplemented with 10% FBS (Life Technologies), 10 ng/ml nerve growth factor (Sigma) and penicillin/streptomycin. Neurons were seeded in pre-coated (10 μg/ml laminin and 100 μg/ml poly-L-ornithine, Sigma) 96- or 6-well plates or on glass coverslips at (3–4)×104 and (3–4)×103/cm2, respectively. Treatments were initiated at 24–30 h post seeding when neurons have had established adequate neurite network; cultures were maintained for 48 h prior to assaying. Meclizine dihydrochloride (#4245 R&D, Minneapolis, MN) stock solution was made 10 mM in dimethyl sulfoxide and stored in aliquots at −20°C. From pilot experiments in DRG cultures, 30 μM meclizine was found adequate in short treatments (2.5 h) and 15 μM was sufficient in long treatments (16 h); DMSO was added to control cultures at matching concentrations. Hypoxic exposures of DRG cultures were done using established protocols [25, 31]; airtight modular incubator chamber (MIC-101, Billups Rothenberg, Del Mar, CA) was fitted with water vessel to maintain humidity and dual flow meter (DFM-3002, Billups-Rothenberg, Inc. Del Mar, CA) was used to achieve desired gas flow rate. DRG cultures were placed in chamber and air was purged with 5% CO2/95% nitrogen at a flow rate of 20 l/min for 3 min to achieve 1.5 ± 0.2% O2 (measured by oxygen pen 800047, Sper Scientific, Scottsdale, AZ). This treatment did not increase significantly cell death monitored by lactate dehydrogenase release and trypan blue uptake. Astrocytes were isolated from cortices of 1–3 day old pups (C57BL/6) according to published protocols [32, 33]. Cortices were mechanically dissociated in cold PBS/0.05% trypsin and incubated 25 min/37°C prior to addition of DNase I. After gentle trituration preps were washed with DMEM, passed through 70 μm mesh and cells collected by 6 min spin at 250 g. Cells were seeded in poly-D-lysine pre-coated dishes and grown in DMEM with 10% FBS and penicillin/streptomycin. At ~ 90%, confluence cells were split 1:2 and cultured to 90% confluence prior to re-seeding (P2) in XF24 plates for XF24 assays. Parallel cultures were seeded on cover slips for characterization by glial fibrillary acidic protein immunofluorescence.
Measurement of oxygen consumption and extracellular acidification rates in DRG cultures
Seahorse XF24 extracellular flux analyzer (Seahorse Bioscience, North Billerica, MA) was used to measure oxygen consumption and extracellular acidification rates (OCR/ECAR) using established protocols [20–22] and as we described [23, 34]. DRG neurons seeded in XF24 plates ([1–1.3] ×104/well) were cultured as described above. Prior to XF24 measurements medium was replaced with un-buffered Dulbecco’s Modified Eagle’s medium (Sigma, D5030) supplemented with 5 mM pyruvate/15 mM glucose/2 mM Glutamax (reagents were adjusted to pH 7.4) and equilibrated in CO2 free incubator at 37°C prior to assaying. All XF24 assays were carried out under normoxic conditions after the completion of indicated treatments. Assay protocols were implemented by XF24 analyzer software and measurements were recorded at 5-min intervals for all segments of assay. Sequential additions of mitochondrial effectors were through ports of XF24 cartridges; concentrations of effectors were optimized for DRG neurons to 2 μM oligomycin (O4876, Sigma), 2 μM carbonyl cyanide p-trifluoromethoxyphenylhydrazone (FCCP), (C2920, Sigma) and 1.8 μM antimycin A (A8674, Sigma). Changes in OCR and ECAR in response to additions of effectors served to compare mitochondrial parameters between control and test groups [20, 21]. Baseline OCR was calculated by subtraction of non-mitochondrial OCR, ie, the portion retained after addition of antimycin A. All values calculated for control cultures, ie, baseline OCR, OCR coupled to ATP synthesis, (which is revealed after the addition of oligomycin) and spare respiratory capacity (SRC), which is the difference between maximal and baseline OCR, were each assigned the value of 100%. Effects of treatments were calculated as percent change relative to each respective control.
Real-time quantitative PCR
Total RNA was isolated from 3×10⁴ DRG neurons using RNeasy plus mini kit (Qiagen) and reverse transcribed with iScript RT supermix (Biorad) which contains random and oligo dT primers. Real-time PCR was done with CFX96 Real-Time System (Biorad). 18s and B2M gene transcripts were used as internal controls. PCR reactions were assembled in duplicates with SSO FAST Evagreen supermix (Biorad). PCR program was: 95°C 2 min, 40 cycles of 95°C 5 sec, 55°C 15 sec. Data represent averages of 6 independent experiments. The relative amount of target gene was calculated as described [35] using the formula: -ΔΔCt=*(CT gene of interest - CT internal control) sample - (CT gene of interest - CT internal control) control]. Primer sequences are given in Supplementary Table 1.
Measurement of intracellular ATP
ATP Bioluminescence Assay Kit HS II (11699709001, Roche) was used to measure intracellular ATP content. DRG neurons were seeded in 96-well plates (104/well). After treatment, DRGs were trypsinized (0.125% trypsin), neutralized, collected, washed, re-suspended and each sample divided into two aliquots. One aliquot was used for protein measurements using Bradford reagent (Biorad). Second aliquot was transferred to black-wall 96-well plates for ATP determination using manufacturer’s protocol. Briefly, DRGs were lysed with lysis reagent followed by the addition of an equal amount (25 μl) dilution buffer. Freshly prepared luciferase reagent was added and luminescence measured immediately using TECAN F200 Pro plate Reader (TECAN, San Jose, CA). ATP concentrations were calculated from a log-log plot of the standard curve, normalized to protein amounts and expressed as nmol/mg protein.
Measurement of lactate and glucose in culture medium
Lactate in medium was determined using lactate assay kit (L-lactate kit #1200014002, Eton Bio, San Diego, CA) as described [36]. Medium was collected, debris removed by 10,000 g/2 min spin, supernatant diluted 1:10 and 50 μl samples loaded into 96-well plates, mixed with 50 μl lactate assay reagent for 30 min/37°C prior to reaction termination with 50 μl 0.5 M acetate. O.D. was measured at 450 nm with TECAN FL200. Lactate concentrations were calculated from standard curve. For detection of low lactate concentrations after short duration experiments that parallel XF24 assays (2.5 h), the protocol was modified by replacing regular culture medium with DMEM without phenol red (Sigma D5030) supplemented with 5 mM pyruvate/15 mM glucose/2 mM Glutamax as used in XF24 assays. Glucose in medium was measured with K606-100 kit (Biovision, Milpitas, CA) using manufacturer’s protocol. Briefly, medium was collected, debris removed (10,000 g/2 min), supernatant diluted 1:10 and 5μl aliquots used for glucose detection. Absorbance at 590 nm was measured using TECAN FL200 and glucose concentrations were calculated from standard curve.
Immunofluorescence
DRG neurons were seeded on pre-coated coverslips and processed as we described [23, 34]. Coverslips were washed 2× with PBS, fixed in 4% paraformaldehyde, rinsed, permeabilized with 0.1% Triton X-100/0.1% sodium citrate in PBS for 9 min and blocked in PBS with 3% BSA (w/v)/1% Donkey serum (v/v) for 40 min/37°C. Primary antibodies were: rabbit anti-Neurofilament 200 (1:20000, Sigma-N4142) and mouse anti-COX I (1:1500, Millipore-459606). After primary antibodies, coverslips were washed 3× in 1% BSA in PBS and incubated 45 min in the dark with 488 and 594 Alexa-dye conjugated anti-mouse and anti-rabbit IgG (Life Technologies). Coverslips were mounted with Prolong® Gold Anti-fade with DAPI (Life Technologies) and viewed/captured with 40× objective using Olympus IX71 fitted with QIC-F-M-12-C cooled camera (QImaging, Surrey, BC) and QCapture Pro (QImaging) software.
In situ imaging of superoxide mediated dihydroethidium oxidation
Superoxide mediated oxidation of dihydroethidium (#D23107, Invitrogen) to 2-hydroxyethidium was assessed in live DRG neurons [37, 38] and as we previously described [39]. DRG neurons were cultured on glass coverslips, after termination of treatments cultures were supplemented with 100 nM dihydroethidium for 20 min incubation in the dark. Incubation was stopped by quick washes with PBS. Cultures were observed with Olympus IX71fluorescence microscope and images captured sequentially with QIC-F-M-12-C cooled digital camera with the QCapture Pro software. Fluorescence intensity normalized to surface area of the individual DRG neurons demarcated by circular boundaries was scored using ImageJ software (NIH) and exported to Excel for determination of mean intensity and further analysis. At least 20 individual DRG neurons obtained in 3 independent biological experiments were scored for each test condition. For calibration purposes, decreases in ROS exerted by different doses of N-acetyl-L-cysteine (NAC) were also imaged (supplementary Figure 1).
Measurement of NADP+/NADPH ratio
Ratios of intracellular NADP+/NADPH were determined using NADP/NADPH-Glo™ kit (#G9081, Promega) and manufacturer’s protocol. DRGs were seeded at 104/well in 96-well plates. After treatment, DRGs were lysed in NADP+ or in NADPH lysis buffer at 60°C/15 min. Lysates were neutralized, spun at 13,000 g/2 min to remove debris. Supernatants were loaded into white wall 96-well plate, mixed with detection reagent and incubated at 22°C/30 min in the dark. Luminescence was read on TECAN FL200 plate reader. NADP+/NADPH concentrations were calculated from standard curves (Magellan™ software, TECAN, San Jose, CA).
Measurement of intracellular thiols levels and GSH/GSSG ratios
Assessment of reduced intracellular glutathione (GSH) levels was with Thioltracker Violet (Life Technologies) cell-permeant thiol-reactive fluorescent probe as described [40, 41]. DRG neurons were seeded in black wall 96-well plates (104/well). After treatments cultures were washed with PBS and freshly prepared 10 μM Thioltracker Violet in DPBS was added for 30 min/37°C in the dark. Following 2 washes with PBS, residual fluorescence was measured using the FL200 Tecan (excitation at 415 nm/emission 530 nm). Measurements of total and reduced glutathione levels were carried out using the GSH/GSSG-Glo luminescence based kit (V6611, Promega™) following the manufacturer’s guide using 96-well white wall-plate format and TECAN FL200 plate reader.
Statistical analysis
Data are given as mean ± SEM obtained from at least 3 independent biological experiments, as indicated. One way ANOVA was employed to compare the means among groups followed by post-test Tukey’s analysis to determine differences in means of multiple groups. P<0.05 was considered statistically significant. MegaStat® package for Excel was used.
RESULTS
Meclizine Reveals Metabolic Plasticity of Dorsal Root Ganglion Neurons
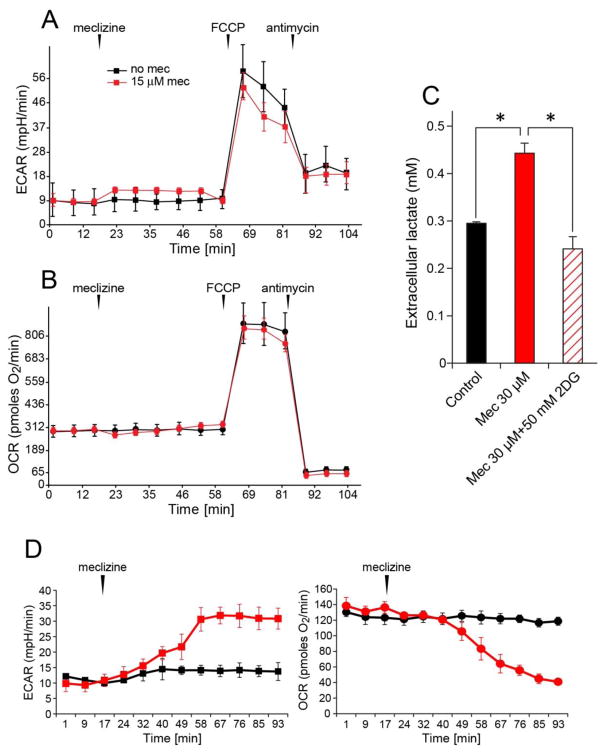
Extracellular acidification rates (ECAR) and oxygen consumption rates (OCR) report respective contributions of glycolytic energy metabolism and of mitochondrial respiration/oxidative phosphorylation to cellular ATP production [20]. To determine whether meclizine stimulates glycolytic metabolism in cultured DRG neurons, changes in ECAR were assessed using the XF24 extracellular analyzer. ‘In-port’ addition of meclizine induced instantaneous 40% increase in ECAR [Fig 1A, red], with no concomitant change in OCR [Fig 1B, red]. This indicates that within the monitored timeframe, meclizine affects glycolytic metabolism without altering mitochondrial respiration. Moreover, no differential modifications of ECAR/OCR responses to subsequent additions of the protonophore FCCP and the respiratory complex lll inhibitor, antimycin A were observed. ECAR response to FCCP reflects both, lactate production as well as generation of CO2, which is incidental to mitochondrial substrate oxidation and hence is eliminated by antimycin A [42]. Here, antimycin A, partially abolished the FCCP-induced ECAR response, reflecting elimination of mitochondrial but not cytosolic contribution to ECAR [Fig 1A, red]. The contribution of lactate release to ECAR, examined by independent measurements of extracellular lactate after 2.5 h incubation of DRG neurons +/− meclizine (timeframe matching XF24 assays), revealed ~50% increase in lactate concentration by meclizine [Fig 1C]. This increase was abrogated by simultaneous supplementation of 2-deoxyglucose (2DG), a competitive inhibitor of hexokinase, the first enzyme of the glycolytic pathway, supporting the involvement of glycolytic metabolism in meclizine exerted effects on DRG neurons. In agreement with previous studies [11, 13, 16] suggesting that targets of meclizine may differ in cell type, dose and time dependent manner, we found that meclizine effects in DRG neurons differ from its effects in primary astrocytes [Fig 1D]. In astrocytes we observed meclizine-induced substantial gradual increase in ECAR and decrease in OCR, which in combination may reflect the well documented substantial glycolytic capacity of astrocytes [43] and their ability to divert energy production away from OXPHOS.
Fig 1. Meclizine stimulates glycolytic metabolism in DRG neurons.
ECAR and lactate release are elevated by meclizine. Following ‘in-port’ addition of 30 μM meclizine, baseline ECAR was elevated by ~40% (A, red) with no change in OCR (B, red). Meclizine did not affect ECAR or OCR responses to mitochondrial effectors, FCCP and antimycin A. ECAR response to FCCP was partially abolished by the addition of antimycin A, reflecting elimination of the portion of extracellular acidification contributed by mitochondrial production of CO2. (C) Graph shows ~50% increase in extracellular lactate 2.5 h after meclizine supplementation; simultaneous addition of 15 mM 2DG abolished the increase (diagonal lines). Data are presented as mean±SEM for 4 independent experiments. *indicates different from control and from 2DG; P<0.05. (D) Meclizine stimulates ECAR and suppresses OCR in primary astrocytes. After ‘in-port’ addition of 30 μM meclizine, ECAR and OCR are modified reaching a 3-fold increase and 50% decrease, respectively.
Meclizine does not stimulate expression of glycolytic genes under normoxic conditions
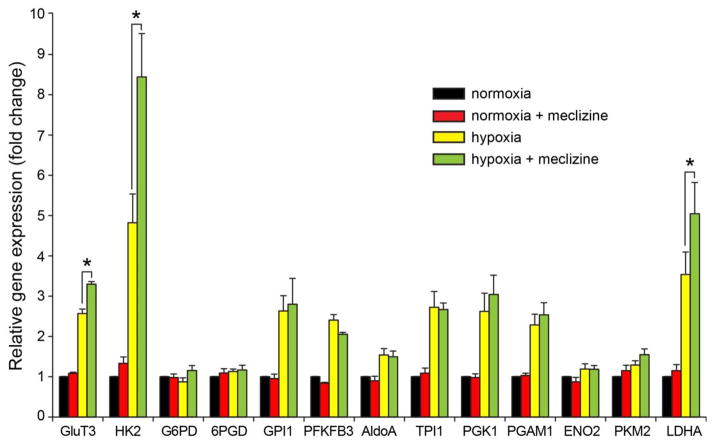
To examine potential involvement of meclizine in transcriptional regulation of glycolytic genes, DRGs were subjected to 16 h incubation under normoxic and hypoxic conditions with/without meclizine. Under normoxic conditions meclizine had no effect on expression of glycolytic genes [Fig 2, red] nor on the expression of a broad array of genes representing diverse cellular functions (Supplementary Figure 2), suggesting in agreement with previous reports [11] that primary effects of meclizine are not exerted at transcriptional level. Real-Time PCR analyses revealed hypoxic upregulation of 9 out of 13 genes encoding proteins of the glycolytic pathway [Fig 2]. Among these, expression of 3 genes central to neuronal adaptive responses to hypoxia, glucose transporter 3 (GLUT3), hexokinase 2 (HK2) and lactate dehydrogenase A (LDHA), was further upregulated in the presence of meclizine, suggesting that in DRGs meclizine might contribute to hypoxic adaptation indirectly, via augmentation of glycolytic gene expression.
Fig 2. Hypoxia-induced glycolytic genes expression is augmented by meclizine.
Expression of 9 of 13 glycolytic genes was elevated by hypoxic exposure of DRG neurons. Among these, Glut3, HK2 and LDHA expression was augmented by meclizine supplementation in the course of hypoxia. Expression of glycolytic genes was unaffected by meclizine under normoxic conditions. Values from 6 independent experiments were used to obtain mean±SEM. *P<0.05 indicates different from hypoxia.
Meclizine enhances glucose consumption and lactate release in normoxia and hypoxia
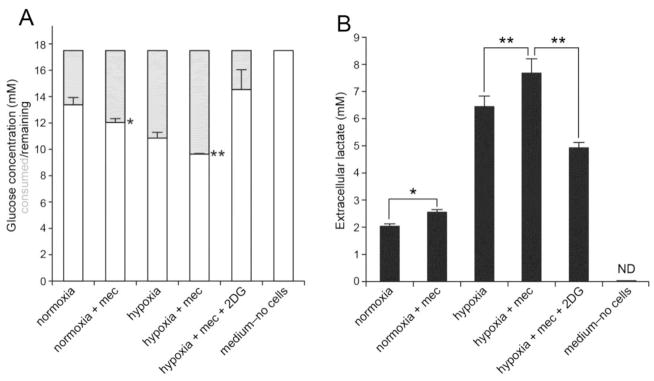
To further characterize the involvement of meclizine in modulation of glycolytic metabolism, its effects on glucose consumption and lactate release were examined in DRG cultures incubated under normoxic and hypoxic conditions [Fig 3]. Greater consumption of glucose was measured in DRG cultures supplemented with meclizine in the course of 16 h under either normoxic or hypoxic conditions [Fig 3A]. Parallel measurements revealed also greater increases in extracellular lactate accumulation in the presence of meclizine under normoxic or hypoxic conditions [Fig 3B]. Importantly, 16 h hypoxia alone increased extracellular lactate levels nearly 3.5-fold revealing robust glycolytic capacity of DRG neurons. Simultaneous addition of 2DG, the inhibitor of glycolytic pathway, abrogated the effects of meclizine.
Fig 3. Glucose consumption and lactate release are elevated by meclizine under normoxic and hypoxic conditions.
(A) Meclizine increases glucose consumption in DRG cultures. Following incubation under normoxic or hypoxic conditions, glucose concentration in medium is depleted to a greater extent in cultures supplemented with meclizine. (B) Extracellular lactate levels are elevated by meclizine under normoxic or hypoxic conditions. Simultaneous addition of 2DG abrogates meclizine effects. Data are presented as mean±SEM for 4 independent experiments. *indicates different from normoxia; ** indicates different from hypoxia; P<0.05.
Meclizine enhances the pentose phosphate branch of glycolytic metabolism
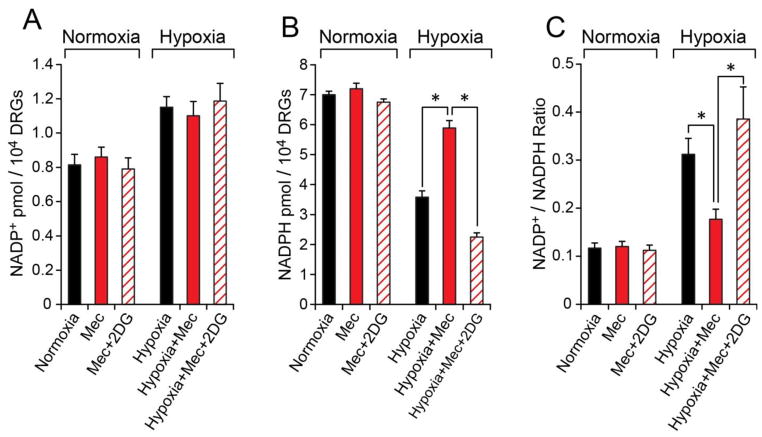
To determine whether meclizine augmentation of glycolytic metabolism affects the pentose phosphate branch of glycolysis, products of the oxidative phase of pentose phosphate pathway (PPP) were measured under normoxic and hypoxic conditions [Fig 4]. Hypoxia decreased NADPH levels by 50%, indicative of depletion of reducing equivalents and diminished antioxidant capacity in DRG neurons under hypoxic conditions. When DRG cultures were supplemented with meclizine in the course of hypoxia, NADPH was maintained at near normoxic levels. Preservation of favorable NADP+/NADPH ratio (0.18 versus 0.32) by meclizine during hypoxia indicates that meclizine helps sustain redox balance under hypoxic conditions. Preservation of NADP+/NADPH ratio by meclizine in hypoxia was completely abrogated by supplementation of 2DG [Fig 4].
Fig 4. During hypoxia, meclizine preserves NADPH levels via glycolytic metabolism.
Hypoxia increases NADP+ (A) and decreases NADPH (B) in DRG neurons. NADP+/NADPH ratio (C) which increases 3-fold in hypoxia is maintained at near normoxic value in the presence of meclizine. Concomitant addition of 2DG (diagonal lines) abrogates this effect. Values are given as mean±SEM for 4 independent experiments; *indicates difference between hypoxia −/+ meclizine or between hypoxia with meclizine in the presence of 2DG; P< 0.05.
Meclizine preserves reduced glutathione levels and lessens ROS in hypoxic DRG neurons
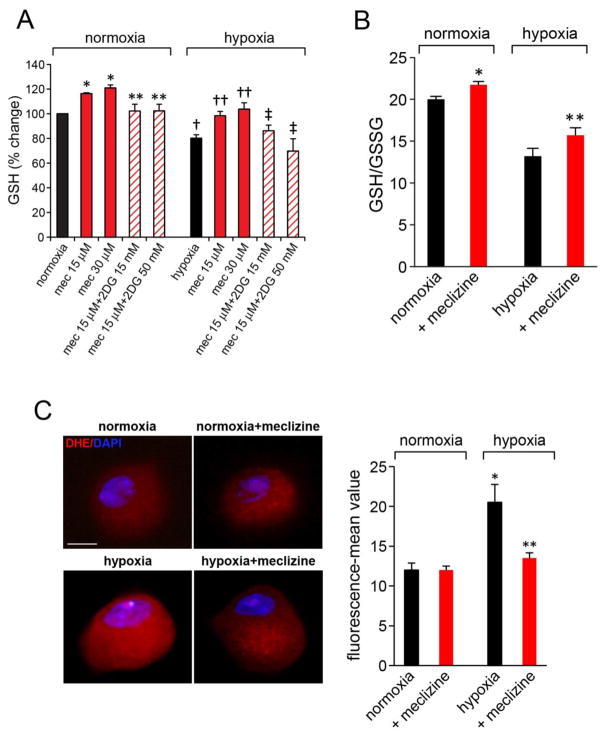
In support of PPP involvement in protection of DRGs by meclizine, a downstream NADPH utilizing glutathione cofactor system was examined. Levels of reduced glutathione assessed by quantitation of intracellular thiol groups revealed meclizine-induced increases in reduced glutathione stores and lessening of their depletion in the course of hypoxic exposure; as expected, preservation of reduced glutathione stores by meclizine was abrogated by 2DG [Fig 5A]. These results were substantiated by independent luminescence based measurements of total and reduced glutathione [Fig 5B]. The calculated ratios of reduced/oxidized glutathione (GSH/GSSG) revealed unfavorable shift by hypoxia and partial restoration of GSH/GSSG balance by meclizine. Augmentation of GSH/GSSG ratios under hypoxic conditions supports antioxidant defenses and redox balance and contributes to preservation of mitochondrial function. To determine whether these meclizine mediated changes improve ROS control in DRG neurons, ROS levels after hypoxic exposure were assessed by imaging in situ fluorescence of superoxide-mediated oxidation of dihydroethidium to 2-hydroxyethidium [Fig 5C] as we described [39]. Marked increases in dihydroethidium oxidation, indicative of elevated ROS were observed in DRG neurons subjected to hypoxia, while meclizine supplementation, reduced fluorescence intensity reflective of reduced ROS (fluorescence intensity was quantified by ImageJ, Fig 5C).
Fig 5. Meclizine prevents depletion of reduced glutathione (GSH) stores and attenuates ROS formation in hypoxic DRG neurons.
(A) GSH levels were assessed by fluorescent dye-mediated detection of thiol groups. GSH increases by meclizine in hypoxia and normoxia were abrogated by 2DG (diagonal lines). Values are given as mean±SEM of 4 independent experiments; P< 0.05; *indicates different from normoxia; ** different from meclizine in normoxia; †indicates different from normoxia; ††different from hypoxia; ‡different from hypoxia+meclizine. (B) Hypoxia induced decreases in GSH/GSSG ratios in DRG neurons are partially reversed by meclizine supplementation. Data are mean±SEM of 3 experiments; P< 0.05; *indicates different from normoxia; ** different from hypoxia. (C) ROS levels in normoxic and hypoxic DRG neurons with/out meclizine were compared by imaging fluorescence of superoxide-mediated oxidation of dihydroethidium to 2-hydroxyethidium(red). Fluorescence intensity normalized to cell surface area quantified by ImageJ is presented as mean±SEM intensity for 3 sets of experiments; in each experiment, 5–8 DRG neurons were scored for each condition (total 20 ≥ for each condition; scale bar=10 μm). Meclizine significantly attenuated hypoxia-induced fluorescence; *indicates different from normoxia, ** different from hypoxia without meclizine supplementation; P<0.05.
Hypoxia-induced loss of mitochondrial respiratory capacity is ameliorated by meclizine
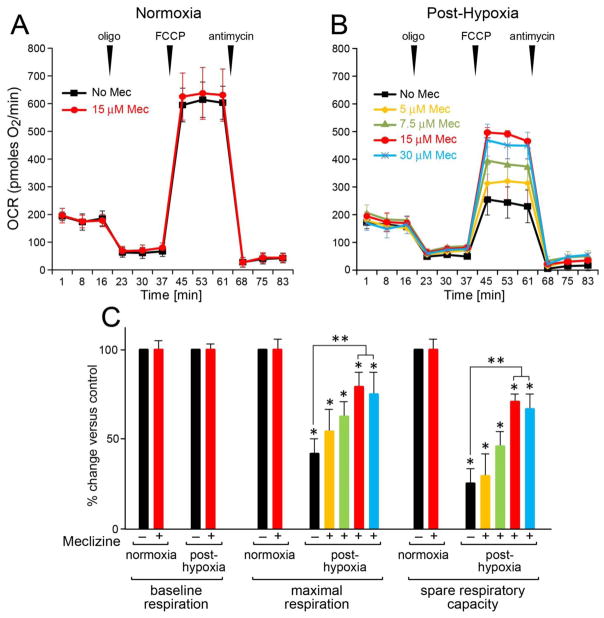
To determine whether mitochondrial injury by hypoxic stress is mitigated by meclizine, the signature of hypoxia on mitochondrial function was probed by monitoring OCR after hypoxic exposure of DRG neurons [Fig 6A]. The objective was to characterize the signature of hypoxic challenge on post-hypoxia restoration of mitochondrial function in DRG neurons. After 16 h incubation under normoxic or hypoxic conditions with/without meclizine, readings revealed robust baseline OCR of ~200 pmoles O2/min. An addition of oligomycin showed that under normoxic conditions 62% of baseline OCR is coupled with ATP synthesis, versus 28% fueling the proton leak and 10% supporting non-mitochondrial oxygen consumption. The addition of the protonophore FCCP revealed maximal oxygen consumption and robust spare respiratory capacity (SRC) at 250% above baseline OCR. In normoxia, respiratory parameters were not altered by meclizine [Fig 6A], consistent with a recent report [13]. The impact of meclizine on DRGs’ ability to withstand hypoxic conditions was assessed after 16 h hypoxia with/without meclizine supplementation. After termination of treatments, XF24 assays (carried out at ambient air) revealed that while after-16 h hypoxia DRGs resume baseline OCR, their maximal respiration and spare respiratory capacity (SRC) are reduced by 55% and 75%, respectively [Fig 6B & 6C]. Reduced respiratory capacity after hypoxia is indicative of impaired ability of DRGs to utilize their full OXPHOS potential to meet impending energy demands, indicative of mitochondrial dysfunction. Post hypoxia-loss of SRC was attenuated by meclizine; SRC was reduced by only ~30% versus ~75% reduction in its absence [Fig 6C]. Meclizine-mediated preservation of SRC in the aftermath of hypoxia showed meclizine dose-dependent trend up to 15 μM with no further improvement with dose increase.
Fig 6. Meclizine supplementation attenuates hypoxia-induced mitochondrial compromise in DRG neurons.
Assays are done after termination of all indicated treatments. Respiratory parameters were analyzed by XF24 following DRGs incubation under normoxic (A) and hypoxic conditions (B). In normoxia respiratory parameters were unaffected by meclizine (A). After hypoxia (B), a 55% decrease in maximal respiration (black) and 75% decrease in SRC were measured. Decreases were attenuated by meclizine supplementation during exposure. Maximal benefit was with 15 μM (red), with no additional benefit by 30 μM (blue). (C) Relative changes in respiratory parameters following hypoxia +/− meclizine are presented as mean±SEM of three independent experiments; *indicates different from normoxia; **indicates different from hypoxia without meclizine; P<0.05.
Glycolysis is indispensable for meclizine-mediated prevention of ATP depletion in hypoxic DRG neurons
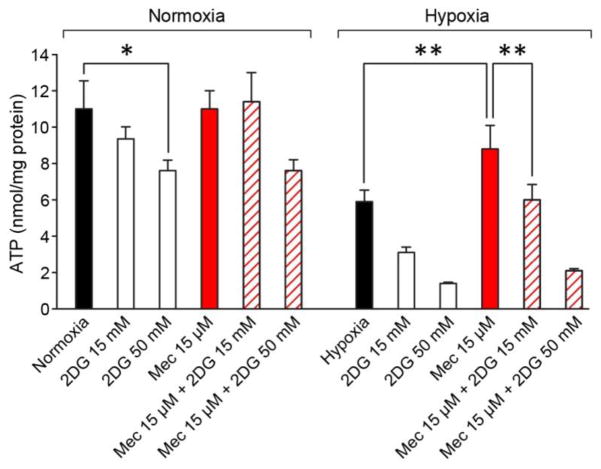
Consistently with OCR being unaltered by meclizine under normoxic conditions [Fig 6A], meclizine had no effect on ATP content in normoxia [Fig 7]. An addition of 50 mM 2DG with/without meclizine reduced the ATP content by ~25% suggesting that even under normoxic conditions DRG neurons derive some ATP from glycolytic metabolism. Following 16 h hypoxia, ATP content was reduced by ~50%. ATP depletion by hypoxia was partially prevented when meclizine was present during hypoxic exposure. This ameliorative effect was abrogated by 2DG supplementation [Fig 7], underscoring involvement of glycolysis in meclizine-augmented ATP production in hypoxic DRG neurons.
Fig 7. Glycolysis is indispensable for meclizine-mediated prevention of ATP depletion by hypoxia.
In normoxia ATP, content is not altered by meclizine (red), but is reduced by ~25% by 50 mM 2DG. Following hypoxia ATP content decreases by ~50%. Meclizine supplementation partially prevents ATP decrease (red), but the effect is abrogated by simultaneous addition of 2DG. ATP amounts are expressed in nmol/mg protein and presented as mean±SEM of six independent experiments; *indicates different from normoxia; **indicates different from hypoxia +/− 2DG; P<0.05.
Meclizine attenuates mitochondrial clustering in neurites of hypoxic DRG neurons
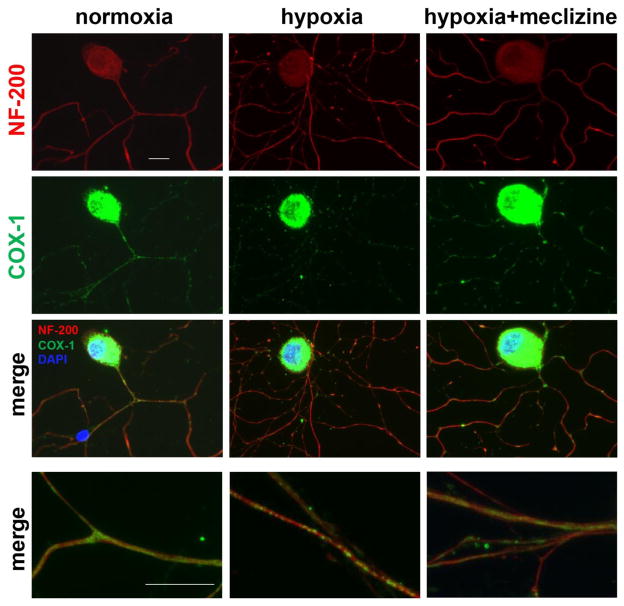
In line with improved energy homeostasis in hypoxic DRG neurons, meclizine also diminished the hypoxia-induced mitochondrial clustering and attenuated concomitant impairments of neurite morphology [Fig 8]. Hypoxia-triggered clustering of mitochondria in neurites was visualized by immunoreactivity of the abundant mitochondrial protein, cytochrome c oxidase subunit 1 (COX-1) [green], while DRG cell bodies and neurites were visualized with DRG-specific cytoskeleton neurofilament 200 (NF-200) reacting antibody [red]. Immunofluorescence of COX-1 in cell bodies was overexposed to enable visualization of mitochondria in neurites, where they are present at a lower density. Supplementation of meclizine diminished mitochondrial clustering and improved neurite morphology, consistently with the notion that meclizine protects DRGs by preserving ATP content and mitigating ROS, thereby lessening mitochondrial compromise under hypoxic conditions.
Fig 8. Meclizine attenuates hypoxia-induced mitochondrial clustering and compromise of DRG neurites morphology.
Mitochondrial distribution is observed by immunofluorescence (IF) of cytochrome c oxidase subunit 1 (COX-1, green) while cell bodies and neurites are visualized by IF of neurofilament 200 (NF-200, red). Intense COX-1 IF in cell bodies reflects high mitochondrial content; overexposing COX-1 enabled visualization of the less dense mitochondria in neurites. Mostly uniform distribution was observed in neurites in normoxia [left]. Following hypoxia, COX-1 IF showed mitochondrial clustering. In cultures supplemented with meclizine [right], clustering and neurite fragmentation were reduced. Merged images of segments of neurites are shown at higher magnification (bottom panel) scale bar=10 μm.
DISCUSSION
Metabolic plasticity facilitates cellular responses to changing energy demands [44–49]. Examples include cancer cells, which differentially utilize glycolytic and mitochondrial energy generating pathways to adapt to various microenvironments [24, 50–52] and the immune system cells, which rely on metabolic plasticity to execute different phases of the immune response [53–55]. In contrast, the intensely metabolic long lived nerve cells always maintain high mitochondrial content and rely primarily on oxidative phosphorylation for energy production [56, 57]. Insults that disrupt mitochondrial respiration have been linked with neuronal dysfunction and initiation of neurodegenerative processes [2]. Notwithstanding, while nerve cells have not been typically associated with metabolic plasticity, differential utilization of energy substrates has been described [8, 58]. Recent reports provide evidence for increases in cerebral metabolism associated with enrichment in hexokinase, an enzyme which catalyzes the first step of glycolytic pathway [9], evidence for activity-dependent glucose phosphorylation in neurons [59] as well as evidence for glycolytic enzymes clustering next to synapses in response to disrupted energy homeostasis [7]. Hence, emerging data suggest that neuronal glycolysis may play a greater role in sustenance of neuronal energy metabolism than previously appreciated. Similarly, work in the peripheral nervous system (PNS), demonstrated that sensory neurons might have the capability to use non-OXPHOS energy for axonal transport [10]. Indeed, in the case of PNS DRG neurons, metabolic plasticity would be particularly advantageous because of their unique morphology, ie, the long axons, location outside the blood brain barrier and because excessive ROS, which is incidental to their high mitochondrial content, exacerbates vulnerabilities to insults that involve disruptions of mitochondrial energy production [3].
Importantly, recent screen for drugs capable of reprogramming energy metabolism identified an ‘old’ FDA approved drug, meclizine [11]. Since, meclizine was found neuroprotective in mouse models of ischemia/reperfusion, in Huntington’s disease [11, 12] and most recently in models of Parkinson’s disease [13], it was of much interest to determine whether meclizine might affect energy metabolism also in DRG neurons. We found that in DRG neurons meclizine rapidly stimulates glycolytic metabolism without altering mitochondrial respiration. To test whether enhancement of glycolytic metabolism by meclizine could protect DRG neurons subjected to energy stress, DRG cultures were exposed to sub-lethal hypoxia, a physiologically relevant condition, amenable to adaptive survival responses [60]. We found that meclizine supplementation during hypoxia averted mitochondrial compromise. Specifically, meclizine attenuated the loss of spare respiratory capacity induced by hypoxic exposure; this ameliorative effect was abrogated by 2-deoxyglucose, an inhibitor of the first step of glycolysis, implicating glycolytic metabolism in protection of DRG neurons by meclizine. In this setting, meclizine prevented depletion of NADPH and glutathione stores, attenuated ATP depletion, diminished ROS and lessened hypoxia-induced mitochondrial clustering in DRG neurites. Using XF24 extracellular flux analyzer to measure instantaneous metabolic changes, we detected elevation of extracellular acidification rates at the minutes timescale following the addition of meclizine. Such rapid response suggests that initial effects of meclizine might be exerted at the level of metabolic control. This possibility is further supported by meclizine-induced increases in glucose consumption and lactate release. Moreover, these meclizine-mediated effects including, preservation of intracellular NADPH and glutathione stores are abrogated by 2-deoxyglucose, an upstream inhibitor of glycolytic metabolism, underscoring the involvement of metabolic regulation in driving rapid effects of meclizine. In neurons enhancement of glycolytic metabolism is particularly advantageous in that it can boost the pentose-phosphate pathway (PPP), supporting regeneration of NADPH and glutathione stores, which are central and indispensable components of neuronal antioxidant systems [26, 61]. In support of meclizine involvement in stimulation of the pentose phosphate branch of glycolytic metabolism, we found that meclizine prevented the hypoxia-induced increases in NADP+/NADPH ratios and the concomitant decreases in reduced glutathione levels. Preservation of NADP+/NADPH ratios and glutathione stores is required to maintain antioxidant defenses and thereby, contributes to ROS diminution and lessening of hypoxia-induced mitochondrial clustering. Thus, plausible neuroprotective mechanism by meclizine involves also an augmentation of the pentose phosphate branch of glycolysis. Notwithstanding, accelerated glycolytic metabolism should help avert ATP depletion and meet energy demands when oxygen supply is inadequate. Reported examples include the ability of sensory neurons to utilize glycolytic energy for fast axonal transport of vesicles [10] and sustenance of synaptic function under energy stress [7], highlighting the unexplored premise that the range of metabolic plasticity might be neuron-type specific. Accordingly, meclizine targets may differ not only among cell types but also between CNS and PNS neurons. In fact the original report which linked meclizine to energy metabolism, proposed that meclizine affords neuroprotection by attenuating mitochondrial respiration [11], while subsequent study in skin fibroblasts, identified a cytosolic target of meclizine, the ethanolamine branch of Kennedy pathway [15]. In contrast, we and others [13] describe effects of low doses of meclizine, which do not alter mitochondrial respiration, suggesting that meclizine might affect different cellular targets in dose, time and cell-type dependent manner. Our findings describing meclizine-mediated stimulation of glycolysis in DRG neurons are consistent with newly reported neuroprotection by meclizine in PD model that involves enhanced glycolysis [13].
In summary, we describe two types of effects exerted by meclizine in DRG neurons: (l) rapid stimulation of glycolytic metabolism and (ll) neuroprotection in a setting of hypoxic challenge, which perturbs cellular bioenergetics. Our study corroborates the reported neuroprotective potential of meclizine and supports the premise that the scope of meclizine targets might differ not only in cell-type but also in neuron-type specific manner. The rapid effect of meclizine that we detect, ie, augmentation of glycolytic metabolism, occurs at the timescale of minutes suggesting that meclizine exerts primary control at the metabolic level. Interestingly, while meclizine does not alter gene expression under normoxic conditions, we observe augmentation of hypoxia-induced expression of certain glycolytic genes by meclizine including, glucose transporter 3 (GLUT3), hexokinase 2 (HK2) and lactate dehydrogenase A (LDHA). While the mechanism underlying this delayed effect of meclizine is not known, it is plausible that a metabolic feedback loop imposed by changes in levels of certain glycolytic metabolites is involved. Shifting to glycolytic energy production is an adaptive mechanism in response to energy stress such as hypoxic condition, which here is measurably augmented by meclizine, revealing for the first time metabolic plasticity of DRG neurons. Our findings demonstrate that the rapidly induced upregulation of glycolytic metabolism by meclizine sustains cellular ATP content, improves redox balance and antioxidant capacity and lessens hypoxia-induced mitochondrial compromise in DRG neurons.
The notion that changes exerted very fast by metabolic regulation might represent a previously not appreciated neuroprotective mechanism in DRG neurons, warrants further investigation to gain mechanistic understanding of neuroprotection by meclizine and define the potential of metabolic interventions as therapeutic strategies for protection of neurons in the peripheral nervous system.
Supplementary Material
Highlights.
Meclizine stimulates glycolysis and reveals metabolic plasticity of DRG neurons
In hypoxic DRGs meclizine mitigates depletion of ATP, NADPH and GSH
Meclizine prevents compromise of mitochondrial respiratory capacity by hypoxia
Glycolytic metabolism is indispensable for protection of hypoxic DRGs by meclizine
Potential for protection of PNS neurons by metabolic reprogramming is revealed
Acknowledgments
This work was supported by grants from Shriners Hospitals for Children (86700), National Institutes of Health (ES014613) and Surgery Department to EWE. The funding sources had no involvement in any aspects of study. We thank Steve Schuenke and Eileen Figueroa at Surgery Department, UTMB, for assistance with manuscript preparation.
List of abbreviations
- 2DG
2-deoxyglucose
- FCCP
carbonyl cyanide p-trifluoromethoxyphenylhydrazone
- COX-1
cytochrome c oxidase subunit 1
- DRG
dorsal root ganglion
- ECAR
extracellular acidification rate
- NADP+
nicotinamide adenine dinucleotide phosphate
- NADPH
nicotinamide adenine dinucleotide phosphate, reduced form
- OXPHOS
oxidative phosphorylation
- OCR
oxygen consumption rate
- PPP
pentose phosphate pathway
- PNS
peripheral nervous system
- ROS
reactive oxygen species
- SRC
spare respiratory capacity
Footnotes
CONFLICT OF INTEREST/DISCLOSURE
Authors declare no conflicts of interest.
Publisher's Disclaimer: This is a PDF file of an unedited manuscript that has been accepted for publication. As a service to our customers we are providing this early version of the manuscript. The manuscript will undergo copyediting, typesetting, and review of the resulting proof before it is published in its final citable form. Please note that during the production process errors may be discovered which could affect the content, and all legal disclaimers that apply to the journal pertain.
References
- 1.Willems PH, Rossignol R, Dieteren CE, Murphy MP, Koopman WJ. Redox homeostasis and mitochondrial dynamics. Cell Metab. 2015;22:207–218. doi: 10.1016/j.cmet.2015.06.006. [DOI] [PubMed] [Google Scholar]
- 2.Carelli V, Chan DC. Mitochondrial DNA: impacting central and peripheral nervous systems. Neuron. 2014;84:1126–1142. doi: 10.1016/j.neuron.2014.11.022. [DOI] [PMC free article] [PubMed] [Google Scholar]
- 3.Wang Y, Hekimi S. Mitochondrial dysfunction and longevity in animals: untangling the knot. Science. 2015;350:1204–1207. doi: 10.1126/science.aac4357. [DOI] [PubMed] [Google Scholar]
- 4.Wai T, Langer T. Mitochondrial dynamics and metabolic regulation. Trends Endocrinol Metab. 2016;27:105–117. doi: 10.1016/j.tem.2015.12.001. [DOI] [PubMed] [Google Scholar]
- 5.Gardiner NJ, Wang Z, Luke C, Gott A, Price SA, Fernyhough P. Expression of hexokinase isoforms in the dorsal root ganglion of the adult rat and effect of experimental diabetes. Brain Res. 2007;1175:143–154. doi: 10.1016/j.brainres.2007.08.015. [DOI] [PubMed] [Google Scholar]
- 6.Habash T, Saleh A, Roy Chowdhury SK, Smith DR, Fernyhough P. The proinflammatory cytokine, interleukin-17A, augments mitochondrial function and neurite outgrowth of cultured adult sensory neurons derived from normal and diabetic rats. Exp Neurol. 2015;273:177–189. doi: 10.1016/j.expneurol.2015.08.016. [DOI] [PubMed] [Google Scholar]
- 7.Jang S, Nelson JC, Bend EG, Rodriguez-Laureano L, Tueros FG, Cartagenova L, Underwood K, Jorgensen EM, Colon-Ramos DA. Glycolytic enzymes localize to synapses under energy stress to support synaptic function. Neuron. 2016;90:278–291. doi: 10.1016/j.neuron.2016.03.011. [DOI] [PMC free article] [PubMed] [Google Scholar]
- 8.Lee do Y, Xun Z, Platt V, Budworth H, Canaria CA, McMurray CT. Distinct pools of non-glycolytic substrates differentiate brain regions and prime region-specific responses of mitochondria. PLoS One. 2013;8:e68831. doi: 10.1371/journal.pone.0068831. [DOI] [PMC free article] [PubMed] [Google Scholar]
- 9.Lundgaard I, Li B, Xie L, Kang H, Sanggaard S, Haswell JD, Sun W, Goldman S, Blekot S, Nielsen M, Takano T, Deane R, Nedergaard M. Direct neuronal glucose uptake Heralds activity-dependent increases in cerebral metabolism. Nat Commun. 2015;6:6807. doi: 10.1038/ncomms7807. [DOI] [PMC free article] [PubMed] [Google Scholar]
- 10.Zala D, Hinckelmann MV, Yu H, Lyra da Cunha MM, Liot G, Cordelieres FP, Marco S, Saudou F. Vesicular glycolysis provides on-board energy for fast axonal transport. Cell. 2013;152:479–491. doi: 10.1016/j.cell.2012.12.029. [DOI] [PubMed] [Google Scholar]
- 11.Gohil VM, Sheth SA, Nilsson R, Wojtovich AP, Lee JH, Perocchi F, Chen W, Clish CB, Ayata C, Brookes PS, Mootha VK. Nutrient-sensitized screening for drugs that shift energy metabolism from mitochondrial respiration to glycolysis. Nat Biotechnol. 2010;28:249–255. doi: 10.1038/nbt.1606. [DOI] [PMC free article] [PubMed] [Google Scholar]
- 12.Gohil VM, Offner N, Walker JA, Sheth SA, Fossale E, Gusella JF, MacDonald ME, Neri C, Mootha VK. Meclizine is neuroprotective in models of Huntington’s disease. Hum Mol Genet. 2011;20:294–300. doi: 10.1093/hmg/ddq464. [DOI] [PMC free article] [PubMed] [Google Scholar]
- 13.Hong CT, Chau KY, Schapira AH. Meclizine-induced enhanced glycolysis is neuroprotective in Parkinson disease cell models. Sci Rep. 2016;6:25344. doi: 10.1038/srep25344. [DOI] [PMC free article] [PubMed] [Google Scholar]
- 14.Gleyzer N, Scarpulla RC. Activation of a PGC-1-related coactivator (PRC)-dependent inflammatory stress program linked to apoptosis and premature senescence. J Biol Chem. 2013;288:8004–8015. doi: 10.1074/jbc.M112.426841. [DOI] [PMC free article] [PubMed] [Google Scholar]
- 15.Gohil VM, Zhu L, Baker CD, Cracan V, Yaseen A, Jain M, Clish CB, Brookes PS, Bakovic M, Mootha VK. Meclizine inhibits mitochondrial respiration through direct targeting of cytosolic phosphoethanolamine metabolism. J Biol Chem. 2013;288:35387–35395. doi: 10.1074/jbc.M113.489237. [DOI] [PMC free article] [PubMed] [Google Scholar]
- 16.Kishi S, Campanholle G, Gohil VM, Perocchi F, Brooks CR, Morizane R, Sabbisetti V, Ichimura T, Mootha VK, Bonventre JV. Meclizine preconditioning protects the kidney against ischemia-reperfusion injury. EBioMedicine. 2015;2:1090–1101. doi: 10.1016/j.ebiom.2015.07.035. [DOI] [PMC free article] [PubMed] [Google Scholar]
- 17.Almado CE, Machado BH, Leao RM. Chronic intermittent hypoxia depresses afferent neurotransmission in NTS neurons by a reduction in the number of active synapses. J Neurosci. 2012;32:16736–16746. doi: 10.1523/JNEUROSCI.2654-12.2012. [DOI] [PMC free article] [PubMed] [Google Scholar]
- 18.Latronico N, Bolton CF. Critical illness polyneuropathy and myopathy: a major cause of muscle weakness and paralysis. Lancet Neurol. 2011;10:931–941. doi: 10.1016/S1474-4422(11)70178-8. [DOI] [PubMed] [Google Scholar]
- 19.Lim TK, Shi XQ, Johnson JM, Rone MB, Antel JP, David S, Zhang J. Peripheral nerve injury induces persistent vascular dysfunction and endoneurial hypoxia, contributing to the genesis of neuropathic pain. J Neurosci. 2015;35:3346–3359. doi: 10.1523/JNEUROSCI.4040-14.2015. [DOI] [PMC free article] [PubMed] [Google Scholar]
- 20.Brand MD, Nicholls DG. Assessing mitochondrial dysfunction in cells. Biochem J. 2011;435:297–312. doi: 10.1042/BJ20110162. [DOI] [PMC free article] [PubMed] [Google Scholar]
- 21.Dranka BP, Benavides GA, Diers AR, Giordano S, Zelickson BR, Reily C, Zou L, Chatham JC, Hill BG, Zhang J, Landar A, Darley-Usmar VM. Assessing bioenergetic function in response to oxidative stress by metabolic profiling. Free Radic Biol Med. 2011;51:1621–1635. doi: 10.1016/j.freeradbiomed.2011.08.005. [DOI] [PMC free article] [PubMed] [Google Scholar]
- 22.Gerencser AA, Neilson A, Choi SW, Edman U, Yadava N, Oh RJ, Ferrick DA, Nicholls DG, Brand MD. Quantitative microplate-based respirometry with correction for oxygen diffusion. Anal Chem. 2009;81:6868–6878. doi: 10.1021/ac900881z. [DOI] [PMC free article] [PubMed] [Google Scholar]
- 23.Singh S, Englander EW. Nuclear depletion of apurinic/apyrimidinic endonuclease 1 (Ape1/Ref-1) is an indicator of energy disruption in neurons. Free Radic Biol Med. 2012;53:1782–1790. doi: 10.1016/j.freeradbiomed.2012.07.025. [DOI] [PMC free article] [PubMed] [Google Scholar]
- 24.Wu M, Neilson A, Swift AL, Moran R, Tamagnine J, Parslow D, Armistead S, Lemire K, Orrell J, Teich J, Chomicz S, Ferrick DA. Multiparameter metabolic analysis reveals a close link between attenuated mitochondrial bioenergetic function and enhanced glycolysis dependency in human tumor cells. Am J Physiol Cell Physiol. 2007;292:C125–136. doi: 10.1152/ajpcell.00247.2006. [DOI] [PubMed] [Google Scholar]
- 25.Pfleger J, He M, Abdellatif M. Mitochondrial complex II is a source of the reserve respiratory capacity that is regulated by metabolic sensors and promotes cell survival. Cell Death Dis. 2015;6:e1835. doi: 10.1038/cddis.2015.202. [DOI] [PMC free article] [PubMed] [Google Scholar]
- 26.Bouzier-Sore AK, Bolanos JP. Uncertainties in pentose-phosphate pathway flux assessment underestimate its contribution to neuronal glucose consumption: relevance for neurodegeneration and aging. Front Aging Neurosci. 2015;7:89. doi: 10.3389/fnagi.2015.00089. [DOI] [PMC free article] [PubMed] [Google Scholar]
- 27.Fernyhough P. Mitochondrial dysfunction in diabetic neuropathy: a series of unfortunate metabolic events. Curr Diab Rep. 2015;15:89. doi: 10.1007/s11892-015-0671-9. [DOI] [PubMed] [Google Scholar]
- 28.Huang LY, Neher E. Ca(2+)-dependent exocytosis in the somata of dorsal root ganglion neurons. Neuron. 1996;17:135–145. doi: 10.1016/s0896-6273(00)80287-1. [DOI] [PubMed] [Google Scholar]
- 29.Lindsay RM. Nerve growth factors (NGF, BDNF) enhance axonal regeneration but are not required for survival of adult sensory neurons. J Neurosci. 1988;8:2394–2405. doi: 10.1523/JNEUROSCI.08-07-02394.1988. [DOI] [PMC free article] [PubMed] [Google Scholar]
- 30.Malin SA, Davis BM, Molliver DC. Production of dissociated sensory neuron cultures and considerations for their use in studying neuronal function and plasticity. Nat Protoc. 2007;2:152–160. doi: 10.1038/nprot.2006.461. [DOI] [PubMed] [Google Scholar]
- 31.Wu D, Yotnda P. Induction and testing of hypoxia in cell culture. J Vis Exp. 2011;54:e2899. doi: 10.3791/2899. [DOI] [PMC free article] [PubMed] [Google Scholar]
- 32.Schildge S, Bohrer C, Beck K, Schachtrup C. Isolation and culture of mouse cortical astrocytes. J Vis Exp. 2013 doi: 10.3791/50079. pii: 50079 50010.53791/50079. [DOI] [PMC free article] [PubMed] [Google Scholar]
- 33.Skaper SD, Argentini C, Barbierato M. Culture of neonatal rodent microglia, astrocytes, and oligodendrocytes from cortex and spinal cord. Methods Mol Biol. 2012;846:67–77. doi: 10.1007/978-1-61779-536-7_7. [DOI] [PubMed] [Google Scholar]
- 34.Singh S, Zhuo M, Gorgun FM, Englander EW. Overexpressed neuroglobin raises threshold for nitric oxide-induced impairment of mitochondrial respiratory activities and stress signaling in primary cortical neurons. Nitric Oxide. 2013;32:21–28. doi: 10.1016/j.niox.2013.03.008. [DOI] [PMC free article] [PubMed] [Google Scholar]
- 35.Schmittgen TD, Livak KJ. Analyzing real-time PCR data by the comparative C(T) method. Nat Protoc. 2008;3:1101–1108. doi: 10.1038/nprot.2008.73. [DOI] [PubMed] [Google Scholar]
- 36.Serganova I, Rizwan A, Ni X, Thakur SB, Vider J, Russell J, Blasberg R, Koutcher JA. Metabolic imaging: a link between lactate dehydrogenase A, lactate, and tumor phenotype. Clin Cancer Res. 2011;17:6250–6261. doi: 10.1158/1078-0432.CCR-11-0397. [DOI] [PMC free article] [PubMed] [Google Scholar]
- 37.Bindokas VP, Jordan J, Lee CC, Miller RJ. Superoxide production in rat hippocampal neurons: selective imaging with hydroethidine. J Neurosci. 1996;16:1324–1336. doi: 10.1523/JNEUROSCI.16-04-01324.1996. [DOI] [PMC free article] [PubMed] [Google Scholar]
- 38.Forkink M, Willems PH, Koopman WJ, Grefte S. Live-cell assessment of mitochondrial reactive oxygen species using dihydroethidine. Methods Mol Biol. 2015;1264:161–169. doi: 10.1007/978-1-4939-2257-4_15. [DOI] [PubMed] [Google Scholar]
- 39.Englander EW, Hu Z, Sharma A, Lee HM, Wu ZH, Greeley GH. Rat MYH, a glycosylase for repair of oxidatively damaged DNA, has brain-specific isoforms that localize to neuronal mitochondria. J Neurochem. 2002;83:1471–1480. doi: 10.1046/j.1471-4159.2002.01259.x. [DOI] [PubMed] [Google Scholar]
- 40.Mandavilli BS, Janes MS. Detection of intracellular glutathione using ThiolTracker violet stain and fluorescence microscopy. Curr Protoc Cytom. 2010;Chapter 9(Unit 9):35. doi: 10.1002/0471142956.cy0935s53. [DOI] [PubMed] [Google Scholar]
- 41.Santambrogio P, Dusi S, Guaraldo M, Rotundo LI, Broccoli V, Garavaglia B, Tiranti V, Levi S. Mitochondrial iron and energetic dysfunction distinguish fibroblasts and induced neurons from pantothenate kinase-associated neurodegeneration patients. Neurobiol Dis. 2015;81:144–153. doi: 10.1016/j.nbd.2015.02.030. [DOI] [PMC free article] [PubMed] [Google Scholar]
- 42.Mookerjee SA, Goncalves RL, Gerencser AA, Nicholls DG, Brand MD. The contributions of respiration and glycolysis to extracellular acid production. Biochim Biophys Acta. 2015;1847:171–181. doi: 10.1016/j.bbabio.2014.10.005. [DOI] [PubMed] [Google Scholar]
- 43.Thevenet J, De Marchi U, Domingo JS, Christinat N, Bultot L, Lefebvre G, Sakamoto K, Descombes P, Masoodi M, Wiederkehr A. Medium-chain fatty acids inhibit mitochondrial metabolism in astrocytes promoting astrocyte-neuron lactate and ketone body shuttle systems. FASEB J. 2016;30:1913–1926. doi: 10.1096/fj.201500182. [DOI] [PubMed] [Google Scholar]
- 44.Distelmaier F, Valsecchi F, Liemburg-Apers DC, Lebiedzinska M, Rodenburg RJ, Heil S, Keijer J, Fransen J, Imamura H, Danhauser K, Seibt A, Viollet B, Gellerich FN, Smeitink JA, Wieckowski MR, Willems PH, Koopman WJ. Mitochondrial dysfunction in primary human fibroblasts triggers an adaptive cell survival program that requires AMPK-alpha. Biochim Biophys Acta. 2015;1852:529–540. doi: 10.1016/j.bbadis.2014.12.012. [DOI] [PubMed] [Google Scholar]
- 45.Domenech E, Maestre C, Esteban-Martinez L, Partida D, Pascual R, Fernandez-Miranda G, Seco E, Campos-Olivas R, Perez M, Megias D, Allen K, Lopez M, Saha AK, Velasco G, Rial E, Mendez R, Boya P, Salazar-Roa M, Malumbres M. AMPK and PFKFB3 mediate glycolysis and survival in response to mitophagy during mitotic arrest. Nat Cell Biol. 2015;17:1304–1316. doi: 10.1038/ncb3231. [DOI] [PubMed] [Google Scholar]
- 46.Fu X, Zhu MJ, Dodson MV, Du M. AMP-activated protein kinase stimulates warburg-like glycolysis and activation of satellite cells during muscle regeneration. J Biol Chem. 2015;290:26445–26456. doi: 10.1074/jbc.M115.665232. [DOI] [PMC free article] [PubMed] [Google Scholar]
- 47.Liemburg-Apers DC, Schirris TJ, Russel FG, Willems PH, Koopman WJ. Mitoenergetic dysfunction triggers a rapid compensatory increase in steady-state glucose flux. Biophys J. 2015;109:1372–1386. doi: 10.1016/j.bpj.2015.08.002. [DOI] [PMC free article] [PubMed] [Google Scholar]
- 48.Pfluger PT, Kabra DG, Aichler M, Schriever SC, Pfuhlmann K, Garcia VC, Lehti M, Weber J, Kutschke M, Rozman J, Elrod JW, Hevener AL, Feuchtinger A, Hrabe de Angelis M, Walch A, Rollmann SM, Aronow BJ, Muller TD, Perez-Tilve D, Jastroch M, De Luca M, Molkentin JD, Tschop MH. Calcineurin Links Mitochondrial Elongation with Energy Metabolism. Cell Metab. 2015;22:838–850. doi: 10.1016/j.cmet.2015.08.022. [DOI] [PubMed] [Google Scholar]
- 49.Shin S, Buel GR, Wolgamott L, Plas DR, Asara JM, Blenis J, Yoon SO. ERK2 mediates metabolic stress response to regulate cell fate. Mol Cell. 2015;59:382–398. doi: 10.1016/j.molcel.2015.06.020. [DOI] [PMC free article] [PubMed] [Google Scholar]
- 50.Dupuy F, Tabaries S, Andrzejewski S, Dong Z, Blagih J, Annis MG, Omeroglu A, Gao D, Leung S, Amir E, Clemons M, Aguilar-Mahecha A, Basik M, Vincent EE, St-Pierre J, Jones RG, Siegel PM. PDK1-dependent metabolic reprogramming dictates metastatic potential in breast cancer. Cell Metab. 2015;22:577–589. doi: 10.1016/j.cmet.2015.08.007. [DOI] [PubMed] [Google Scholar]
- 51.Montal ED, Dewi R, Bhalla K, Ou L, Hwang BJ, Ropell AE, Gordon C, Liu WJ, DeBerardinis RJ, Sudderth J, Twaddel W, Boros LG, Shroyer KR, Duraisamy S, Drapkin R, Powers RS, Rohde JM, Boxer MB, Wong KK, Girnun GD. PEPCK Coordinates the Regulation of Central Carbon Metabolism to Promote Cancer Cell Growth. Mol Cell. 2015;60:571–583. doi: 10.1016/j.molcel.2015.09.025. [DOI] [PMC free article] [PubMed] [Google Scholar]
- 52.Vincent EE, Sergushichev A, Griss T, Gingras MC, Samborska B, Ntimbane T, Coelho PP, Blagih J, Raissi TC, Choiniere L, Bridon G, Loginicheva E, Flynn BR, Thomas EC, Tavare JM, Avizonis D, Pause A, Elder DJ, Artyomov MN, Jones RG. Mitochondrial phosphoenolpyruvate carboxykinase regulates metabolic adaptation and enables glucose-independent tumor growth. Mol Cell. 2015;60:195–207. doi: 10.1016/j.molcel.2015.08.013. [DOI] [PubMed] [Google Scholar]
- 53.Chang CH, Qiu J, O’Sullivan D, Buck MD, Noguchi T, Curtis JD, Chen Q, Gindin M, Gubin MM, van der Windt GJ, Tonc E, Schreiber RD, Pearce EJ, Pearce EL. metabolic competition in the tumor microenvironment is a driver of cancer progression. Cell. 2015;162:1229–1241. doi: 10.1016/j.cell.2015.08.016. [DOI] [PMC free article] [PubMed] [Google Scholar]
- 54.Ho PC, Bihuniak JD, Macintyre AN, Staron M, Liu X, Amezquita R, Tsui YC, Cui G, Micevic G, Perales JC, Kleinstein SH, Abel ED, Insogna KL, Feske S, Locasale JW, Bosenberg MW, Rathmell JC, Kaech SM. Phosphoenolpyruvate is a metabolic checkpoint of anti-tumor T cell responses. Cell. 2015;162:1217–1228. doi: 10.1016/j.cell.2015.08.012. [DOI] [PMC free article] [PubMed] [Google Scholar]
- 55.Klysz D, Tai X, Robert PA, Craveiro M, Cretenet G, Oburoglu L, Mongellaz C, Floess S, Fritz V, Matias MI, Yong C, Surh N, Marie JC, Huehn J, Zimmermann V, Kinet S, Dardalhon V, Taylor N. Glutamine-dependent alpha-ketoglutarate production regulates the balance between T helper 1 cell and regulatory T cell generation. Sci Signal. 2015;8:ra97. doi: 10.1126/scisignal.aab2610. [DOI] [PubMed] [Google Scholar]
- 56.Bagga P, Behar KL, Mason GF, De Feyter HM, Rothman DL, Patel AB. Characterization of cerebral glutamine uptake from blood in the mouse brain: implications for metabolic modeling of 13C NMR data. J Cereb Blood Flow Metab. 2014;34:1666–1672. doi: 10.1038/jcbfm.2014.129. [DOI] [PMC free article] [PubMed] [Google Scholar]
- 57.Liu D, Chan SL, de Souza-Pinto NC, Slevin JR, Wersto RP, Zhan M, Mustafa K, de Cabo R, Mattson MP. Mitochondrial UCP4 mediates an adaptive shift in energy metabolism and increases the resistance of neurons to metabolic and oxidative stress. Neuromolecular Med. 2006;8:389–414. doi: 10.1385/NMM:8:3:389. [DOI] [PubMed] [Google Scholar]
- 58.Karaca M, Frigerio F, Migrenne S, Martin-Levilain J, Skytt DM, Pajecka K, Martin-Del-Rio R, Gruetter R, Tamarit-Rodriguez J, Waagepetersen HS, Magnan C, Maechler P. GDH-dependent glutamate oxidation in the brain dictates peripheral energy substrate distribution. Cell Rep. 2015;13:365–375. doi: 10.1016/j.celrep.2015.09.003. [DOI] [PubMed] [Google Scholar]
- 59.Patel AB, Lai JC, Chowdhury GM, Hyder F, Rothman DL, Shulman RG, Behar KL. Direct evidence for activity-dependent glucose phosphorylation in neurons with implications for the astrocyte-to-neuron lactate shuttle. Proc Natl Acad Sci U S A. 2014;111:5385–5390. doi: 10.1073/pnas.1403576111. [DOI] [PMC free article] [PubMed] [Google Scholar]
- 60.Cho Y, Shin JE, Ewan EE, Oh YM, Pita-Thomas W, Cavalli V. Activating injury-responsive genes with hypoxia Eenhances axon regeneration through neuronal HIF-1alpha. Neuron. 2015;88:720–734. doi: 10.1016/j.neuron.2015.09.050. [DOI] [PMC free article] [PubMed] [Google Scholar]
- 61.Bolanos JP, Almeida A, Moncada S. Glycolysis: a bioenergetic or a survival pathway? Trends Biochem Sci. 2010;35:145–149. doi: 10.1016/j.tibs.2009.10.006. [DOI] [PubMed] [Google Scholar]
Associated Data
This section collects any data citations, data availability statements, or supplementary materials included in this article.


