

Abstract
Introduction
Chronic hypersecretion of the 37 amino acid amylin is common in type 2 diabetics (T2D). Recent studies implicate human amylin aggregates cause proteotoxicity (cell death induced by misfolded proteins) in both the brain and the heart.
Objectives
Identify systemic mechanisms/markers by which human amylin associated with cardiac and brain defects might be identified.
Methods
We investigated the metabolic consequences of amyloidogenic and cytotoxic amylin oligomers in heart, brain, liver, and plasma using non-targeted metabolomics analysis in a rat model expressing pancreatic human amylin (HIP model).
Results
Four metabolites were significantly different in 3 or more of the the four compartments (heart, brain, liver, and plasma) in HIP rats. When compared to a T2D rat model, HIP hearts uniquely had significant DECREASES in five amino acids (lysine, alanine, tyrosine, phenylalanine, serine), with phenylalanine decreased across all four tissues investigated, including plasma. In contrast, significantly INCREASED circulating phenylalanine is reported in diabetics in multiple recent studies.
Conclusion
DECREASED phenylalanine may serve as a unique marker of cardiac and brain dysfunction due to hyperamylinemia that can be differentiated from alterations in T2D in the plasma. While the deficiency in phenylalanine was seen across tissues including plasma and could be monitored, reduced tyrosine was seen only in the brain. The 50% reduction in phenylalanine and tyrosine in HIP brains is significant given their role in supporting brain chemistry as a precursor for catecholamines (dopamine, norepinephrine, epinephrine), which may contribute to the increased morbidity and mortality in diabetics at a multi-system level beyond the effects on glucose metabolism.
Keywords: Amylin, metabolomics, neurodegenerative disease, cardiomyopathy, diabetes, proteotoxicity
1 Introduction
Amylin, or Islet amyloid polypeptide, is a 37 amino acid hormone, co-secreted with insulin from β- cells in the pancreatic Islets of Langerhans. Since its discovery in 1986, research identifying amylin’s regulatory effects on nutrient fluxes, satiation, and on the regulation of insulin and pancreatic beta cells have been reported (Hay et al. 2015). In addition to its emerging physiological roles, chronic hypersecretion of amylin is an emerging concern as it is common in pre-diabetic and obese humans (Despa et al. 2012; Despa et al. 2014). Recent studies have demonstrated that human amylin aggregates in vivo to cause proteotoxicity (cell death induced by misfolded proteins) in both the brain and the heart (Despa et al. 2012; Despa et al. 2014; Srodulski et al. 2014).
These studies have redefined the relationship between type II diabetes and neurodegenerative disease. As the most common form of dementia, Alzheimer’s disease is characterized by the accumulation of extracellular beta amyloid peptide aggregates and intracellular hyperphosphorylated tau protein (Verdile et al. 2015). Recent studies have identified amylin oligomers and plaques in the temporal lobe gray matter from diabetic patients, but not controls (Jackson et al. 2013). Interestingly, while amylin accumulation lead to amyloid formation independent of amyloid beta deposition, tissues infiltrated by amylin occasionally mixed with amyloid beta protein, the typical pathogenic lesion in Alzheimer’s disease (Jackson et al. 2013). Amylin infiltration in these patients were widespread, evidenced by increased interstitial space, vacuolation, spongiform changes, and capillaries bent at amylin accumulation sites without evidence of synthesis in the brain (Jackson et al. 2013). These findings have led to the hypothesis that human amylin has a role at the interface between metabolic and neurodegenerative disorders which are widely underestimated (Lutz, Meyer 2015).
In the present study, we investigated the metabolic consequences of amyloidogenic and cytotoxic amylin oligomers and diabetes in the multiple organs applying non-targeted metabolomics analysis to a recently created rat model expressing pancreatic human amylin (HIP model). Since rodent amylin has been found to be uniquely non-amyloidogenic and non-cytotoxic in contrast to human amylin, rats expressing human amylin in the pancreas (HIP) have previously been utilized to elucidate that oligomerized amylin migrates to most organs, including the heart and brain (Despa et al. 2014; Lambert et al. 2015; Srodulski et al. 2014). Compared to littermate wildtypeHIPTg+ rats, the HIP rats have defects in the pancreas over time, leading to diabetes and brain/heart dysfunction secondary to the accumulation of oligomerized amylin, including large deposits of >50 microns in the brain (Srodulski et al. 2014). The hyperamylinemia-induced oligomerized amylin further mediated activation of inflammation, leading to neurologic defects manifesting as reduced exploratory drive, impaired recognition memory, and the lack of ability to improve rotarod performance (an assay of body balance) (Srodulski et al. 2014). Cardiac defects are seen in parallel, Na+ influx significantly larger in HIP myocytes compared to wildtypeHIPTg+ controls, resulting in arrhythmogenesis and oxidative stress (Lambert et al. 2015). To delineate how human amylin affects the heart, brain, and liver we performed non-targeted metabolomics on 12-month-old HIP rats along with non-targeted analysis of plasma to identify if the metabolic changes seen in tissues are paralleled in the circulation as biomarkers of disease.
2 Materials and Methods
2.1 Transgenic HIP rat model
The investigation conforms to the Guide for the Care and Use of Laboratory Animals published by the US National Institutes of Health (NIH Publication No. 85-23, revised 1996) and was approved by the Institutional Animal Care and Use Committees at University of Kentucky. Male HIP rats at one year of age were used in the present study and are Sprague–Dawley rats expressing human amylin in pancreatic β-cells. This model was previously used to study complications of T2D associated with amylin deposition in myocardium (Despa et al. 2012; Erickson et al. 2013) and brain (Srodulski et al. 2014). Age- and gender-matched wild type littermates (wildtypeHIPTg+) do not accumulate pancreatic or peripheral amylin and served as controls. The tissue assayed and the glucose determinations in the current study are exclusive newly generated data.
2.2 Metabolomics Determination by GC–MS Instrumentation
Cardiac tissue was flash frozen in a liquid nitrogen cooled biopress, weighed (25–50 mg wet weight), then placed in buffer (50 % acetyl-nitrile, 50 % water, 0.3 % formic acid) at a standard concentration of 25 mg/475 mcl buffer then fully homogenized on ice for 10–25 s and placed on dry ice/stored at −80C. Samples were then analyzed by GC/MS, as previously described (Banerjee et al. 2015). The raw, transformed, and sorted data used for each of the three comparisons in the metabolomics analyses can be found in Supplemental Table 1. Up to 3 missing values per group were imputed using lowest value in the same group, with groups missing 4 or more excluded from the analysis. In groups where the analyte was missing in all members, a value of 1 was imputed for statistical analysis, with their fold change interpreted with caution as indicated in Figures 1–4 (*, e.g. Inosine 5′ monophosphate in Figure 1A). All data used in this analysis has been archived in the UCSD Metabolomics Workbench (http://www.metabolomicsworkbench.org/), accession #PendingAssignment/Uploaded 17 February 2016.
Figure 1. Non-targeted metabolomics of cardiac tissue in Human Amylin producing rat models (HIP rats).
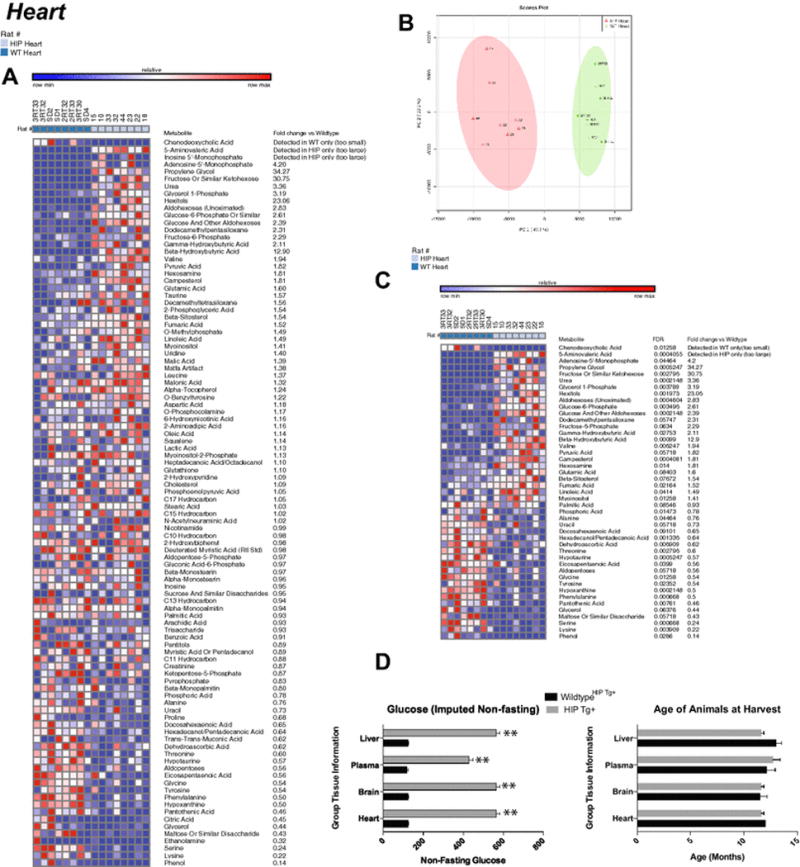
A. Heat map of metabolites identified by non-targeted GC/MS analysis of cardiac tissue. B. Principal components analysis. C. Heat map comparing HIP to wildtypeHIPTg+ heart t-test significant metabolites and indicating fold change and false discovery rates (FDR) for each metabolite. D. Non-fasting glucose levels in HIP Tg+ rats. N=8/group. Data is mean +/− SEM.
Figure 4. Non-targeted metabolomics of plasma in Human Amylin producing rat models (HIP rats).
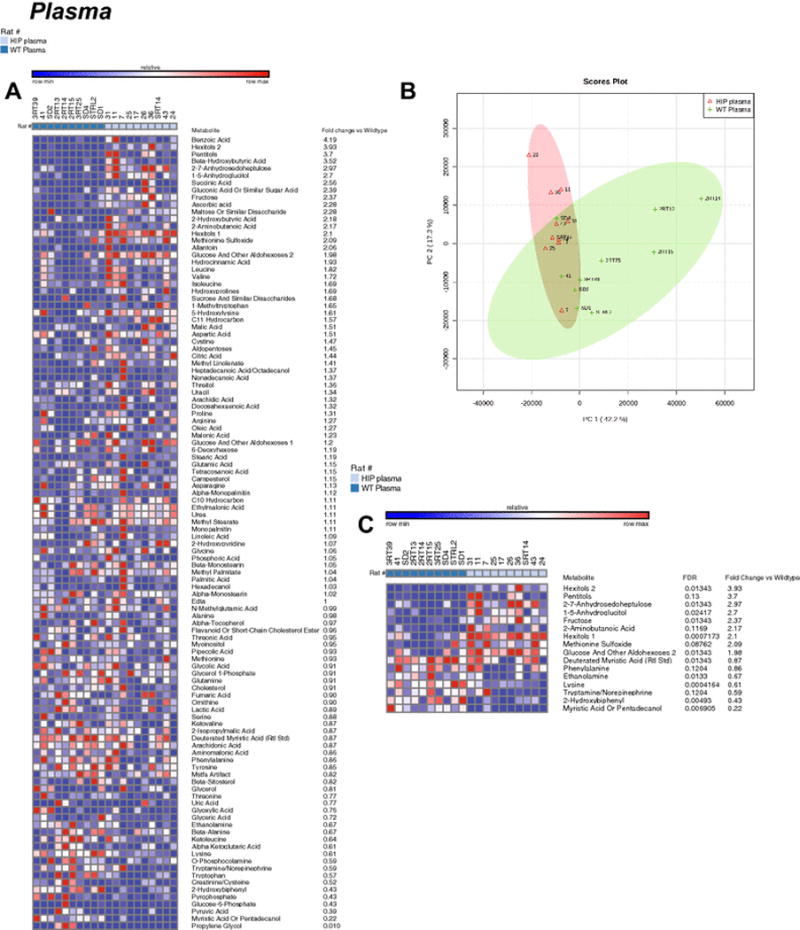
A. Heat map of metabolites identified by non-targeted GC/MS analysis of plasma. B. Principal components analysis. C. Heat map comparing HIP to wildtypeHIPTg+ plasma t-test significant metabolites and indicating fold change and false discovery rates (FDR) for each metabolite. N= 10/group.
2.3 Metabolomic Statistical Analyses
Metaboanalyst (v3.0) run on the statistical package R (v2.14.0) used metabolite peaks areas (as representative of concentration) (Xia et al. 2009; Xia et al. 2015). These data were first analyzed by an unsupervised principal component analysis (PCA), which identified the presence of the human islet amyloid polypeptide (hIAPP)-amylin as the principal source of variance. The metabolites that best differentiated the groups were then individually tested using the Univariate analysis of individual component by t-test (Metaboanalyst v 3.0), and then the t test significant metabolites were matched to metabolomics pathways using the Pathway Analysis and enrichment analysis features in Metaboanalyst 3.0. To detect systemic metabolic signature of amylin, a One-Way Analysis of Variance (ANOVA) across the eight tissues and genotypes was performed (wildtypeHIPTg+ heart, HIPTg+ heart, wildtypeHIPTg+ brain, HIPTg+ brain, wildtypeHIPTg+ liver, HIPTg+ liver, wildtypeHIPTg+ plasma, and HIPTg+ plasma) using Metaboanalyst v3.0, including both false discovery rate and significance (p). Only metabolites identified and detected in all groups were included in the One-Way ANOVA. If four or more values of each metabolite were missing in a given group, the entire metabolite was removed from the analysis. Only metabolites significantly altered in 2 or more organs were plotted to show systemic alterations induced by amylin. Data used in this study are available in Supplemental Table 1.13. Heat maps were generated using the GENE- E software (http://www.broadinstitute.org/cancer/software/GENE-E/index.html). All data is shown as mean +/− SEM, unless otherwise indicated.
2.4 Validation study
In order to differentiate amylin metabolic effect from diabetic metabolic signature, we compare our results with published non-targeted metabolomic datasets obtained from type 2 diabetic hearts (Kouzu et al. 2015). PubMed was searched using the terms “Metabolomics” “heart” “type 2 diabetes” and “rat”, resulting in two articles. We chose the dataset from Kouzu, et al., 2015 (Kouzu et al. 2015) for its similarity of T2D and baseline controls clinically. Metabolites identified in both our study and the Kouzu et al., 2015 (Kouzu et al. 2015). The four groups compared were: (1) wildtypeHIPTg+; (2) HIPTg+; (3) lean wildtype controls/Long-EvansTokushima-Otsuka/LETO; and (4) T2D/Otsuka Long-Evans Tokushima fatty/OLETF. Data were analyzed using SigmaPlot 11.0 after normalization to their respective wildtype controls (wildtypeHIPTg+ and LETO) and plotted as the mean +/− SEM. Raw data used in this validation study are available in Supplemental Table 2.
3 Results
Blinded non-targeted metabolomics analysis of cardiac samples identified and named 100 metabolites (Figure 1A). Using an unsupervised PCA analysis, the HIP cardiac metabolites separated into distinct population, with 47.7% of the differences accounted for by principal component 1 (Figure 1B). T-test analysis of these cardiac HIP metabolites identified 45 as significantly different (p<0.05) (Figure 1C) Of the significantly altered metabolites in HIP hearts, many are amino acids, including phenylalanine (0.5 fold wildtypeHIPTg+), tyrosine (0.5 fold wildtypeHIPTg+), glycine (0.5 fold wildtypeHIPTg+), serine (0.25 fold wildtypeHIPTg+), and lysine (not detected vs. detected in wildtypeHIPTg+)(Figure 1C). Pathway analysis enrichment of the t-test significant metabolites revealed the highest enrichment (~7-fold enrichment) in: 1) protein biosynthesis; 2) alpha-linolenic and linoleic acid metabolism; 3) Glycolysis; and 4) phenylalanine and tyrosine metabolism (Supplemental Figure 1A). Analysis against location based enrichment identified ~10 fold enrichment in “Basal Ganglia” metabolites, then lysosome, mitochondria, and skeletal muscle (Supplemental Figure 1B).
Blinded non-targeted metabolomics analysis of HIP brain samples identified and named 144 metabolites (Figure 2A). Unsupervised PCA analysis identified overlap between the HIP and wildtypeHIPTg+ brain metabolite signature (Figure 2B), with 30 t-test significant metabolites identified (Figure 2C). Similar to the cardiac metabolomics findings, the pathway enrichment analysis identified enrichment in the protein synthesis pathway (Supplemental Figure 2A). In addition, gluconeogenesis, phenylalanine/tyrosine metabolism, and the pentose metabolism pathways were highly enriched (>= 4 fold enrichment) (Supplemental Figure 2A). Like the heart, pathway analysis for location enrichment found a >15 fold enrichment in “Basal Ganglia” metabolites, along with muscle and skeletal muscle (~2 fold) (Supplemental Figure 2B). Interestingly, analysis against CSF metabolite pathways identified an 8-fold enrichment in “2-methyl-3 hydroxbutryl-CoA dehydrogenase (MHBD) deficiency” and “phenylketonuria” (Supplemental Figure 2C).
Figure 2. Non-targeted metabolomics of brain tissue in Human Amylin producing rat models (HIP rats).
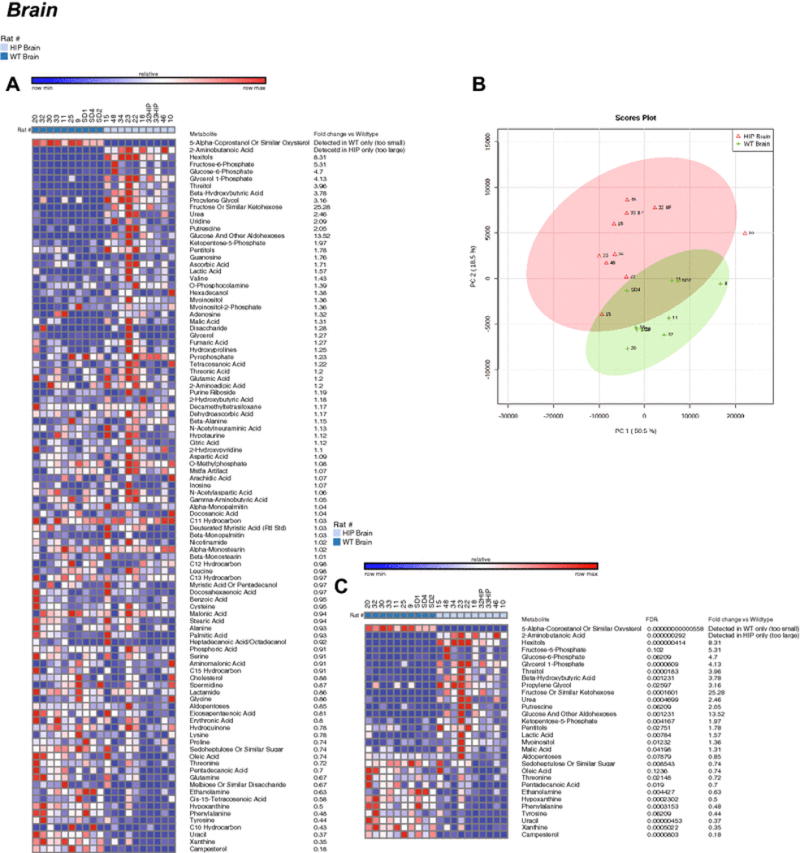
A. Heat map of metabolites identified by non-targeted GC/MS analysis of brain tissue. B. Principal components analysis. C. Heat map comparing HIP to wildtypeHIPTg+ brain t-test significant metabolites and indicating fold change and false discovery rates (FDR) for each metabolite. N=10/group.
Blinded non-targeted metabolomics analysis of HIP liver samples identified multiple metabolites that were not present in wildtypeHIPTg+ control rats, including cystine, 5-aminovaleric acid, cytidine-5′-monophosphate, and phytol along with elevated propylene glycol (Figure 3A). These metabolites demonstrated distinct signatures by PCS analysis (Figure 3B), and the uniquely present HIP liver metabolites identified (i.e. not found in wildtype livers) ranked among the top many t-test significant metabolites (Figure 3C). Pathway analysis revealed that alpha linolenic acid and linoleic acid metabolism, gluconeogenesis, and glycerolipid metabolism were the highest enriched (>3 fold, Supplemental Figure 3A). Location enrichment analysis identified “Basal Ganglia”, as in the brain prior, enriched ~7 fold (Supplemental Figure 3B).
Figure 3. Non-targeted metabolomics of liver tissue in Human Amylin producing rat models (HIP rats).
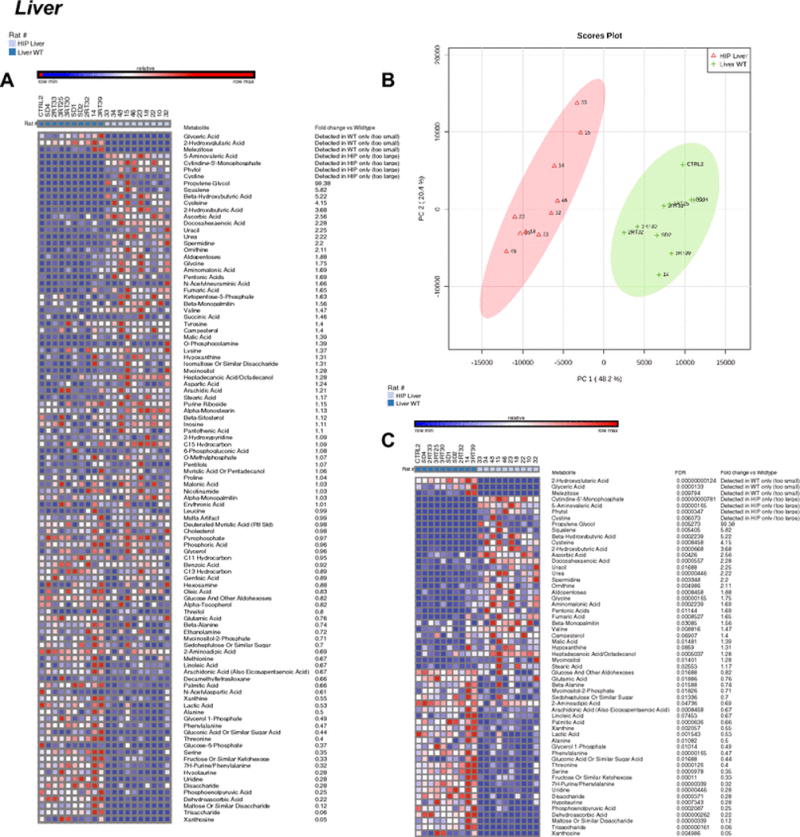
A. Heat map of metabolites identified by non-targeted GC/MS analysis of liver tissue. B. Principal components analysis. C. Heat map comparing HIP to wildtypeHIPTg+ liver t-test significant metabolites and indicating fold change and false discovery rates (FDR) for each metabolite. N=10/group.
In contrast, the differences in the non-targeted metabolomics analysis of parallel HIP plasma (Figure 4A) overlapped by PCA analysis (Figure 4B) and had only 16 t-test significant metabolites (Figure 4B). As identified in the heart and brain, protein biosynthesis was the most significantly enriched pathway (~7 fold), with biotin metabolism was also highly enriched >15 fold (Supplemental Figure 4).
To understand the metabolic signatures identified across the different organ systems, we next performed an ANOVA comparing heart, brain, liver, and plasma in HIP and wildtype rats (8 groups total). With a false discovery rate (FDR)<1ˆ10−9, we identified that fumarate (Figure 6A), phenylalanine (Figure 6B), α-monstearin (Figure 6C), and uracil (Figure 6D) were significantly different in the HIP heart, brain, and liver. Phenylalanine was uniquely decreased in the plasma as well, making it the only metabolite DECREASED in all four compartments tested in the HIP model (Figure 6B). In this same ANOVA analysis, eight additional metabolites were significantly elevated in at least two compartments (Table 2), with lysine being the only one additionally found in plasma. While the ANOVA analysis across all four organs allowed the direct comparison of amino acids identified in all organs, there were multiple amino acids that were not detected in at least one organ (Supplemental Table 2, primarily right half of table). Significant alterations were seen in glutamic acid (heart and Liver), ornithine, cysteine and cystine (Liver only) (Supplemental Table 2).
Figure 6. ANOVA significant metabolites found in three or tissues by Post-Hoc analysis across tissues.
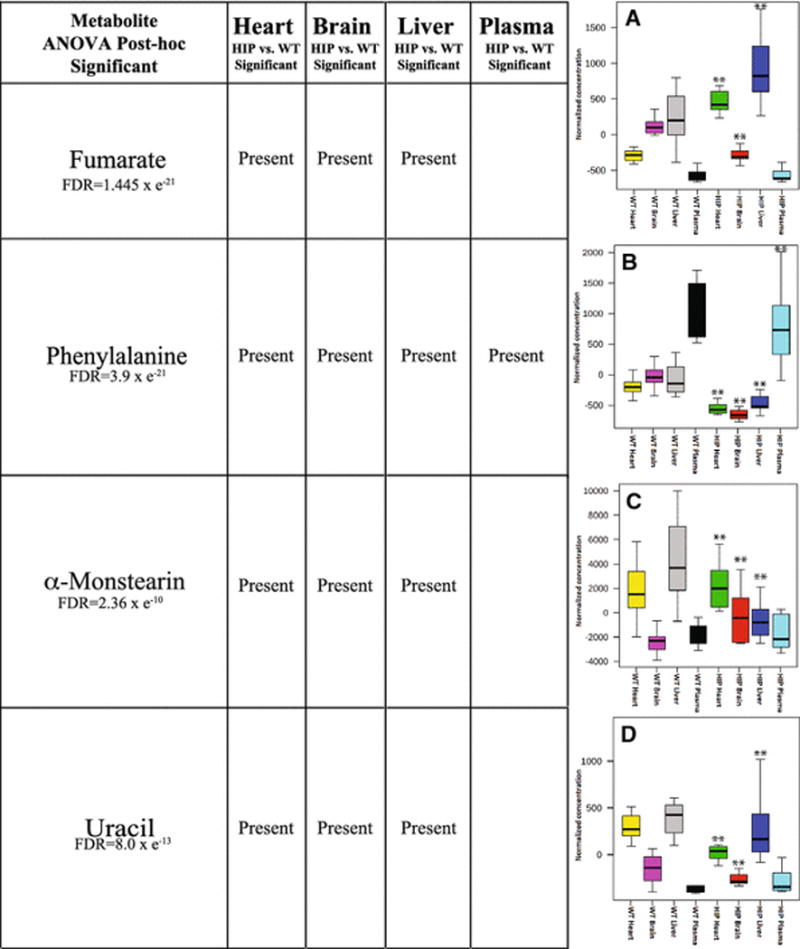
Box and whisper plot (indicating median, upper and lower quartile (box limits), and upper and lower extremes (error bars)) of fold change comparison between 8 groups with respect to A. Fumarate, B. Phenylalanine, C. α-Monstearin, and D. Uracil. A One-Way ANOVA was performed, with Fisher-LSD post-hoc comparisons made to the wildtypeHIPTg+ heart. **False discovery rate (FDR) ≤ 1.61 × e−7.
Table 2.
ANOVA significant metabolites found in two tissues by Post-Hoc analysis across tissues.
| Metabolite ANOVA Post-hoc (FDR≤1.61 × e−7) |
Heart HIP vs. WT Significant |
Brain HIP vs. WT Significant |
Liver HIP vs. WT Significant |
Plasma HIP vs. WT Significant |
|---|---|---|---|---|
| Lysine FDR=2.56 × e−29 |
✻ | ✻ | ||
| Stearic acid FDR=5.42 × e−20 |
✻ | ✻ | ||
| Urea FDR=8.46 × e−20 |
✻ | ✻ | ||
| Glycerol-1-phosphate FDR=1.35 × e−18 |
✻ | ✻ | ||
| Glucose-6-phosphate FDR=4.40 × e−11 |
✻ | ✻ | ||
| Campesterol FDR=7.82 × e−11 |
✻ | ✻ | ||
| Docosahexaneoic acid FDR=1.46 × e−9 |
✻ | ✻ | ||
| Heptadecanoic acid/Octadecanol FDR=1.61 × e−7 |
✻ | ✻ |
One of the complexities of the HIP model studied here is the fact that while the HIP rats are not initially diabetic, they develop diabetes as the proteotoxicity of the human amylin kills the pancreatic beta cells. Distinguishing the metabolic signatures of the type 2 diabetes from the amylin proteotoxicity component was what we next addressed using a published non-targeted metabolomics data set in a type 2 diabetes rat model recently published (Kouzu et al. 2015). Using an ANOVA analysis of the cardiac HIP (and strain-matched wildtype) significant metabolites with the recently published T2D (and strain-matched wildtype) significant metabolites revealed that both models had similar significant decreases in glycine (HIP vs. T2D p>0.05; HIP vs. wildtypeHIPTg+ p=0.001, T2D vs wildtypeT2D p=0.028) and similar significant increases in leucine (Figure 6, indicated with boxes). This confirms the expected overlap of the HIP and T2D models. Interestingly, we identified eight metabolites that were significantly different in the HIP heart, but not in the T2D heart: including pyruvate, malate, citrate, fumarate, urea, glycerol-1-phosphate, fructose-6-phosphate, glucose-6-phosphate, and hypoxanthine (Figure 6A, indicated by *). Significantly altered amino acids found in the HIP heart, but not in the T2D heart, including: lysine, alanine, tyrosine, phenylalanine, serine, threonine, glutamic acid, and valine (Figure 6B, indicated by *). Uniquely, HIP heart had significantly INCREASED fructose-6-phosphate and glucose-6-phosphate, which was not seen in the T2D hearts (Figure 6A). The HIP heart had significantly DECREASED alanine, tyrosine, and phenylalanine in contrast to the significantly INCREASED levels of these amino acids in the T2D hearts (Figure 6B).
4 Discussion
In contrast to previous studies illustrating alterations in amino acid levels in just the diabetic heart, the current studies demonstrate that these changes occur systemically across multiple organs (heart, brain, liver, plasma, Figure 6, Supplemental Table 3). Protein biosynthesis was the highest enriched pathway in the HIP heart and brain, with a greater than five-fold enrichment by pathway analysis (Supplemental Figures 1 & 2). Alterations in phenylalanine metabolism and aminoacyl-tRNA biosynthesis were specifically identified as affected (Supplemental Figure 5A, 5D). These studies build upon sparse reports of decreased phenylalanine in diabetic hearts (Rampersad, Wool 1965), increased protein degradation in muscle (Ashford, Pain 1986), and alterations in mitochondrial protein synthesis (Boirie et al. 2001). The present study illustrates that changes in tyrosine metabolism are affected more widely, including tyrosine decreases in heart (Figure 5A), phenylalanine decreases in heart and Liver and increased fumarate, a degradation product of tyrosine/phenylalanine metabolism (Figure 5A, Figure 6A). Evidence for increased protein degradation comes from the finding that there is increased tyrosine/phenylalanine degradation product fumarate (Figure 5A, Figure 6A), and the finding that urea and intermediates of the urea cycle are increased (Figure 5B, Figure 6B). As systemic protein degradation is a major up-regulator of urea cycle in diabetes (Jorda et al. 1982; Li et al. 2010; Schutz 2011), the present findings may demonstrate a relationship here in linking amylin and diabetes with the urea cycle changes identified here. Given the close connection between increased protein catabolism, morbidity and increased hospital stay and mortality, the connection between diabetes in chronic and acute diseases may lie in processes beyond the effects on glucose metabolism (Pasini et al. 2014; Pasini et al. 2013).
Figure 5. Metabolic pathways affected in the hearts of HIP rats, determined by non-targeted metabolomics analysis.
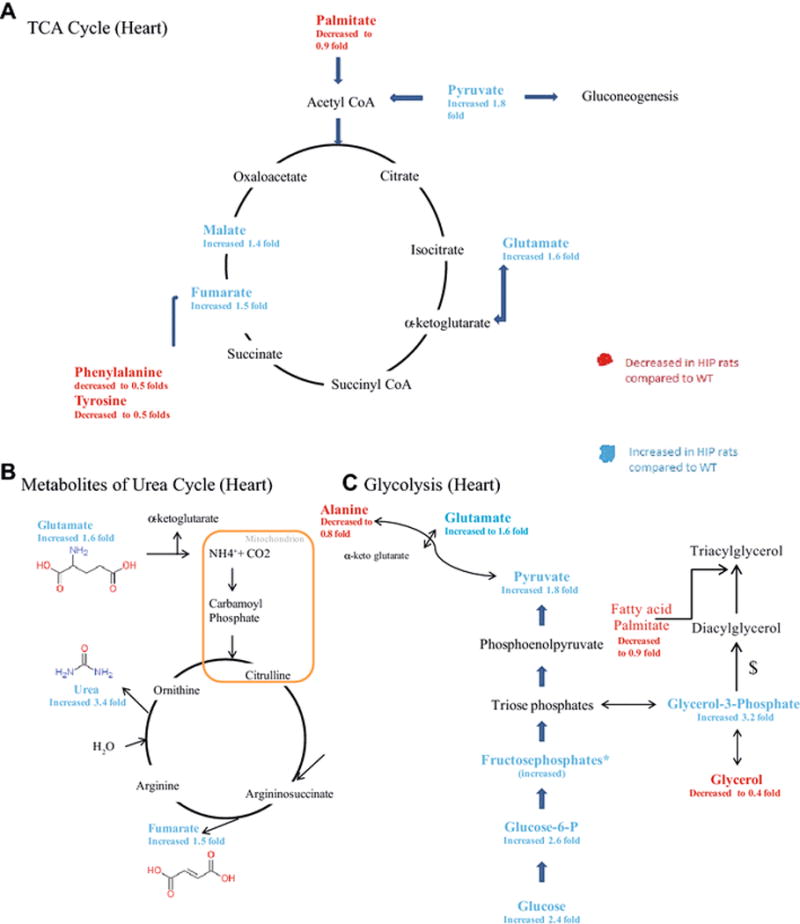
Metabolites were highlighted depending on their fold change compared to WT. Red highlight shows a decrease in fold change compared to WT. Blue Highlight shows an increase in fold change compared to wildtypeHIPTg+. A. TCA Cycle. B. Urea Cycle. C. Glycolysis. *Multiple species present. $involves multiple steps, not included.
The comparison of non-targeted metabolomics found in the HIP rat heart compared to a strictly T2D model in the present study identified unique metabolomics alterations in the HIP heart not attributable to T2D (Supplemental Figure 6). HIP hearts exhibited significant increases in TCA cycle metabolites (pyruvate and urea) and metabolites involved in gluconeogenesis (glycerol-1-phosphate, fructose-6-phosphate, and glucose-6-phosphate)(Supplemental Figure 6A). HIP hearts exhibited significant alterations in amino acids, with 5 being significantly DECREASED (lysine, alanine, tyrosine, phenylalanine, serine) and 1 INCREASED (valine) compared to T2D (Supplemental Figure 6B). This contrasts with the significantly INCREASED phenylalanine reported in diabetics vs. controls in multiple recent studies (Kouzu et al. 2015; Tillin et al. 2015; Wurtz et al. 2015). The HIP rats at one year exhibited this significant decreases across all four tissues investigated, including plasma (Figure 6). This illustrates that DECREASE phenylalanine may be worth following as it correlates with HIP induced cardiac and brain dysfunction, but unrelated to the presence of T2D.
The deficiency in phenylalanine and tyrosine in HIP brains (<0.50 fold vs. wildtypeHIPTg+) is significant given their role in supporting brain chemistry (Figure 2). Tyrosine (and its precursor phenylalanine) in the brain function as precursors for catecholamines (dopamine, norepinephrine, epinephrine) (Fernstrom, Fernstrom 2007). Deficiency in dopamine, requiring these metabolites, contributes to early visual dysfunction in experimental type 1diabetes (Aung et al. 2014). Other studies of experimental type 1 diabetes have demonstrated that brain phenylalanine is decreased by an average of 40% throughout the entire brain, with a depressed influx of 35%, suggesting these decreases are due to transport defects (Mans et al. 1987). The detection of elevated brain ketones, such as beta-hydroxybutyric acid in HIP mice nearly 4-fold, is not unexpected given their diabetic status (Figure 2B). Cerebral beta-hydroxybutyric acid has been detected by MR spectroscopy in children with diabetic ketoacidosis (Wootton-Gorges et al. 2005) and in other rat models (Reusch et al. 2003), which alters glucose metabolism, glutamine, glutamate, and GABA (Lapidot, Haber 2001).
Interestingly, the alterations in the pentose phosphate pathway (PPP) that were identified in the brain in the current study (Figure 2, i.e. glucose-6-phosphate elevated 4.7 fold, fructose-6-phosphate elevated 5.3 fold) have previously been seen in the brain in neurodegenerative diseases. Unlike most other cell types, neurons preferentially metabolize glucose using the pentose phosphate pathway to maintain their anti-oxidant status. Inhibiting this pathway results in selective dopaminergic cell death leading to motor deficits resembling Parkinson’s disease (Dunn et al. 2014). In Parkinson’s disease brain tissues, down-regulation of PPP enzymes and failure to increase antioxidant reserve is an early event in the pathogenesis of sporadic Parkinson’s disease (Dunn et al. 2014), which parallels findings of reduced pentose phosphate fluxes are reduced in amyloid beta protein precursor (AbetaPP) mice and Alzheimer’s disease patients (Tiwari, Patel 2014). Importantly, these alterations are not characteristic of diabetes. Since the hyperamylinemia modeled in the present HIP model demonstrated neurodegenerative plaques (Srodulski et al. 2014) and amylin co-staining with tau protein to accelerate the (Jackson et al. 2013; Qiu et al. 2014). Therefore, the present studies may offer mechanistic detail of amylin-driven pathology apart from the diabetes-associated pathology both seen in the present animal model.
Similar to the metabolites found in the brain that were linked to hyperamylinemia-induced proteotoxicity, the identification of cystine uniquely in the HIP liver (Figure 3) was interesting as it has been identified in previously studies as a potential biomarker of Alzheimer’s Disease (Gonzalez-Dominguez et al. 2015). As an important metabolic intermediate in glutathione metabolism, cystine may offer clues to oxidative stress not previously reported in the liver. While its not surprising to see alterations in anti-oxidant systems in the HIP rats given the inflammatory nature of diabetes in general and in this model specifically (Srodulski et al. 2014), the increased in the reduced 5-aminovaleric acid has been used to detect oxidative stress in atherosclerotic lesions by GC-MS (Pietzsch et al. 2004).
Recent studies applying non-targeted metabolomics to hyperglycemic mothers during pregnancy identified increased circulating levels of fructose, pentilols, and hexitols (Scholtens et al. 2014), similar to the significantly elevated hexitols (increased 3.9 and 2.1 fold, respectively), pentilols (increased 3.7 fold), and fructose (increased 2.3 fold) in the present study (Figure 4B). While the role of hexitol/pentitol metabolism in the pathophysiology of diabetes is not clear, it has been proposed to play a role in clinical observations in diabetic patients ingesting the glucose substitute xylitol (Makinen 2000). A glycation product that has been found in neurofibrillary pathology of Alzheimer’s disease lesion is hexitol, where hexitol-lysine adducts form in a distinct oxidative process acting in concert with Alzheimer’s disease lesions (Castellani et al. 2001). Together, elevated fructose, pentilols, and hexitols found in HIP plasma may offer insight in the pathogenesis of multiple organs affected by hyperamylinemia and diabetes.
Conclusions
HIP hearts had significant DECREASES in five amino acids (lysine, alanine, tyrosine, phenylalanine, serine) and one significantly INCREASED amino acids (valine), which were unique from a T2D rat model. Additionally, The HIP rats exhibited a significant decrease in phenylalanine across all four tissues investigated, including plasma. This contrasts with the significantly INCREASED circulating phenylalanine reported in diabetics vs. controls in multiple recent studies (Kouzu et al. 2015; Tillin et al. 2015; Wurtz et al. 2015). DECREASED phenylalanine may serve as a unique marker of cardiac and brain dysfunction due to hyperamylinemia that can be differentiated from alterations in T2D in the plasma.
The deficiency in phenylalanine and tyrosine in HIP brains (<0.50 fold vs. wildtypeHIPTg+) is significant given their role in supporting brain chemistry. Tyrosine (and its precursor phenylalanine) in the brain function as precursors for catecholamines (dopamine, norepinephrine, epinephrine). While the deficiency in phenylalanine was seen across tissues including plasma and could be monitored, reduced tyrosine was seen only in the brain. The alterations in the pentose phosphate pathway (PPP) identified in the HIP brain (elevated glucose-6-phosphate and fructose-6-phosphate) have previously been seen in the brain in neurodegenerative diseases. Unlike most other cell types, neurons preferentially metabolize glucose using the pentose phosphate pathway to maintain their anti-oxidant status. However, altered glucose-6-phosphate was seen only in the heart and brain and was not detectable in the plasma.
Supplementary Material
A. Enrichment by pathway-associated metabolite sets. B. Location-Based Metabolite sets determined from t-test significant metabolites identified.
Enrichment by A. Pathway-associated metabolite sets, B. Location-Based Metabolite sets, and C. Disease-associated metabolite sets in the brain determined from from t-test significant metabolites identified.
Enrichment by A. Pathway-associated metabolite sets and B. Location-Based Metabolite sets determined from from t-test significant metabolites identified.
Enrichment by A. Pathway-associated metabolite sets, B. Location-Based Metabolite sets, and C. Disease-associated metabolite sets in the blood determined from from t-test significant metabolites identified.
Supplemental Figure 5. Pathway enrichment analysis of significant metabolite sets identified by non-targeted cardiac metabolomics. A. Heart, B. Brain, C. Liver, and D. Plasma. A–D indicates top pathways identified, along with the specific significant metabolites found that placed it in this category.
Supplemental Figure 6. Significantly altered HIP-unique metabolites found by non-targeted metabolomics analysis of the heart using a recently published type 2 diabetes model (Kouzu et al. 2015). Data was normalized to the strain-matched wildtype control, followed by an ANOVA analysis of all four groups and included significantly altered metabolites found in both studies (see supplemental materials and methods for details, Supplemental Table 2 for data used in analysis). A. HIP significant cardiac metabolites, not altered in T2D model (indicated by *). B. HIP significant cardiac amino acids, not altered in T2D model (indicated by *). C. Comparison of HIP transgenic model (current study) and T2D model used in this analysis recently published (Kouzu et al. 2015). Boxes indicate similarly altered metabolites in both HIP and T2D models. A One-Way ANOVA was performed, with Holm-Sidak post-hoc comparisons made to the wildtypeHIPTg+. Significance was defined as p<0.05. Data is mean +/− SEM.
Table 1.
Glucose levels at harvest in samples used to assay heart, brain, Liver, and plasma in the HIP and control animals.
| WT rat Heart (8 samples) |
WT rat Brain (10 samples) |
WT rat Plasma (10 samples) |
WT rat Liver (10 samples) |
||||||||
|---|---|---|---|---|---|---|---|---|---|---|---|
| sample ID | Age (month) |
Non fasted Blood glucose (mg/dl) | sample ID | Age (month) |
Non fasted Blood glucose (mg/dl) | sample ID | Age (month) |
Non fasted Blood glucose (mg/dl) | sample ID | Age (month) |
Non fasted Blood glucose (mg/dl) |
| SD1 | 12 | 124 | SD1 | 12 | 124 | CTRL 2 | 13 | 113 | CTRL 2 | 13 | 113 |
| SD2 | 12 | 128 | SD2 | 12 | 128 | SD1 | 12 | 124 | SD1 | 12 | 124 |
| SD4 | 12 | 97 | SD4 | 12 | 97 | SD2 | 12 | 128 | SD2 | 12 | 128 |
| 2RT32 | 12 | 132 | 3RT25 | 16 | 127 | SD4 | 12 | 97 | SD4 | 12 | 97 |
| 2RT33 | 12 | 126 | 3RT30 | 12 | 140 | 41 | 13 | 132 | 41 | 13 | 132 |
| 3RT30 | 12 | 140 | 3RT32 | 12 | 123 | 3RT39 | 16 | 117 | 3RT39 | 16 | 117 |
| 3RT32 | 12 | 123 | 3RT33 | 12 | 129 | 3RT25 | 16 | 127 | 2RT32 | 12 | 132 |
| 3RT33 | 12 | 129 | 2RT9 | 9 | Not Determined | 2RT13 | 9 | N/A | 2RT33 | 12 | 126 |
| 2RT20 | 9 | Not Determined | 2RT14 | 9 | N/A | 3RT25 | 16 | 127 | |||
| 2RT11 | 9 | Not Determined | 2RT15 | 9 | N/A | 3RT30 | 12 | 140 | |||
| HIP rat Heart (10 samples) |
HIP rat Brain (10 samples) |
HIP rat Plasma (10 samples) |
HIP rat Liver (10 samples) |
||||||||
|---|---|---|---|---|---|---|---|---|---|---|---|
| sample ID | Age (month) |
Non fasted Blood glucose (mg/dl) | sample ID | Age (month) |
Non fasted Blood glucose (mg/dl) | sample ID | Age (month) |
Non fasted Blood glucose (mg/dl) | sample ID | Age (month) |
Non fasted Blood glucose (mg/dl) |
| 22 | 12 | 567 | 22 | 12 | 567 | 7 | 9 | 429 | 22 | 12 | 567 |
| 32 | 12 | 600 | 32 | 12 | 600 | 24 | 12 | 326 | 32 | 12 | 600 |
| 33 | 12 | 600 | 33 | 12 | 600 | 26 | 12 | 392 | 33 | 12 | 600 |
| 34 | 12 | 600 | 34 | 12 | 600 | 31 | 12 | 379 | 34 | 12 | 600 |
| 48 | 12 | 600 | 48 | 12 | 600 | 38 | 12 | 491 | 48 | 12 | 600 |
| 10 | 10 | 445 | 10 | 10 | 445 | 11 | 13 | 516 | 10 | 10 | 445 |
| 15 | 12 | 600 | 15 | 12 | 600 | 17 | 13 | 459 | 15 | 12 | 600 |
| 18 | 12 | 480 | 18 | 12 | 480 | 25 | 13 | 441 | 18 | 12 | 480 |
| 23 | 10 | 562 | 23 | 10 | 562 | 43 | 13 | 476 | 23 | 10 | 562 |
| 46 | 12 | 600 | 46 | 12 | 600 | 5RT14 | 18 | 383 | 46 | 12 | 600 |
|
>600 imputed with 600 (underestimated) 6 imputed |
>600 imputed with 600 (underestimated) 6 imputed |
None imputed |
>600 imputed with 600 (underestimated) 6 imputed |
||||||||
Acknowledgments
This work was supported by the National Institutes of Health (R01HL104129 to M.W.; R01HL118474 to F.D.), a Jefferson-Pilot Corporation Fellowship (to M.W.), National Science Foundation (CBET 1357600 to F.D.), Alzheimer’s Association (VMF-15-363458 to FD) and the Leducq Foundation (to M.W.).
Non-standard abbreviations
- AbetaPP
amyloid beta protein precursor
- GABA
gamma-Aminobutyric acid
- HIP
rat model expressing pancreatic human amylin
- hIAPP
human islet amyloid polypeptide
- PCA
principal component analysis
- PLS-DA
partial least squares discriminant analysis
- VIP
variable importance in projection
Footnotes
Conflict of interest
The authors declare that they have no conflict of interest.
Compliance with Ethical Standards
All applicable international, national, and/or institutional guidelines for the care and use of animals were followed. This includes, but is not limited to, the specific statements below.
*The manuscript has not been submitted to more than one journal for simultaneousconsideration.
*The manuscript has not been published previously (partly or in full).
*No data have been fabricated or manipulated (including images) to support your conclusions
*No data, text, or theories by others are presented as if they were the author’s own (“plagiarism”).
Contributor Information
Amro Ilaiwy, University of Damascus, Faculty of Medicine; Sarah W. Stedman Nutrition and Metabolism Center, Duke Molecular Physiology Institute, Duke University Medical Center, Durham, NC, USA; Division of Endocrinology, Metabolism, and Nutrition, Department of Medicine, Duke University Medical Center, Durham, NC, USA.
Miao Liu, Department of Pharmacology and Nutritional Sciences, University of Kentucky, Lexington, KY, USA.
Traci L. Parry, McAllister Heart Institute, University of North Carolina, Chapel Hill, NC, USA
James R. Bain, Sarah W. Stedman Nutrition and Metabolism Center, Duke Molecular Physiology Institute, Duke University Medical Center, Durham, NC, USA Division of Endocrinology, Metabolism, and Nutrition, Department of Medicine, Duke University Medical Center, Durham, NC, USA.
Christopher B. Newgard, Sarah W. Stedman Nutrition and Metabolism Center, Duke Molecular Physiology Institute, Duke University Medical Center, Durham, NC, USA Division of Endocrinology, Metabolism, and Nutrition, Department of Medicine, Duke University Medical Center, Durham, NC, USA.
Jonathan C. Schisler, Department of Pharmacology, University of North Carolina, Chapel Hill, NC, USA McAllister Heart Institute, University of North Carolina, Chapel Hill, NC, USA.
Michael J. Muehlbauer, Sarah W. Stedman Nutrition and Metabolism Center, Duke Molecular Physiology Institute, Duke University Medical Center, Durham, NC, USA
Florin Despa, Department of Pharmacology and Nutritional Sciences, University of Kentucky, Lexington, KY, USA.
Monte S. Willis, Department of Pharmacology, University of North Carolina, Chapel Hill, NC, USA McAllister Heart Institute, University of North Carolina, Chapel Hill, NC, USA; Department of Pathology & Laboratory Medicine, University of North Carolina, Chapel Hill, NC, USA.
References
- Ashford AJ, Pain VM. Effect of diabetes on the rates of synthesis and degradation of ribosomes in rat muscle and liver in vivo. J Biol Chem. 1986;261:4059–65. [PubMed] [Google Scholar]
- Aung MH, et al. Dopamine deficiency contributes to early visual dysfunction in a rodent model of type 1 diabetes. J Neurosci. 2014;34:726–36. doi: 10.1523/JNEUROSCI.3483-13.2014. [DOI] [PMC free article] [PubMed] [Google Scholar]
- Banerjee R, et al. Non-targeted metabolomics of double-mutant cardiomyocytes reveals a novel role for SWI/SNF complexes in metabolic homeostasis. Metabolomics. 2015;11:1287–1301. doi: 10.1007/s11306-015-0786-7. [DOI] [PMC free article] [PubMed] [Google Scholar]
- Boirie Y, Short KR, Ahlman B, Charlton M, Nair KS. Tissue-specific regulation of mitochondrial and cytoplasmic protein synthesis rates by insulin. Diabetes. 2001;50:2652–8. doi: 10.2337/diabetes.50.12.2652. [DOI] [PubMed] [Google Scholar]
- Castellani RJ, et al. Active glycation in neurofibrillary pathology of Alzheimer disease: N(epsilon)-(carboxymethyl) lysine and hexitol-lysine. Free Radic Biol Med. 2001;31:175–80. doi: 10.1016/s0891-5849(01)00570-6. [DOI] [PubMed] [Google Scholar]
- Despa S, et al. Hyperamylinemia contributes to cardiac dysfunction in obesity and diabetes: a study in humans and rats. Circ Res. 2012;110:598–608. doi: 10.1161/CIRCRESAHA.111.258285. [DOI] [PMC free article] [PubMed] [Google Scholar]
- Despa S, et al. Cardioprotection by controlling hyperamylinemia in a “humanized” diabetic rat model. J Am Heart Assoc. 2014;3 doi: 10.1161/JAHA.114.001015. [DOI] [PMC free article] [PubMed] [Google Scholar]
- Dunn L, et al. Dysregulation of glucose metabolism is an early event in sporadic Parkinson’s disease. Neurobiol Aging. 2014;35:1111–5. doi: 10.1016/j.neurobiolaging.2013.11.001. [DOI] [PMC free article] [PubMed] [Google Scholar]
- Erickson JR, et al. Diabetic hyperglycaemia activates CaMKII and arrhythmias by O-linked glycosylation. Nature. 2013;502:372–6. doi: 10.1038/nature12537. [DOI] [PMC free article] [PubMed] [Google Scholar]
- Fernstrom JD, Fernstrom MH. Tyrosine, phenylalanine, and catecholamine synthesis and function in the brain. J Nutr. 2007;137:1539S–1547S. doi: 10.1093/jn/137.6.1539S. discussion 1548S. [DOI] [PubMed] [Google Scholar]
- Gonzalez-Dominguez R, Garcia-Barrera T, Gomez-Ariza JL. Metabolite profiling for the identification of altered metabolic pathways in Alzheimer’s disease. J Pharm Biomed Anal. 2015;107:75–81. doi: 10.1016/j.jpba.2014.10.010. [DOI] [PubMed] [Google Scholar]
- Hay DL, Chen S, Lutz TA, Parkes DG, Roth JD. Amylin: Pharmacology, Physiology, and Clinical Potential. Pharmacol Rev. 2015;67:564–600. doi: 10.1124/pr.115.010629. [DOI] [PubMed] [Google Scholar]
- Jackson K, Barisone GA, Diaz E, Jin LW, DeCarli C, Despa F. Amylin deposition in the brain: A second amyloid in Alzheimer disease? Ann Neurol. 2013;74:517–26. doi: 10.1002/ana.23956. [DOI] [PMC free article] [PubMed] [Google Scholar]
- Jorda A, Gomez M, Cabo J, Grisolia S. Effect of streptozotocin diabetes on some urea cycle enzymes. Biochem Biophys Res Commun. 1982;106:37–43. doi: 10.1016/0006-291x(82)92054-x. [DOI] [PubMed] [Google Scholar]
- Kouzu H, et al. Excessive degradation of adenine nucleotides by up-regulated AMP deaminase underlies afterload-induced diastolic dysfunction in the type 2 diabetic heart. J Mol Cell Cardiol. 2015;80:136–45. doi: 10.1016/j.yjmcc.2015.01.004. [DOI] [PubMed] [Google Scholar]
- Lambert R, Srodulski S, Peng X, Margulies KB, Despa F, Despa S. Intracellular Na+ Concentration ([Na+]i) Is Elevated in Diabetic Hearts Due to Enhanced Na+-Glucose Cotransport. J Am Heart Assoc. 2015;4 doi: 10.1161/JAHA.115.002183. [DOI] [PMC free article] [PubMed] [Google Scholar]
- Lapidot A, Haber S. Effect of endogenous beta-hydroxybutyrate on glucose metabolism in the diabetic rabbit brain: a (13)C-magnetic resonance spectroscopy study of [U-(13)C]glucose metabolites. J Neurosci Res. 2001;64:207–16. doi: 10.1002/jnr.1067. [DOI] [PubMed] [Google Scholar]
- Li LO, Hu YF, Wang L, Mitchell M, Berger A, Coleman RA. Early hepatic insulin resistance in mice: a metabolomics analysis. Mol Endocrinol. 2010;24:657–66. doi: 10.1210/me.2009-0152. [DOI] [PMC free article] [PubMed] [Google Scholar]
- Lutz TA, Meyer U. Amylin at the interface between metabolic and neurodegenerative disorders. Front Neurosci. 2015;9:216. doi: 10.3389/fnins.2015.00216. [DOI] [PMC free article] [PubMed] [Google Scholar]
- Makinen KK. Can the pentitol-hexitol theory explain the clinical observations made with xylitol? Med Hypotheses. 2000;54:603–13. doi: 10.1054/mehy.1999.0904. [DOI] [PubMed] [Google Scholar]
- Mans AM, DeJoseph MR, Davis DW, Hawkins RA. Regional amino acid transport into brain during diabetes: effect of plasma amino acids. Am J Physiol. 1987;253:E575–83. doi: 10.1152/ajpendo.1987.253.5.E575. [DOI] [PubMed] [Google Scholar]
- Pasini E, Aquilani R, Corsetti G, Dioguardi FS. Biomarkers to Identify Protein Metabolism Impairment in Chronic/Acute Diseases. J Mol Biomark Diagn. 2014;5:176–179. [Google Scholar]
- Pasini E, Aquilani R, Dioguardi FS. “The enemy within”. How to identify chronic diseases induced-protein metabolism impairment and its possible pharmacological treatment. Pharmacol Res. 2013;76:28–33. doi: 10.1016/j.phrs.2013.06.006. [DOI] [PubMed] [Google Scholar]
- Pietzsch J, Bergmann R, Kopprasch S. Analysis of non-protein amino acids as specific markers of low density lipoprotein apolipoprotein B-100 oxidation in human atherosclerotic lesions: the use of N(O)-ethoxycarbonyl trifluoroethyl ester derivatives and GC-MS. Spectroscopy. 2004;18:177–183. [Google Scholar]
- Qiu WQ, Wallack M, Dean M, Liebson E, Mwamburi M, Zhu H. Association between amylin and amyloid-beta peptides in plasma in the context of apolipoprotein E4 allele. PLoS One. 2014;9:e88063. doi: 10.1371/journal.pone.0088063. [DOI] [PMC free article] [PubMed] [Google Scholar]
- Rampersad OR, Wool IG. Protein synthesis by ribosomes from heart muscle: effect of insulin and diabetes. Science. 1965;149:1102–3. doi: 10.1126/science.149.3688.1102. [DOI] [PubMed] [Google Scholar]
- Reusch RN, Bryant EM, Henry DN. Increased poly-(R)-3-hydroxybutyrate concentrations in streptozotocin (STZ) diabetic rats. Acta Diabetol. 2003;40:91–4. doi: 10.1007/s005920300011. [DOI] [PubMed] [Google Scholar]
- Scholtens DM, et al. Metabolomics reveals broad-scale metabolic perturbations in hyperglycemic mothers during pregnancy. Diabetes Care. 2014;37:158–66. doi: 10.2337/dc13-0989. [DOI] [PMC free article] [PubMed] [Google Scholar]
- Schutz Y. Protein turnover, ureagenesis and gluconeogenesis. Int J Vitam Nutr Res. 2011;81:101–7. doi: 10.1024/0300-9831/a000064. [DOI] [PubMed] [Google Scholar]
- Srodulski S, et al. Neuroinflammation and neurologic deficits in diabetes linked to brain accumulation of amylin. Mol Neurodegener. 2014;9:30. doi: 10.1186/1750-1326-9-30. [DOI] [PMC free article] [PubMed] [Google Scholar]
- Tillin T, et al. Diabetes risk and amino acid profiles: cross-sectional and prospective analyses of ethnicity, amino acids and diabetes in a South Asian and European cohort from the SABRE (Southall And Brent REvisited) Study. Diabetologia. 2015;58:968–79. doi: 10.1007/s00125-015-3517-8. [DOI] [PMC free article] [PubMed] [Google Scholar]
- Tiwari V, Patel AB. Pyruvate carboxylase and pentose phosphate fluxes are reduced in AbetaPP-PS1 mouse model of Alzheimer’s disease: a (1)(3)C NMR study. J Alzheimers Dis. 2014;41:387–99. doi: 10.3233/JAD-122449. [DOI] [PubMed] [Google Scholar]
- Verdile G, Fuller SJ, Martins RN. The role of type 2 diabetes in neurodegeneration. Neurobiol Dis. 2015 doi: 10.1016/j.nbd.2015.04.008. [DOI] [PubMed] [Google Scholar]
- Wootton-Gorges SL, et al. Detection of cerebral {beta}-hydroxy butyrate, acetoacetate, and lactate on proton MR spectroscopy in children with diabetic ketoacidosis. AJNR Am J Neuroradiol. 2005;26:1286–91. [PMC free article] [PubMed] [Google Scholar]
- Wurtz P, et al. Metabolite profiling and cardiovascular event risk: a prospective study of 3 population-based cohorts. Circulation. 2015;131:774–85. doi: 10.1161/CIRCULATIONAHA.114.013116. [DOI] [PMC free article] [PubMed] [Google Scholar]
- Xia J, Psychogios N, Young N, Wishart DS. MetaboAnalyst: a web server for metabolomic data analysis and interpretation. Nucleic Acids Res. 2009;37:W652–60. doi: 10.1093/nar/gkp356. [DOI] [PMC free article] [PubMed] [Google Scholar]
- Xia J, Sinelnikov IV, Han B, Wishart DS. MetaboAnalyst 3.0–making metabolomics more meaningful. Nucleic Acids Res. 2015;43:W251–7. doi: 10.1093/nar/gkv380. [DOI] [PMC free article] [PubMed] [Google Scholar]
- Xu F, Tavintharan S, Sum CF, Woon K, Lim SC, Ong CN. Metabolic signature shift in type 2 diabetes mellitus revealed by mass spectrometry-based metabolomics. J Clin Endocrinol Metab. 2013;98:E1060–5. doi: 10.1210/jc.2012-4132. [DOI] [PubMed] [Google Scholar]
Associated Data
This section collects any data citations, data availability statements, or supplementary materials included in this article.
Supplementary Materials
A. Enrichment by pathway-associated metabolite sets. B. Location-Based Metabolite sets determined from t-test significant metabolites identified.
Enrichment by A. Pathway-associated metabolite sets, B. Location-Based Metabolite sets, and C. Disease-associated metabolite sets in the brain determined from from t-test significant metabolites identified.
Enrichment by A. Pathway-associated metabolite sets and B. Location-Based Metabolite sets determined from from t-test significant metabolites identified.
Enrichment by A. Pathway-associated metabolite sets, B. Location-Based Metabolite sets, and C. Disease-associated metabolite sets in the blood determined from from t-test significant metabolites identified.
Supplemental Figure 5. Pathway enrichment analysis of significant metabolite sets identified by non-targeted cardiac metabolomics. A. Heart, B. Brain, C. Liver, and D. Plasma. A–D indicates top pathways identified, along with the specific significant metabolites found that placed it in this category.
Supplemental Figure 6. Significantly altered HIP-unique metabolites found by non-targeted metabolomics analysis of the heart using a recently published type 2 diabetes model (Kouzu et al. 2015). Data was normalized to the strain-matched wildtype control, followed by an ANOVA analysis of all four groups and included significantly altered metabolites found in both studies (see supplemental materials and methods for details, Supplemental Table 2 for data used in analysis). A. HIP significant cardiac metabolites, not altered in T2D model (indicated by *). B. HIP significant cardiac amino acids, not altered in T2D model (indicated by *). C. Comparison of HIP transgenic model (current study) and T2D model used in this analysis recently published (Kouzu et al. 2015). Boxes indicate similarly altered metabolites in both HIP and T2D models. A One-Way ANOVA was performed, with Holm-Sidak post-hoc comparisons made to the wildtypeHIPTg+. Significance was defined as p<0.05. Data is mean +/− SEM.